Free Statistics

of Irreproducible Research!

Author's title

Author*Unverified author*
R Software Modulerwasp_smp.wasp
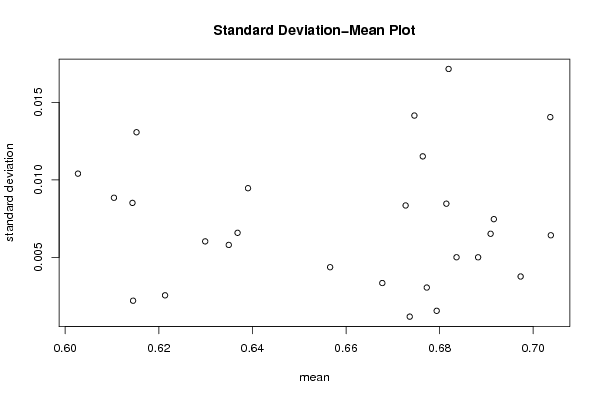
Title produced by softwareStandard Deviation-Mean Plot
Date of computationMon, 19 May 2008 11:33:54 -0600
Cite this page as followsStatistical Computations at FreeStatistics.org, Office for Research Development and Education, URL https://freestatistics.org/blog/index.php?v=date/2008/May/19/t1211218486cln1y6wuz3neyx1.htm/, Retrieved Tue, 14 May 2024 01:24:08 +0000
Statistical Computations at FreeStatistics.org, Office for Research Development and Education, URL https://freestatistics.org/blog/index.php?pk=12910, Retrieved Tue, 14 May 2024 01:24:08 +0000
QR Codes:

Original text written by user:
IsPrivate?No (this computation is public)
User-defined keywords
Estimated Impact161
Family? (F = Feedback message, R = changed R code, M = changed R Module, P = changed Parameters, D = changed Data)
-       [Standard Deviation-Mean Plot] [Nicky Van Calster...] [2008-05-19 17:33:54] [9e4ffec01482233a36a742caf4f37457] [Current]
Feedback Forum

Post a new message
Dataseries X:
0.70291
0.6885
0.67127
0.66502
0.65825
0.65025
0.65779
0.66014
0.64683
0.64587
0.63702
0.62651
0.61834
0.61466
0.61063
0.59802
0.60151
0.62927
0.62304
0.6071
0.60773
0.58933
0.60039
0.61342
0.6348
0.634
0.62915
0.62168
0.61328
0.6089
0.60857
0.62672
0.62291
0.62393
0.61838
0.62012
0.61659
0.6116
0.61573
0.61407
0.62823
0.64405
0.6387
0.63633
0.63059
0.62994
0.63709
0.64217
0.65711
0.66977
0.68255
0.68902
0.71322
0.70224
0.70045
0.69919
0.69693
0.69763
0.69278
0.70196
0.69215
0.6769
0.67124
0.66532
0.67157
0.66428
0.66576
0.66942
0.6813
0.69144
0.69862
0.695
0.69867
0.68968
0.69233
0.68293
0.68399
0.66895
0.68756
0.68527
0.6776
0.68137
0.67933
0.67922
0.68598
0.68297
0.68935
0.69463
0.6833
0.68666
0.68782
0.67669
0.67511
0.67254
0.67397
0.67286
0.66341
0.668
0.68021
0.67934
0.68136
0.67562
0.6744
0.67766
0.68887
0.69614
0.70896
0.72064
0.74725


Summary of computational transaction
Raw Inputview raw input (R code)
Raw Outputview raw output of R engine
Computing time2 seconds
R Server'Gwilym Jenkins' @ 72.249.127.135

\begin{tabular}{lllllllll}
\hline
Summary of computational transaction \tabularnewline
Raw Input & view raw input (R code)  \tabularnewline
Raw Output & view raw output of R engine  \tabularnewline
Computing time & 2 seconds \tabularnewline
R Server & 'Gwilym Jenkins' @ 72.249.127.135 \tabularnewline
\hline
\end{tabular}
%Source: https://freestatistics.org/blog/index.php?pk=12910&T=0

[TABLE]
[ROW][C]Summary of computational transaction[/C][/ROW]
[ROW][C]Raw Input[/C][C]view raw input (R code) [/C][/ROW]
[ROW][C]Raw Output[/C][C]view raw output of R engine [/C][/ROW]
[ROW][C]Computing time[/C][C]2 seconds[/C][/ROW]
[ROW][C]R Server[/C][C]'Gwilym Jenkins' @ 72.249.127.135[/C][/ROW]
[/TABLE]
Source: https://freestatistics.org/blog/index.php?pk=12910&T=0

Globally Unique Identifier (entire table): ba.freestatistics.org/blog/index.php?pk=12910&T=0

As an alternative you can also use a QR Code:  

The GUIDs for individual cells are displayed in the table below:

Summary of computational transaction
Raw Inputview raw input (R code)
Raw Outputview raw output of R engine
Computing time2 seconds
R Server'Gwilym Jenkins' @ 72.249.127.135


Standard Deviation-Mean Plot
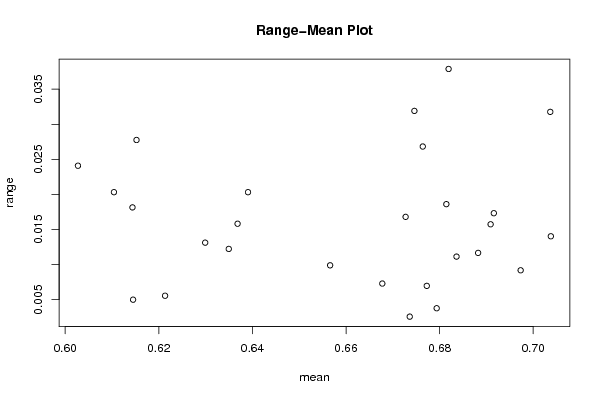
SectionMeanStandard DeviationRange
10.6819250.017155260612030.0378900000000001
20.65660750.00435861120847760.00988999999999995
30.63905750.009458912463914670.02032
40.61041250.008841339924845480.02032
50.615230.01306972328194700.02776
60.60271750.01039729251616330.0240899999999999
70.62990750.006026349779648270.0131200000000000
80.61436750.008510218857350280.01815
90.6213350.002544464580221120.00554999999999994
100.61449750.002196654653482550.00498999999999994
110.63682750.006578633976746270.0158200000000001
120.63494750.005797058880731390.0122300000000000
130.67461250.01414646333894090.03191
140.7037750.006419815677520120.01403
150.6973250.003758958189002220.00918000000000008
160.67640250.01151382466139440.02683
170.66775750.003335769526411170.00729000000000002
180.691590.007460017873079560.01732
190.69090250.00651733777448020.0157400000000000
200.68144250.008458247947023830.0186099999999999
210.679380.001544517184538070.00377000000000005
220.68823250.00499814882398140.01166
230.68361750.005000295824582110.0111300000000000
240.673620.001167133240037290.00256999999999996
250.672740.008344207571723020.0167999999999999
260.677260.003046265473220160.00695999999999997
270.70365250.01404403402397850.0317700000000000

\begin{tabular}{lllllllll}
\hline
Standard Deviation-Mean Plot \tabularnewline
Section & Mean & Standard Deviation & Range \tabularnewline
1 & 0.681925 & 0.01715526061203 & 0.0378900000000001 \tabularnewline
2 & 0.6566075 & 0.0043586112084776 & 0.00988999999999995 \tabularnewline
3 & 0.6390575 & 0.00945891246391467 & 0.02032 \tabularnewline
4 & 0.6104125 & 0.00884133992484548 & 0.02032 \tabularnewline
5 & 0.61523 & 0.0130697232819470 & 0.02776 \tabularnewline
6 & 0.6027175 & 0.0103972925161633 & 0.0240899999999999 \tabularnewline
7 & 0.6299075 & 0.00602634977964827 & 0.0131200000000000 \tabularnewline
8 & 0.6143675 & 0.00851021885735028 & 0.01815 \tabularnewline
9 & 0.621335 & 0.00254446458022112 & 0.00554999999999994 \tabularnewline
10 & 0.6144975 & 0.00219665465348255 & 0.00498999999999994 \tabularnewline
11 & 0.6368275 & 0.00657863397674627 & 0.0158200000000001 \tabularnewline
12 & 0.6349475 & 0.00579705888073139 & 0.0122300000000000 \tabularnewline
13 & 0.6746125 & 0.0141464633389409 & 0.03191 \tabularnewline
14 & 0.703775 & 0.00641981567752012 & 0.01403 \tabularnewline
15 & 0.697325 & 0.00375895818900222 & 0.00918000000000008 \tabularnewline
16 & 0.6764025 & 0.0115138246613944 & 0.02683 \tabularnewline
17 & 0.6677575 & 0.00333576952641117 & 0.00729000000000002 \tabularnewline
18 & 0.69159 & 0.00746001787307956 & 0.01732 \tabularnewline
19 & 0.6909025 & 0.0065173377744802 & 0.0157400000000000 \tabularnewline
20 & 0.6814425 & 0.00845824794702383 & 0.0186099999999999 \tabularnewline
21 & 0.67938 & 0.00154451718453807 & 0.00377000000000005 \tabularnewline
22 & 0.6882325 & 0.0049981488239814 & 0.01166 \tabularnewline
23 & 0.6836175 & 0.00500029582458211 & 0.0111300000000000 \tabularnewline
24 & 0.67362 & 0.00116713324003729 & 0.00256999999999996 \tabularnewline
25 & 0.67274 & 0.00834420757172302 & 0.0167999999999999 \tabularnewline
26 & 0.67726 & 0.00304626547322016 & 0.00695999999999997 \tabularnewline
27 & 0.7036525 & 0.0140440340239785 & 0.0317700000000000 \tabularnewline
\hline
\end{tabular}
%Source: https://freestatistics.org/blog/index.php?pk=12910&T=1

[TABLE]
[ROW][C]Standard Deviation-Mean Plot[/C][/ROW]
[ROW][C]Section[/C][C]Mean[/C][C]Standard Deviation[/C][C]Range[/C][/ROW]
[ROW][C]1[/C][C]0.681925[/C][C]0.01715526061203[/C][C]0.0378900000000001[/C][/ROW]
[ROW][C]2[/C][C]0.6566075[/C][C]0.0043586112084776[/C][C]0.00988999999999995[/C][/ROW]
[ROW][C]3[/C][C]0.6390575[/C][C]0.00945891246391467[/C][C]0.02032[/C][/ROW]
[ROW][C]4[/C][C]0.6104125[/C][C]0.00884133992484548[/C][C]0.02032[/C][/ROW]
[ROW][C]5[/C][C]0.61523[/C][C]0.0130697232819470[/C][C]0.02776[/C][/ROW]
[ROW][C]6[/C][C]0.6027175[/C][C]0.0103972925161633[/C][C]0.0240899999999999[/C][/ROW]
[ROW][C]7[/C][C]0.6299075[/C][C]0.00602634977964827[/C][C]0.0131200000000000[/C][/ROW]
[ROW][C]8[/C][C]0.6143675[/C][C]0.00851021885735028[/C][C]0.01815[/C][/ROW]
[ROW][C]9[/C][C]0.621335[/C][C]0.00254446458022112[/C][C]0.00554999999999994[/C][/ROW]
[ROW][C]10[/C][C]0.6144975[/C][C]0.00219665465348255[/C][C]0.00498999999999994[/C][/ROW]
[ROW][C]11[/C][C]0.6368275[/C][C]0.00657863397674627[/C][C]0.0158200000000001[/C][/ROW]
[ROW][C]12[/C][C]0.6349475[/C][C]0.00579705888073139[/C][C]0.0122300000000000[/C][/ROW]
[ROW][C]13[/C][C]0.6746125[/C][C]0.0141464633389409[/C][C]0.03191[/C][/ROW]
[ROW][C]14[/C][C]0.703775[/C][C]0.00641981567752012[/C][C]0.01403[/C][/ROW]
[ROW][C]15[/C][C]0.697325[/C][C]0.00375895818900222[/C][C]0.00918000000000008[/C][/ROW]
[ROW][C]16[/C][C]0.6764025[/C][C]0.0115138246613944[/C][C]0.02683[/C][/ROW]
[ROW][C]17[/C][C]0.6677575[/C][C]0.00333576952641117[/C][C]0.00729000000000002[/C][/ROW]
[ROW][C]18[/C][C]0.69159[/C][C]0.00746001787307956[/C][C]0.01732[/C][/ROW]
[ROW][C]19[/C][C]0.6909025[/C][C]0.0065173377744802[/C][C]0.0157400000000000[/C][/ROW]
[ROW][C]20[/C][C]0.6814425[/C][C]0.00845824794702383[/C][C]0.0186099999999999[/C][/ROW]
[ROW][C]21[/C][C]0.67938[/C][C]0.00154451718453807[/C][C]0.00377000000000005[/C][/ROW]
[ROW][C]22[/C][C]0.6882325[/C][C]0.0049981488239814[/C][C]0.01166[/C][/ROW]
[ROW][C]23[/C][C]0.6836175[/C][C]0.00500029582458211[/C][C]0.0111300000000000[/C][/ROW]
[ROW][C]24[/C][C]0.67362[/C][C]0.00116713324003729[/C][C]0.00256999999999996[/C][/ROW]
[ROW][C]25[/C][C]0.67274[/C][C]0.00834420757172302[/C][C]0.0167999999999999[/C][/ROW]
[ROW][C]26[/C][C]0.67726[/C][C]0.00304626547322016[/C][C]0.00695999999999997[/C][/ROW]
[ROW][C]27[/C][C]0.7036525[/C][C]0.0140440340239785[/C][C]0.0317700000000000[/C][/ROW]
[/TABLE]
Source: https://freestatistics.org/blog/index.php?pk=12910&T=1

Globally Unique Identifier (entire table): ba.freestatistics.org/blog/index.php?pk=12910&T=1

As an alternative you can also use a QR Code:  

The GUIDs for individual cells are displayed in the table below:

Standard Deviation-Mean Plot
SectionMeanStandard DeviationRange
10.6819250.017155260612030.0378900000000001
20.65660750.00435861120847760.00988999999999995
30.63905750.009458912463914670.02032
40.61041250.008841339924845480.02032
50.615230.01306972328194700.02776
60.60271750.01039729251616330.0240899999999999
70.62990750.006026349779648270.0131200000000000
80.61436750.008510218857350280.01815
90.6213350.002544464580221120.00554999999999994
100.61449750.002196654653482550.00498999999999994
110.63682750.006578633976746270.0158200000000001
120.63494750.005797058880731390.0122300000000000
130.67461250.01414646333894090.03191
140.7037750.006419815677520120.01403
150.6973250.003758958189002220.00918000000000008
160.67640250.01151382466139440.02683
170.66775750.003335769526411170.00729000000000002
180.691590.007460017873079560.01732
190.69090250.00651733777448020.0157400000000000
200.68144250.008458247947023830.0186099999999999
210.679380.001544517184538070.00377000000000005
220.68823250.00499814882398140.01166
230.68361750.005000295824582110.0111300000000000
240.673620.001167133240037290.00256999999999996
250.672740.008344207571723020.0167999999999999
260.677260.003046265473220160.00695999999999997
270.70365250.01404403402397850.0317700000000000


Regression: S.E.(k) = alpha + beta * Mean(k)
alpha0.00682925040249366
beta0.000577986230926155
S.D.0.0258954494306893
T-STAT0.0223199922624695
p-value0.982369898533604

\begin{tabular}{lllllllll}
\hline
Regression: S.E.(k) = alpha + beta * Mean(k) \tabularnewline
alpha & 0.00682925040249366 \tabularnewline
beta & 0.000577986230926155 \tabularnewline
S.D. & 0.0258954494306893 \tabularnewline
T-STAT & 0.0223199922624695 \tabularnewline
p-value & 0.982369898533604 \tabularnewline
\hline
\end{tabular}
%Source: https://freestatistics.org/blog/index.php?pk=12910&T=2

[TABLE]
[ROW][C]Regression: S.E.(k) = alpha + beta * Mean(k)[/C][/ROW]
[ROW][C]alpha[/C][C]0.00682925040249366[/C][/ROW]
[ROW][C]beta[/C][C]0.000577986230926155[/C][/ROW]
[ROW][C]S.D.[/C][C]0.0258954494306893[/C][/ROW]
[ROW][C]T-STAT[/C][C]0.0223199922624695[/C][/ROW]
[ROW][C]p-value[/C][C]0.982369898533604[/C][/ROW]
[/TABLE]
Source: https://freestatistics.org/blog/index.php?pk=12910&T=2

Globally Unique Identifier (entire table): ba.freestatistics.org/blog/index.php?pk=12910&T=2

As an alternative you can also use a QR Code:  

The GUIDs for individual cells are displayed in the table below:

Regression: S.E.(k) = alpha + beta * Mean(k)
alpha0.00682925040249366
beta0.000577986230926155
S.D.0.0258954494306893
T-STAT0.0223199922624695
p-value0.982369898533604


Regression: ln S.E.(k) = alpha + beta * ln Mean(k)
alpha-5.31925219059089
beta-0.466527642539913
S.D.2.76763218639692
T-STAT-0.168565622568246
p-value0.867494700640008
Lambda1.46652764253991

\begin{tabular}{lllllllll}
\hline
Regression: ln S.E.(k) = alpha + beta * ln Mean(k) \tabularnewline
alpha & -5.31925219059089 \tabularnewline
beta & -0.466527642539913 \tabularnewline
S.D. & 2.76763218639692 \tabularnewline
T-STAT & -0.168565622568246 \tabularnewline
p-value & 0.867494700640008 \tabularnewline
Lambda & 1.46652764253991 \tabularnewline
\hline
\end{tabular}
%Source: https://freestatistics.org/blog/index.php?pk=12910&T=3

[TABLE]
[ROW][C]Regression: ln S.E.(k) = alpha + beta * ln Mean(k)[/C][/ROW]
[ROW][C]alpha[/C][C]-5.31925219059089[/C][/ROW]
[ROW][C]beta[/C][C]-0.466527642539913[/C][/ROW]
[ROW][C]S.D.[/C][C]2.76763218639692[/C][/ROW]
[ROW][C]T-STAT[/C][C]-0.168565622568246[/C][/ROW]
[ROW][C]p-value[/C][C]0.867494700640008[/C][/ROW]
[ROW][C]Lambda[/C][C]1.46652764253991[/C][/ROW]
[/TABLE]
Source: https://freestatistics.org/blog/index.php?pk=12910&T=3

Globally Unique Identifier (entire table): ba.freestatistics.org/blog/index.php?pk=12910&T=3

As an alternative you can also use a QR Code:  

The GUIDs for individual cells are displayed in the table below:

Regression: ln S.E.(k) = alpha + beta * ln Mean(k)
alpha-5.31925219059089
beta-0.466527642539913
S.D.2.76763218639692
T-STAT-0.168565622568246
p-value0.867494700640008
Lambda1.46652764253991


Parameters (Session):
par1 = 4 ;
Parameters (R input):
par1 = 4 ;
R code (references can be found in the software module):
par1 <- as.numeric(par1)
(n <- length(x))
(np <- floor(n / par1))
arr <- array(NA,dim=c(par1,np))
j <- 0
k <- 1
for (i in 1:(np*par1))
{
j = j + 1
arr[j,k] <- x[i]
if (j == par1) {
j = 0
k=k+1
}
}
arr
arr.mean <- array(NA,dim=np)
arr.sd <- array(NA,dim=np)
arr.range <- array(NA,dim=np)
for (j in 1:np)
{
arr.mean[j] <- mean(arr[,j],na.rm=TRUE)
arr.sd[j] <- sd(arr[,j],na.rm=TRUE)
arr.range[j] <- max(arr[,j],na.rm=TRUE) - min(arr[,j],na.rm=TRUE)
}
arr.mean
arr.sd
arr.range
(lm1 <- lm(arr.sd~arr.mean))
(lnlm1 <- lm(log(arr.sd)~log(arr.mean)))
(lm2 <- lm(arr.range~arr.mean))
bitmap(file='test1.png')
plot(arr.mean,arr.sd,main='Standard Deviation-Mean Plot',xlab='mean',ylab='standard deviation')
dev.off()
bitmap(file='test2.png')
plot(arr.mean,arr.range,main='Range-Mean Plot',xlab='mean',ylab='range')
dev.off()
load(file='createtable')
a<-table.start()
a<-table.row.start(a)
a<-table.element(a,'Standard Deviation-Mean Plot',4,TRUE)
a<-table.row.end(a)
a<-table.row.start(a)
a<-table.element(a,'Section',header=TRUE)
a<-table.element(a,'Mean',header=TRUE)
a<-table.element(a,'Standard Deviation',header=TRUE)
a<-table.element(a,'Range',header=TRUE)
a<-table.row.end(a)
for (j in 1:np) {
a<-table.row.start(a)
a<-table.element(a,j,header=TRUE)
a<-table.element(a,arr.mean[j])
a<-table.element(a,arr.sd[j] )
a<-table.element(a,arr.range[j] )
a<-table.row.end(a)
}
a<-table.end(a)
table.save(a,file='mytable.tab')
a<-table.start()
a<-table.row.start(a)
a<-table.element(a,'Regression: S.E.(k) = alpha + beta * Mean(k)',2,TRUE)
a<-table.row.end(a)
a<-table.row.start(a)
a<-table.element(a,'alpha',header=TRUE)
a<-table.element(a,lm1$coefficients[[1]])
a<-table.row.end(a)
a<-table.row.start(a)
a<-table.element(a,'beta',header=TRUE)
a<-table.element(a,lm1$coefficients[[2]])
a<-table.row.end(a)
a<-table.row.start(a)
a<-table.element(a,'S.D.',header=TRUE)
a<-table.element(a,summary(lm1)$coefficients[2,2])
a<-table.row.end(a)
a<-table.row.start(a)
a<-table.element(a,'T-STAT',header=TRUE)
a<-table.element(a,summary(lm1)$coefficients[2,3])
a<-table.row.end(a)
a<-table.row.start(a)
a<-table.element(a,'p-value',header=TRUE)
a<-table.element(a,summary(lm1)$coefficients[2,4])
a<-table.row.end(a)
a<-table.end(a)
table.save(a,file='mytable1.tab')
a<-table.start()
a<-table.row.start(a)
a<-table.element(a,'Regression: ln S.E.(k) = alpha + beta * ln Mean(k)',2,TRUE)
a<-table.row.end(a)
a<-table.row.start(a)
a<-table.element(a,'alpha',header=TRUE)
a<-table.element(a,lnlm1$coefficients[[1]])
a<-table.row.end(a)
a<-table.row.start(a)
a<-table.element(a,'beta',header=TRUE)
a<-table.element(a,lnlm1$coefficients[[2]])
a<-table.row.end(a)
a<-table.row.start(a)
a<-table.element(a,'S.D.',header=TRUE)
a<-table.element(a,summary(lnlm1)$coefficients[2,2])
a<-table.row.end(a)
a<-table.row.start(a)
a<-table.element(a,'T-STAT',header=TRUE)
a<-table.element(a,summary(lnlm1)$coefficients[2,3])
a<-table.row.end(a)
a<-table.row.start(a)
a<-table.element(a,'p-value',header=TRUE)
a<-table.element(a,summary(lnlm1)$coefficients[2,4])
a<-table.row.end(a)
a<-table.row.start(a)
a<-table.element(a,'Lambda',header=TRUE)
a<-table.element(a,1-lnlm1$coefficients[[2]])
a<-table.row.end(a)
a<-table.end(a)
table.save(a,file='mytable2.tab')