Free Statistics

of Irreproducible Research!

Author's title

Author*Unverified author*
R Software Modulerwasp_exponentialsmoothing.wasp
Title produced by softwareExponential Smoothing
Date of computationSat, 24 May 2008 04:52:40 -0600
Cite this page as followsStatistical Computations at FreeStatistics.org, Office for Research Development and Education, URL https://freestatistics.org/blog/index.php?v=date/2008/May/24/t121162640571mapbfh0raoqi6.htm/, Retrieved Tue, 14 May 2024 12:20:25 +0000
Statistical Computations at FreeStatistics.org, Office for Research Development and Education, URL https://freestatistics.org/blog/index.php?pk=13059, Retrieved Tue, 14 May 2024 12:20:25 +0000
QR Codes:

Original text written by user:
IsPrivate?No (this computation is public)
User-defined keywords
Estimated Impact203
Family? (F = Feedback message, R = changed R code, M = changed R Module, P = changed Parameters, D = changed Data)
-       [Exponential Smoothing] [Jan-Pieter Onzea-...] [2008-05-24 10:52:40] [1140c1f194cb83f4b6ccae47f83794fa] [Current]
Feedback Forum

Post a new message
Dataseries X:
476
475
470
461
455
456
517
525
523
519
509
512
519
517
510
509
501
507
569
580
578
565
547
555
562
561
555
544
537
543
594
611
613
611
594
595
591
589
584
573
567
569
621
629
628
612
595
597
593
590
580
574
573
573
620
626
620
588
566
557
561
549
532
526
511
499
555
565
542
527
510
514


Summary of computational transaction
Raw Inputview raw input (R code)
Raw Outputview raw output of R engine
Computing time4 seconds
R Server'Gwilym Jenkins' @ 72.249.127.135

\begin{tabular}{lllllllll}
\hline
Summary of computational transaction \tabularnewline
Raw Input & view raw input (R code)  \tabularnewline
Raw Output & view raw output of R engine  \tabularnewline
Computing time & 4 seconds \tabularnewline
R Server & 'Gwilym Jenkins' @ 72.249.127.135 \tabularnewline
\hline
\end{tabular}
%Source: https://freestatistics.org/blog/index.php?pk=13059&T=0

[TABLE]
[ROW][C]Summary of computational transaction[/C][/ROW]
[ROW][C]Raw Input[/C][C]view raw input (R code) [/C][/ROW]
[ROW][C]Raw Output[/C][C]view raw output of R engine [/C][/ROW]
[ROW][C]Computing time[/C][C]4 seconds[/C][/ROW]
[ROW][C]R Server[/C][C]'Gwilym Jenkins' @ 72.249.127.135[/C][/ROW]
[/TABLE]
Source: https://freestatistics.org/blog/index.php?pk=13059&T=0

Globally Unique Identifier (entire table): ba.freestatistics.org/blog/index.php?pk=13059&T=0

As an alternative you can also use a QR Code:  

The GUIDs for individual cells are displayed in the table below:

Summary of computational transaction
Raw Inputview raw input (R code)
Raw Outputview raw output of R engine
Computing time4 seconds
R Server'Gwilym Jenkins' @ 72.249.127.135


Estimated Parameters of Exponential Smoothing
ParameterValue
alpha1
beta0
gamma0

\begin{tabular}{lllllllll}
\hline
Estimated Parameters of Exponential Smoothing \tabularnewline
Parameter & Value \tabularnewline
alpha & 1 \tabularnewline
beta & 0 \tabularnewline
gamma & 0 \tabularnewline
\hline
\end{tabular}
%Source: https://freestatistics.org/blog/index.php?pk=13059&T=1

[TABLE]
[ROW][C]Estimated Parameters of Exponential Smoothing[/C][/ROW]
[ROW][C]Parameter[/C][C]Value[/C][/ROW]
[ROW][C]alpha[/C][C]1[/C][/ROW]
[ROW][C]beta[/C][C]0[/C][/ROW]
[ROW][C]gamma[/C][C]0[/C][/ROW]
[/TABLE]
Source: https://freestatistics.org/blog/index.php?pk=13059&T=1

Globally Unique Identifier (entire table): ba.freestatistics.org/blog/index.php?pk=13059&T=1

As an alternative you can also use a QR Code:  

The GUIDs for individual cells are displayed in the table below:

Estimated Parameters of Exponential Smoothing
ParameterValue
alpha1
beta0
gamma0


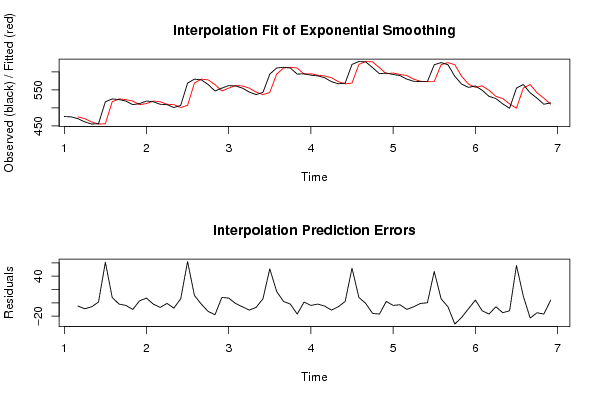
Interpolation Forecasts of Exponential Smoothing
tObservedFittedResiduals
3470475-5
4461470-9
5455461-6
64564551
751745661
85255178
9523525-2
10519523-4
11509519-10
125125093
135195127
14517519-2
15510517-7
16509510-1
17501509-8
185075016
1956950762
2058056911
21578580-2
22565578-13
23547565-18
245555478
255625557
26561562-1
27555561-6
28544555-11
29537544-7
305435376
3159454351
3261159417
336136112
34611613-2
35594611-17
365955941
37591595-4
38589591-2
39584589-5
40573584-11
41567573-6
425695672
4362156952
446296218
45628629-1
46612628-16
47595612-17
485975952
49593597-4
50590593-3
51580590-10
52574580-6
53573574-1
545735730
5562057347
566266206
57620626-6
58588620-32
59566588-22
60557566-9
615615574
62549561-12
63532549-17
64526532-6
65511526-15
66499511-12
6755549956
6856555510
69542565-23
70527542-15
71510527-17
725145104

\begin{tabular}{lllllllll}
\hline
Interpolation Forecasts of Exponential Smoothing \tabularnewline
t & Observed & Fitted & Residuals \tabularnewline
3 & 470 & 475 & -5 \tabularnewline
4 & 461 & 470 & -9 \tabularnewline
5 & 455 & 461 & -6 \tabularnewline
6 & 456 & 455 & 1 \tabularnewline
7 & 517 & 456 & 61 \tabularnewline
8 & 525 & 517 & 8 \tabularnewline
9 & 523 & 525 & -2 \tabularnewline
10 & 519 & 523 & -4 \tabularnewline
11 & 509 & 519 & -10 \tabularnewline
12 & 512 & 509 & 3 \tabularnewline
13 & 519 & 512 & 7 \tabularnewline
14 & 517 & 519 & -2 \tabularnewline
15 & 510 & 517 & -7 \tabularnewline
16 & 509 & 510 & -1 \tabularnewline
17 & 501 & 509 & -8 \tabularnewline
18 & 507 & 501 & 6 \tabularnewline
19 & 569 & 507 & 62 \tabularnewline
20 & 580 & 569 & 11 \tabularnewline
21 & 578 & 580 & -2 \tabularnewline
22 & 565 & 578 & -13 \tabularnewline
23 & 547 & 565 & -18 \tabularnewline
24 & 555 & 547 & 8 \tabularnewline
25 & 562 & 555 & 7 \tabularnewline
26 & 561 & 562 & -1 \tabularnewline
27 & 555 & 561 & -6 \tabularnewline
28 & 544 & 555 & -11 \tabularnewline
29 & 537 & 544 & -7 \tabularnewline
30 & 543 & 537 & 6 \tabularnewline
31 & 594 & 543 & 51 \tabularnewline
32 & 611 & 594 & 17 \tabularnewline
33 & 613 & 611 & 2 \tabularnewline
34 & 611 & 613 & -2 \tabularnewline
35 & 594 & 611 & -17 \tabularnewline
36 & 595 & 594 & 1 \tabularnewline
37 & 591 & 595 & -4 \tabularnewline
38 & 589 & 591 & -2 \tabularnewline
39 & 584 & 589 & -5 \tabularnewline
40 & 573 & 584 & -11 \tabularnewline
41 & 567 & 573 & -6 \tabularnewline
42 & 569 & 567 & 2 \tabularnewline
43 & 621 & 569 & 52 \tabularnewline
44 & 629 & 621 & 8 \tabularnewline
45 & 628 & 629 & -1 \tabularnewline
46 & 612 & 628 & -16 \tabularnewline
47 & 595 & 612 & -17 \tabularnewline
48 & 597 & 595 & 2 \tabularnewline
49 & 593 & 597 & -4 \tabularnewline
50 & 590 & 593 & -3 \tabularnewline
51 & 580 & 590 & -10 \tabularnewline
52 & 574 & 580 & -6 \tabularnewline
53 & 573 & 574 & -1 \tabularnewline
54 & 573 & 573 & 0 \tabularnewline
55 & 620 & 573 & 47 \tabularnewline
56 & 626 & 620 & 6 \tabularnewline
57 & 620 & 626 & -6 \tabularnewline
58 & 588 & 620 & -32 \tabularnewline
59 & 566 & 588 & -22 \tabularnewline
60 & 557 & 566 & -9 \tabularnewline
61 & 561 & 557 & 4 \tabularnewline
62 & 549 & 561 & -12 \tabularnewline
63 & 532 & 549 & -17 \tabularnewline
64 & 526 & 532 & -6 \tabularnewline
65 & 511 & 526 & -15 \tabularnewline
66 & 499 & 511 & -12 \tabularnewline
67 & 555 & 499 & 56 \tabularnewline
68 & 565 & 555 & 10 \tabularnewline
69 & 542 & 565 & -23 \tabularnewline
70 & 527 & 542 & -15 \tabularnewline
71 & 510 & 527 & -17 \tabularnewline
72 & 514 & 510 & 4 \tabularnewline
\hline
\end{tabular}
%Source: https://freestatistics.org/blog/index.php?pk=13059&T=2

[TABLE]
[ROW][C]Interpolation Forecasts of Exponential Smoothing[/C][/ROW]
[ROW][C]t[/C][C]Observed[/C][C]Fitted[/C][C]Residuals[/C][/ROW]
[ROW][C]3[/C][C]470[/C][C]475[/C][C]-5[/C][/ROW]
[ROW][C]4[/C][C]461[/C][C]470[/C][C]-9[/C][/ROW]
[ROW][C]5[/C][C]455[/C][C]461[/C][C]-6[/C][/ROW]
[ROW][C]6[/C][C]456[/C][C]455[/C][C]1[/C][/ROW]
[ROW][C]7[/C][C]517[/C][C]456[/C][C]61[/C][/ROW]
[ROW][C]8[/C][C]525[/C][C]517[/C][C]8[/C][/ROW]
[ROW][C]9[/C][C]523[/C][C]525[/C][C]-2[/C][/ROW]
[ROW][C]10[/C][C]519[/C][C]523[/C][C]-4[/C][/ROW]
[ROW][C]11[/C][C]509[/C][C]519[/C][C]-10[/C][/ROW]
[ROW][C]12[/C][C]512[/C][C]509[/C][C]3[/C][/ROW]
[ROW][C]13[/C][C]519[/C][C]512[/C][C]7[/C][/ROW]
[ROW][C]14[/C][C]517[/C][C]519[/C][C]-2[/C][/ROW]
[ROW][C]15[/C][C]510[/C][C]517[/C][C]-7[/C][/ROW]
[ROW][C]16[/C][C]509[/C][C]510[/C][C]-1[/C][/ROW]
[ROW][C]17[/C][C]501[/C][C]509[/C][C]-8[/C][/ROW]
[ROW][C]18[/C][C]507[/C][C]501[/C][C]6[/C][/ROW]
[ROW][C]19[/C][C]569[/C][C]507[/C][C]62[/C][/ROW]
[ROW][C]20[/C][C]580[/C][C]569[/C][C]11[/C][/ROW]
[ROW][C]21[/C][C]578[/C][C]580[/C][C]-2[/C][/ROW]
[ROW][C]22[/C][C]565[/C][C]578[/C][C]-13[/C][/ROW]
[ROW][C]23[/C][C]547[/C][C]565[/C][C]-18[/C][/ROW]
[ROW][C]24[/C][C]555[/C][C]547[/C][C]8[/C][/ROW]
[ROW][C]25[/C][C]562[/C][C]555[/C][C]7[/C][/ROW]
[ROW][C]26[/C][C]561[/C][C]562[/C][C]-1[/C][/ROW]
[ROW][C]27[/C][C]555[/C][C]561[/C][C]-6[/C][/ROW]
[ROW][C]28[/C][C]544[/C][C]555[/C][C]-11[/C][/ROW]
[ROW][C]29[/C][C]537[/C][C]544[/C][C]-7[/C][/ROW]
[ROW][C]30[/C][C]543[/C][C]537[/C][C]6[/C][/ROW]
[ROW][C]31[/C][C]594[/C][C]543[/C][C]51[/C][/ROW]
[ROW][C]32[/C][C]611[/C][C]594[/C][C]17[/C][/ROW]
[ROW][C]33[/C][C]613[/C][C]611[/C][C]2[/C][/ROW]
[ROW][C]34[/C][C]611[/C][C]613[/C][C]-2[/C][/ROW]
[ROW][C]35[/C][C]594[/C][C]611[/C][C]-17[/C][/ROW]
[ROW][C]36[/C][C]595[/C][C]594[/C][C]1[/C][/ROW]
[ROW][C]37[/C][C]591[/C][C]595[/C][C]-4[/C][/ROW]
[ROW][C]38[/C][C]589[/C][C]591[/C][C]-2[/C][/ROW]
[ROW][C]39[/C][C]584[/C][C]589[/C][C]-5[/C][/ROW]
[ROW][C]40[/C][C]573[/C][C]584[/C][C]-11[/C][/ROW]
[ROW][C]41[/C][C]567[/C][C]573[/C][C]-6[/C][/ROW]
[ROW][C]42[/C][C]569[/C][C]567[/C][C]2[/C][/ROW]
[ROW][C]43[/C][C]621[/C][C]569[/C][C]52[/C][/ROW]
[ROW][C]44[/C][C]629[/C][C]621[/C][C]8[/C][/ROW]
[ROW][C]45[/C][C]628[/C][C]629[/C][C]-1[/C][/ROW]
[ROW][C]46[/C][C]612[/C][C]628[/C][C]-16[/C][/ROW]
[ROW][C]47[/C][C]595[/C][C]612[/C][C]-17[/C][/ROW]
[ROW][C]48[/C][C]597[/C][C]595[/C][C]2[/C][/ROW]
[ROW][C]49[/C][C]593[/C][C]597[/C][C]-4[/C][/ROW]
[ROW][C]50[/C][C]590[/C][C]593[/C][C]-3[/C][/ROW]
[ROW][C]51[/C][C]580[/C][C]590[/C][C]-10[/C][/ROW]
[ROW][C]52[/C][C]574[/C][C]580[/C][C]-6[/C][/ROW]
[ROW][C]53[/C][C]573[/C][C]574[/C][C]-1[/C][/ROW]
[ROW][C]54[/C][C]573[/C][C]573[/C][C]0[/C][/ROW]
[ROW][C]55[/C][C]620[/C][C]573[/C][C]47[/C][/ROW]
[ROW][C]56[/C][C]626[/C][C]620[/C][C]6[/C][/ROW]
[ROW][C]57[/C][C]620[/C][C]626[/C][C]-6[/C][/ROW]
[ROW][C]58[/C][C]588[/C][C]620[/C][C]-32[/C][/ROW]
[ROW][C]59[/C][C]566[/C][C]588[/C][C]-22[/C][/ROW]
[ROW][C]60[/C][C]557[/C][C]566[/C][C]-9[/C][/ROW]
[ROW][C]61[/C][C]561[/C][C]557[/C][C]4[/C][/ROW]
[ROW][C]62[/C][C]549[/C][C]561[/C][C]-12[/C][/ROW]
[ROW][C]63[/C][C]532[/C][C]549[/C][C]-17[/C][/ROW]
[ROW][C]64[/C][C]526[/C][C]532[/C][C]-6[/C][/ROW]
[ROW][C]65[/C][C]511[/C][C]526[/C][C]-15[/C][/ROW]
[ROW][C]66[/C][C]499[/C][C]511[/C][C]-12[/C][/ROW]
[ROW][C]67[/C][C]555[/C][C]499[/C][C]56[/C][/ROW]
[ROW][C]68[/C][C]565[/C][C]555[/C][C]10[/C][/ROW]
[ROW][C]69[/C][C]542[/C][C]565[/C][C]-23[/C][/ROW]
[ROW][C]70[/C][C]527[/C][C]542[/C][C]-15[/C][/ROW]
[ROW][C]71[/C][C]510[/C][C]527[/C][C]-17[/C][/ROW]
[ROW][C]72[/C][C]514[/C][C]510[/C][C]4[/C][/ROW]
[/TABLE]
Source: https://freestatistics.org/blog/index.php?pk=13059&T=2

Globally Unique Identifier (entire table): ba.freestatistics.org/blog/index.php?pk=13059&T=2

As an alternative you can also use a QR Code:  

The GUIDs for individual cells are displayed in the table below:

Interpolation Forecasts of Exponential Smoothing
tObservedFittedResiduals
3470475-5
4461470-9
5455461-6
64564551
751745661
85255178
9523525-2
10519523-4
11509519-10
125125093
135195127
14517519-2
15510517-7
16509510-1
17501509-8
185075016
1956950762
2058056911
21578580-2
22565578-13
23547565-18
245555478
255625557
26561562-1
27555561-6
28544555-11
29537544-7
305435376
3159454351
3261159417
336136112
34611613-2
35594611-17
365955941
37591595-4
38589591-2
39584589-5
40573584-11
41567573-6
425695672
4362156952
446296218
45628629-1
46612628-16
47595612-17
485975952
49593597-4
50590593-3
51580590-10
52574580-6
53573574-1
545735730
5562057347
566266206
57620626-6
58588620-32
59566588-22
60557566-9
615615574
62549561-12
63532549-17
64526532-6
65511526-15
66499511-12
6755549956
6856555510
69542565-23
70527542-15
71510527-17
725145104


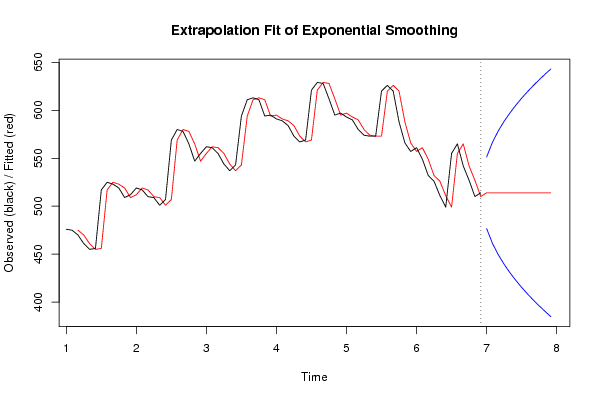
Extrapolation Forecasts of Exponential Smoothing
tForecast95% Lower Bound95% Upper Bound
73514476.730593266743551.269406733257
74514461.293099536229566.706900463771
75514449.447493970049578.552506029951
76514439.461186533486588.538813466514
77514430.663073063349597.336926936651
78514422.708970487272605.291029512728
79514415.394418272886612.605581727114
80514408.586199072457619.413800927543
81514402.191779800229625.808220199771
82514396.143787679692631.856212320308
83514390.391361706641637.608638293359
84514384.894987940098643.105012059902

\begin{tabular}{lllllllll}
\hline
Extrapolation Forecasts of Exponential Smoothing \tabularnewline
t & Forecast & 95% Lower Bound & 95% Upper Bound \tabularnewline
73 & 514 & 476.730593266743 & 551.269406733257 \tabularnewline
74 & 514 & 461.293099536229 & 566.706900463771 \tabularnewline
75 & 514 & 449.447493970049 & 578.552506029951 \tabularnewline
76 & 514 & 439.461186533486 & 588.538813466514 \tabularnewline
77 & 514 & 430.663073063349 & 597.336926936651 \tabularnewline
78 & 514 & 422.708970487272 & 605.291029512728 \tabularnewline
79 & 514 & 415.394418272886 & 612.605581727114 \tabularnewline
80 & 514 & 408.586199072457 & 619.413800927543 \tabularnewline
81 & 514 & 402.191779800229 & 625.808220199771 \tabularnewline
82 & 514 & 396.143787679692 & 631.856212320308 \tabularnewline
83 & 514 & 390.391361706641 & 637.608638293359 \tabularnewline
84 & 514 & 384.894987940098 & 643.105012059902 \tabularnewline
\hline
\end{tabular}
%Source: https://freestatistics.org/blog/index.php?pk=13059&T=3

[TABLE]
[ROW][C]Extrapolation Forecasts of Exponential Smoothing[/C][/ROW]
[ROW][C]t[/C][C]Forecast[/C][C]95% Lower Bound[/C][C]95% Upper Bound[/C][/ROW]
[ROW][C]73[/C][C]514[/C][C]476.730593266743[/C][C]551.269406733257[/C][/ROW]
[ROW][C]74[/C][C]514[/C][C]461.293099536229[/C][C]566.706900463771[/C][/ROW]
[ROW][C]75[/C][C]514[/C][C]449.447493970049[/C][C]578.552506029951[/C][/ROW]
[ROW][C]76[/C][C]514[/C][C]439.461186533486[/C][C]588.538813466514[/C][/ROW]
[ROW][C]77[/C][C]514[/C][C]430.663073063349[/C][C]597.336926936651[/C][/ROW]
[ROW][C]78[/C][C]514[/C][C]422.708970487272[/C][C]605.291029512728[/C][/ROW]
[ROW][C]79[/C][C]514[/C][C]415.394418272886[/C][C]612.605581727114[/C][/ROW]
[ROW][C]80[/C][C]514[/C][C]408.586199072457[/C][C]619.413800927543[/C][/ROW]
[ROW][C]81[/C][C]514[/C][C]402.191779800229[/C][C]625.808220199771[/C][/ROW]
[ROW][C]82[/C][C]514[/C][C]396.143787679692[/C][C]631.856212320308[/C][/ROW]
[ROW][C]83[/C][C]514[/C][C]390.391361706641[/C][C]637.608638293359[/C][/ROW]
[ROW][C]84[/C][C]514[/C][C]384.894987940098[/C][C]643.105012059902[/C][/ROW]
[/TABLE]
Source: https://freestatistics.org/blog/index.php?pk=13059&T=3

Globally Unique Identifier (entire table): ba.freestatistics.org/blog/index.php?pk=13059&T=3

As an alternative you can also use a QR Code:  

The GUIDs for individual cells are displayed in the table below:

Extrapolation Forecasts of Exponential Smoothing
tForecast95% Lower Bound95% Upper Bound
73514476.730593266743551.269406733257
74514461.293099536229566.706900463771
75514449.447493970049578.552506029951
76514439.461186533486588.538813466514
77514430.663073063349597.336926936651
78514422.708970487272605.291029512728
79514415.394418272886612.605581727114
80514408.586199072457619.413800927543
81514402.191779800229625.808220199771
82514396.143787679692631.856212320308
83514390.391361706641637.608638293359
84514384.894987940098643.105012059902


Parameters (Session):
par1 = 12 ; par2 = Double ; par3 = additive ;
Parameters (R input):
par1 = 12 ; par2 = Double ; par3 = additive ;
R code (references can be found in the software module):
par1 <- as.numeric(par1)
if (par2 == 'Single') K <- 1
if (par2 == 'Double') K <- 2
if (par2 == 'Triple') K <- par1
nx <- length(x)
nxmK <- nx - K
x <- ts(x, frequency = par1)
if (par2 == 'Single') fit <- HoltWinters(x, gamma=0, beta=0)
if (par2 == 'Double') fit <- HoltWinters(x, gamma=0)
if (par2 == 'Triple') fit <- HoltWinters(x, seasonal=par3)
fit
myresid <- x - fit$fitted[,'xhat']
bitmap(file='test1.png')
op <- par(mfrow=c(2,1))
plot(fit,ylab='Observed (black) / Fitted (red)',main='Interpolation Fit of Exponential Smoothing')
plot(myresid,ylab='Residuals',main='Interpolation Prediction Errors')
par(op)
dev.off()
bitmap(file='test2.png')
p <- predict(fit, par1, prediction.interval=TRUE)
np <- length(p[,1])
plot(fit,p,ylab='Observed (black) / Fitted (red)',main='Extrapolation Fit of Exponential Smoothing')
dev.off()
bitmap(file='test3.png')
op <- par(mfrow = c(2,2))
acf(as.numeric(myresid),lag.max = nx/2,main='Residual ACF')
spectrum(myresid,main='Residals Periodogram')
cpgram(myresid,main='Residal Cumulative Periodogram')
qqnorm(myresid,main='Residual Normal QQ Plot')
qqline(myresid)
par(op)
dev.off()
load(file='createtable')
a<-table.start()
a<-table.row.start(a)
a<-table.element(a,'Estimated Parameters of Exponential Smoothing',2,TRUE)
a<-table.row.end(a)
a<-table.row.start(a)
a<-table.element(a,'Parameter',header=TRUE)
a<-table.element(a,'Value',header=TRUE)
a<-table.row.end(a)
a<-table.row.start(a)
a<-table.element(a,'alpha',header=TRUE)
a<-table.element(a,fit$alpha)
a<-table.row.end(a)
a<-table.row.start(a)
a<-table.element(a,'beta',header=TRUE)
a<-table.element(a,fit$beta)
a<-table.row.end(a)
a<-table.row.start(a)
a<-table.element(a,'gamma',header=TRUE)
a<-table.element(a,fit$gamma)
a<-table.row.end(a)
a<-table.end(a)
table.save(a,file='mytable.tab')
a<-table.start()
a<-table.row.start(a)
a<-table.element(a,'Interpolation Forecasts of Exponential Smoothing',4,TRUE)
a<-table.row.end(a)
a<-table.row.start(a)
a<-table.element(a,'t',header=TRUE)
a<-table.element(a,'Observed',header=TRUE)
a<-table.element(a,'Fitted',header=TRUE)
a<-table.element(a,'Residuals',header=TRUE)
a<-table.row.end(a)
for (i in 1:nxmK) {
a<-table.row.start(a)
a<-table.element(a,i+K,header=TRUE)
a<-table.element(a,x[i+K])
a<-table.element(a,fit$fitted[i,'xhat'])
a<-table.element(a,myresid[i])
a<-table.row.end(a)
}
a<-table.end(a)
table.save(a,file='mytable1.tab')
a<-table.start()
a<-table.row.start(a)
a<-table.element(a,'Extrapolation Forecasts of Exponential Smoothing',4,TRUE)
a<-table.row.end(a)
a<-table.row.start(a)
a<-table.element(a,'t',header=TRUE)
a<-table.element(a,'Forecast',header=TRUE)
a<-table.element(a,'95% Lower Bound',header=TRUE)
a<-table.element(a,'95% Upper Bound',header=TRUE)
a<-table.row.end(a)
for (i in 1:np) {
a<-table.row.start(a)
a<-table.element(a,nx+i,header=TRUE)
a<-table.element(a,p[i,'fit'])
a<-table.element(a,p[i,'lwr'])
a<-table.element(a,p[i,'upr'])
a<-table.row.end(a)
}
a<-table.end(a)
table.save(a,file='mytable2.tab')