Free Statistics

of Irreproducible Research!

Author's title

Author*Unverified author*
R Software Modulerwasp_exponentialsmoothing.wasp
Title produced by softwareExponential Smoothing
Date of computationSat, 24 May 2008 09:01:48 -0600
Cite this page as followsStatistical Computations at FreeStatistics.org, Office for Research Development and Education, URL https://freestatistics.org/blog/index.php?v=date/2008/May/24/t121164134878qleado65ys5xx.htm/, Retrieved Tue, 14 May 2024 12:02:39 +0000
Statistical Computations at FreeStatistics.org, Office for Research Development and Education, URL https://freestatistics.org/blog/index.php?pk=13084, Retrieved Tue, 14 May 2024 12:02:39 +0000
QR Codes:

Original text written by user:
IsPrivate?No (this computation is public)
User-defined keywords
Estimated Impact211
Family? (F = Feedback message, R = changed R code, M = changed R Module, P = changed Parameters, D = changed Data)
-       [Exponential Smoothing] [Maandelijkse Aust...] [2008-05-24 15:01:48] [678dd736c2ca43f11132dfe6e57daf69] [Current]
Feedback Forum

Post a new message
Dataseries X:
164
148
152
144
155
125
153
146
138
190
192
192
147
133
163
150
129
131
145
137
138
168
176
188
139
143
150
154
137
129
128
140
143
151
177
184
151
134
164
126
131
125
127
143
143
160
190
182
138
136
152
127
151
130
119
153


Summary of computational transaction
Raw Inputview raw input (R code)
Raw Outputview raw output of R engine
Computing time5 seconds
R Server'Herman Ole Andreas Wold' @ 193.190.124.10:1001

\begin{tabular}{lllllllll}
\hline
Summary of computational transaction \tabularnewline
Raw Input & view raw input (R code)  \tabularnewline
Raw Output & view raw output of R engine  \tabularnewline
Computing time & 5 seconds \tabularnewline
R Server & 'Herman Ole Andreas Wold' @ 193.190.124.10:1001 \tabularnewline
\hline
\end{tabular}
%Source: https://freestatistics.org/blog/index.php?pk=13084&T=0

[TABLE]
[ROW][C]Summary of computational transaction[/C][/ROW]
[ROW][C]Raw Input[/C][C]view raw input (R code) [/C][/ROW]
[ROW][C]Raw Output[/C][C]view raw output of R engine [/C][/ROW]
[ROW][C]Computing time[/C][C]5 seconds[/C][/ROW]
[ROW][C]R Server[/C][C]'Herman Ole Andreas Wold' @ 193.190.124.10:1001[/C][/ROW]
[/TABLE]
Source: https://freestatistics.org/blog/index.php?pk=13084&T=0

Globally Unique Identifier (entire table): ba.freestatistics.org/blog/index.php?pk=13084&T=0

As an alternative you can also use a QR Code:  

The GUIDs for individual cells are displayed in the table below:

Summary of computational transaction
Raw Inputview raw input (R code)
Raw Outputview raw output of R engine
Computing time5 seconds
R Server'Herman Ole Andreas Wold' @ 193.190.124.10:1001


Estimated Parameters of Exponential Smoothing
ParameterValue
alpha0.097686644783782
beta0
gamma0.704993778027152

\begin{tabular}{lllllllll}
\hline
Estimated Parameters of Exponential Smoothing \tabularnewline
Parameter & Value \tabularnewline
alpha & 0.097686644783782 \tabularnewline
beta & 0 \tabularnewline
gamma & 0.704993778027152 \tabularnewline
\hline
\end{tabular}
%Source: https://freestatistics.org/blog/index.php?pk=13084&T=1

[TABLE]
[ROW][C]Estimated Parameters of Exponential Smoothing[/C][/ROW]
[ROW][C]Parameter[/C][C]Value[/C][/ROW]
[ROW][C]alpha[/C][C]0.097686644783782[/C][/ROW]
[ROW][C]beta[/C][C]0[/C][/ROW]
[ROW][C]gamma[/C][C]0.704993778027152[/C][/ROW]
[/TABLE]
Source: https://freestatistics.org/blog/index.php?pk=13084&T=1

Globally Unique Identifier (entire table): ba.freestatistics.org/blog/index.php?pk=13084&T=1

As an alternative you can also use a QR Code:  

The GUIDs for individual cells are displayed in the table below:

Estimated Parameters of Exponential Smoothing
ParameterValue
alpha0.097686644783782
beta0
gamma0.704993778027152


Interpolation Forecasts of Exponential Smoothing
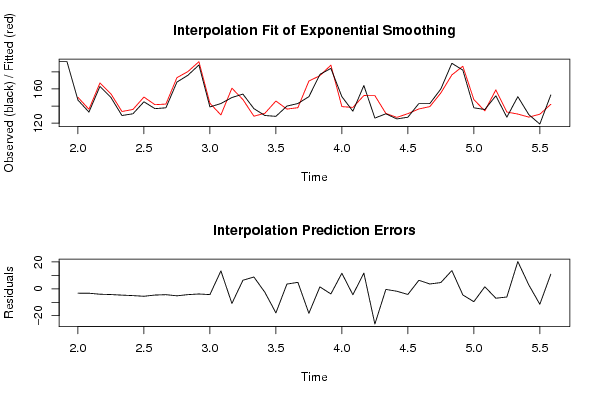
tObservedFittedResiduals
13147150.222388484918-3.22238848491787
14133136.253352653925-3.25335265392508
15163167.003592078021-4.00359207802069
16150154.242991663531-4.24299166353097
17129133.675872901086-4.67587290108574
18131136.033184156634-5.03318415663361
19145150.526673285804-5.52667328580421
20137141.633016493222-4.63301649322182
21138142.329422975999-4.32942297599899
22168173.188585697595-5.18858569759473
23176180.302323409496-4.30232340949649
24188191.827371236434-3.82737123643423
25139143.287232271632-4.28723227163181
26143129.65121890687713.348781093123
27150160.875003115433-10.8750031154329
28154147.6083857642936.3916142357073
29137128.1862963205868.81370367941375
30129131.598775622260-2.59877562226032
31128145.893302455164-17.8933024551636
32140136.4743913168793.52560868312051
33143138.1390530158294.86094698417139
34151169.220855999203-18.2208559992025
35177175.5252178747641.47478212523592
36184187.809982206161-3.80998220616084
37151139.37640691743311.6235930825669
38134138.423318646518-4.42331864651754
39164152.30468346492911.6953165350708
40126152.205019790921-26.2050197909209
41131131.425096094505-0.425096094504681
42125126.786532893885-1.78653289388504
43127131.181982964732-4.18198296473159
44143136.6328091276106.3671908723897
45143139.3858533669253.61414663307528
46160155.3203821499684.67961785003163
47190176.38032952444913.6196704755514
48182186.539718958705-4.53971895870535
49138147.568772514982-9.56877251498156
50136134.4346335150811.56536648491925
51152158.992129888929-6.99212988892876
52127133.083186866181-6.08318686618082
53151130.67473584984420.3252641501555
54130127.1311140019202.86888599808049
55119130.496086918391-11.4960869183913
56153142.04809823958610.9519017604144

\begin{tabular}{lllllllll}
\hline
Interpolation Forecasts of Exponential Smoothing \tabularnewline
t & Observed & Fitted & Residuals \tabularnewline
13 & 147 & 150.222388484918 & -3.22238848491787 \tabularnewline
14 & 133 & 136.253352653925 & -3.25335265392508 \tabularnewline
15 & 163 & 167.003592078021 & -4.00359207802069 \tabularnewline
16 & 150 & 154.242991663531 & -4.24299166353097 \tabularnewline
17 & 129 & 133.675872901086 & -4.67587290108574 \tabularnewline
18 & 131 & 136.033184156634 & -5.03318415663361 \tabularnewline
19 & 145 & 150.526673285804 & -5.52667328580421 \tabularnewline
20 & 137 & 141.633016493222 & -4.63301649322182 \tabularnewline
21 & 138 & 142.329422975999 & -4.32942297599899 \tabularnewline
22 & 168 & 173.188585697595 & -5.18858569759473 \tabularnewline
23 & 176 & 180.302323409496 & -4.30232340949649 \tabularnewline
24 & 188 & 191.827371236434 & -3.82737123643423 \tabularnewline
25 & 139 & 143.287232271632 & -4.28723227163181 \tabularnewline
26 & 143 & 129.651218906877 & 13.348781093123 \tabularnewline
27 & 150 & 160.875003115433 & -10.8750031154329 \tabularnewline
28 & 154 & 147.608385764293 & 6.3916142357073 \tabularnewline
29 & 137 & 128.186296320586 & 8.81370367941375 \tabularnewline
30 & 129 & 131.598775622260 & -2.59877562226032 \tabularnewline
31 & 128 & 145.893302455164 & -17.8933024551636 \tabularnewline
32 & 140 & 136.474391316879 & 3.52560868312051 \tabularnewline
33 & 143 & 138.139053015829 & 4.86094698417139 \tabularnewline
34 & 151 & 169.220855999203 & -18.2208559992025 \tabularnewline
35 & 177 & 175.525217874764 & 1.47478212523592 \tabularnewline
36 & 184 & 187.809982206161 & -3.80998220616084 \tabularnewline
37 & 151 & 139.376406917433 & 11.6235930825669 \tabularnewline
38 & 134 & 138.423318646518 & -4.42331864651754 \tabularnewline
39 & 164 & 152.304683464929 & 11.6953165350708 \tabularnewline
40 & 126 & 152.205019790921 & -26.2050197909209 \tabularnewline
41 & 131 & 131.425096094505 & -0.425096094504681 \tabularnewline
42 & 125 & 126.786532893885 & -1.78653289388504 \tabularnewline
43 & 127 & 131.181982964732 & -4.18198296473159 \tabularnewline
44 & 143 & 136.632809127610 & 6.3671908723897 \tabularnewline
45 & 143 & 139.385853366925 & 3.61414663307528 \tabularnewline
46 & 160 & 155.320382149968 & 4.67961785003163 \tabularnewline
47 & 190 & 176.380329524449 & 13.6196704755514 \tabularnewline
48 & 182 & 186.539718958705 & -4.53971895870535 \tabularnewline
49 & 138 & 147.568772514982 & -9.56877251498156 \tabularnewline
50 & 136 & 134.434633515081 & 1.56536648491925 \tabularnewline
51 & 152 & 158.992129888929 & -6.99212988892876 \tabularnewline
52 & 127 & 133.083186866181 & -6.08318686618082 \tabularnewline
53 & 151 & 130.674735849844 & 20.3252641501555 \tabularnewline
54 & 130 & 127.131114001920 & 2.86888599808049 \tabularnewline
55 & 119 & 130.496086918391 & -11.4960869183913 \tabularnewline
56 & 153 & 142.048098239586 & 10.9519017604144 \tabularnewline
\hline
\end{tabular}
%Source: https://freestatistics.org/blog/index.php?pk=13084&T=2

[TABLE]
[ROW][C]Interpolation Forecasts of Exponential Smoothing[/C][/ROW]
[ROW][C]t[/C][C]Observed[/C][C]Fitted[/C][C]Residuals[/C][/ROW]
[ROW][C]13[/C][C]147[/C][C]150.222388484918[/C][C]-3.22238848491787[/C][/ROW]
[ROW][C]14[/C][C]133[/C][C]136.253352653925[/C][C]-3.25335265392508[/C][/ROW]
[ROW][C]15[/C][C]163[/C][C]167.003592078021[/C][C]-4.00359207802069[/C][/ROW]
[ROW][C]16[/C][C]150[/C][C]154.242991663531[/C][C]-4.24299166353097[/C][/ROW]
[ROW][C]17[/C][C]129[/C][C]133.675872901086[/C][C]-4.67587290108574[/C][/ROW]
[ROW][C]18[/C][C]131[/C][C]136.033184156634[/C][C]-5.03318415663361[/C][/ROW]
[ROW][C]19[/C][C]145[/C][C]150.526673285804[/C][C]-5.52667328580421[/C][/ROW]
[ROW][C]20[/C][C]137[/C][C]141.633016493222[/C][C]-4.63301649322182[/C][/ROW]
[ROW][C]21[/C][C]138[/C][C]142.329422975999[/C][C]-4.32942297599899[/C][/ROW]
[ROW][C]22[/C][C]168[/C][C]173.188585697595[/C][C]-5.18858569759473[/C][/ROW]
[ROW][C]23[/C][C]176[/C][C]180.302323409496[/C][C]-4.30232340949649[/C][/ROW]
[ROW][C]24[/C][C]188[/C][C]191.827371236434[/C][C]-3.82737123643423[/C][/ROW]
[ROW][C]25[/C][C]139[/C][C]143.287232271632[/C][C]-4.28723227163181[/C][/ROW]
[ROW][C]26[/C][C]143[/C][C]129.651218906877[/C][C]13.348781093123[/C][/ROW]
[ROW][C]27[/C][C]150[/C][C]160.875003115433[/C][C]-10.8750031154329[/C][/ROW]
[ROW][C]28[/C][C]154[/C][C]147.608385764293[/C][C]6.3916142357073[/C][/ROW]
[ROW][C]29[/C][C]137[/C][C]128.186296320586[/C][C]8.81370367941375[/C][/ROW]
[ROW][C]30[/C][C]129[/C][C]131.598775622260[/C][C]-2.59877562226032[/C][/ROW]
[ROW][C]31[/C][C]128[/C][C]145.893302455164[/C][C]-17.8933024551636[/C][/ROW]
[ROW][C]32[/C][C]140[/C][C]136.474391316879[/C][C]3.52560868312051[/C][/ROW]
[ROW][C]33[/C][C]143[/C][C]138.139053015829[/C][C]4.86094698417139[/C][/ROW]
[ROW][C]34[/C][C]151[/C][C]169.220855999203[/C][C]-18.2208559992025[/C][/ROW]
[ROW][C]35[/C][C]177[/C][C]175.525217874764[/C][C]1.47478212523592[/C][/ROW]
[ROW][C]36[/C][C]184[/C][C]187.809982206161[/C][C]-3.80998220616084[/C][/ROW]
[ROW][C]37[/C][C]151[/C][C]139.376406917433[/C][C]11.6235930825669[/C][/ROW]
[ROW][C]38[/C][C]134[/C][C]138.423318646518[/C][C]-4.42331864651754[/C][/ROW]
[ROW][C]39[/C][C]164[/C][C]152.304683464929[/C][C]11.6953165350708[/C][/ROW]
[ROW][C]40[/C][C]126[/C][C]152.205019790921[/C][C]-26.2050197909209[/C][/ROW]
[ROW][C]41[/C][C]131[/C][C]131.425096094505[/C][C]-0.425096094504681[/C][/ROW]
[ROW][C]42[/C][C]125[/C][C]126.786532893885[/C][C]-1.78653289388504[/C][/ROW]
[ROW][C]43[/C][C]127[/C][C]131.181982964732[/C][C]-4.18198296473159[/C][/ROW]
[ROW][C]44[/C][C]143[/C][C]136.632809127610[/C][C]6.3671908723897[/C][/ROW]
[ROW][C]45[/C][C]143[/C][C]139.385853366925[/C][C]3.61414663307528[/C][/ROW]
[ROW][C]46[/C][C]160[/C][C]155.320382149968[/C][C]4.67961785003163[/C][/ROW]
[ROW][C]47[/C][C]190[/C][C]176.380329524449[/C][C]13.6196704755514[/C][/ROW]
[ROW][C]48[/C][C]182[/C][C]186.539718958705[/C][C]-4.53971895870535[/C][/ROW]
[ROW][C]49[/C][C]138[/C][C]147.568772514982[/C][C]-9.56877251498156[/C][/ROW]
[ROW][C]50[/C][C]136[/C][C]134.434633515081[/C][C]1.56536648491925[/C][/ROW]
[ROW][C]51[/C][C]152[/C][C]158.992129888929[/C][C]-6.99212988892876[/C][/ROW]
[ROW][C]52[/C][C]127[/C][C]133.083186866181[/C][C]-6.08318686618082[/C][/ROW]
[ROW][C]53[/C][C]151[/C][C]130.674735849844[/C][C]20.3252641501555[/C][/ROW]
[ROW][C]54[/C][C]130[/C][C]127.131114001920[/C][C]2.86888599808049[/C][/ROW]
[ROW][C]55[/C][C]119[/C][C]130.496086918391[/C][C]-11.4960869183913[/C][/ROW]
[ROW][C]56[/C][C]153[/C][C]142.048098239586[/C][C]10.9519017604144[/C][/ROW]
[/TABLE]
Source: https://freestatistics.org/blog/index.php?pk=13084&T=2

Globally Unique Identifier (entire table): ba.freestatistics.org/blog/index.php?pk=13084&T=2

As an alternative you can also use a QR Code:  

The GUIDs for individual cells are displayed in the table below:

Interpolation Forecasts of Exponential Smoothing
tObservedFittedResiduals
13147150.222388484918-3.22238848491787
14133136.253352653925-3.25335265392508
15163167.003592078021-4.00359207802069
16150154.242991663531-4.24299166353097
17129133.675872901086-4.67587290108574
18131136.033184156634-5.03318415663361
19145150.526673285804-5.52667328580421
20137141.633016493222-4.63301649322182
21138142.329422975999-4.32942297599899
22168173.188585697595-5.18858569759473
23176180.302323409496-4.30232340949649
24188191.827371236434-3.82737123643423
25139143.287232271632-4.28723227163181
26143129.65121890687713.348781093123
27150160.875003115433-10.8750031154329
28154147.6083857642936.3916142357073
29137128.1862963205868.81370367941375
30129131.598775622260-2.59877562226032
31128145.893302455164-17.8933024551636
32140136.4743913168793.52560868312051
33143138.1390530158294.86094698417139
34151169.220855999203-18.2208559992025
35177175.5252178747641.47478212523592
36184187.809982206161-3.80998220616084
37151139.37640691743311.6235930825669
38134138.423318646518-4.42331864651754
39164152.30468346492911.6953165350708
40126152.205019790921-26.2050197909209
41131131.425096094505-0.425096094504681
42125126.786532893885-1.78653289388504
43127131.181982964732-4.18198296473159
44143136.6328091276106.3671908723897
45143139.3858533669253.61414663307528
46160155.3203821499684.67961785003163
47190176.38032952444913.6196704755514
48182186.539718958705-4.53971895870535
49138147.568772514982-9.56877251498156
50136134.4346335150811.56536648491925
51152158.992129888929-6.99212988892876
52127133.083186866181-6.08318686618082
53151130.67473584984420.3252641501555
54130127.1311140019202.86888599808049
55119130.496086918391-11.4960869183913
56153142.04809823958610.9519017604144


Extrapolation Forecasts of Exponential Smoothing
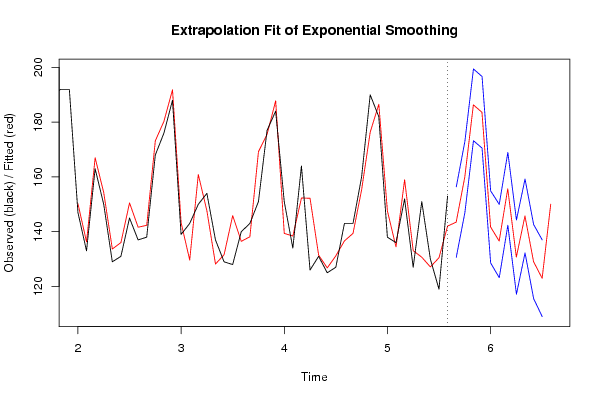
tForecast95% Lower Bound95% Upper Bound
57143.496715447539130.650414368644156.343016526434
58159.914123947998146.914200353622172.914047542375
59186.330652511677173.22637608088199.434928942474
60183.601696959642170.534149159407196.669244759877
61141.746655871753128.591189617804154.902122125702
62136.585153937784123.196050203477149.974257672091
63155.666866327906142.357833752865168.975898902946
64130.712348374896117.158383238447144.266313511345
65145.744420893647132.254487981846159.234353805448
66129.089148263673115.558960955790142.619335571556
67122.979433377715108.970522378058136.988344377372
68150.084734583256NANA

\begin{tabular}{lllllllll}
\hline
Extrapolation Forecasts of Exponential Smoothing \tabularnewline
t & Forecast & 95% Lower Bound & 95% Upper Bound \tabularnewline
57 & 143.496715447539 & 130.650414368644 & 156.343016526434 \tabularnewline
58 & 159.914123947998 & 146.914200353622 & 172.914047542375 \tabularnewline
59 & 186.330652511677 & 173.22637608088 & 199.434928942474 \tabularnewline
60 & 183.601696959642 & 170.534149159407 & 196.669244759877 \tabularnewline
61 & 141.746655871753 & 128.591189617804 & 154.902122125702 \tabularnewline
62 & 136.585153937784 & 123.196050203477 & 149.974257672091 \tabularnewline
63 & 155.666866327906 & 142.357833752865 & 168.975898902946 \tabularnewline
64 & 130.712348374896 & 117.158383238447 & 144.266313511345 \tabularnewline
65 & 145.744420893647 & 132.254487981846 & 159.234353805448 \tabularnewline
66 & 129.089148263673 & 115.558960955790 & 142.619335571556 \tabularnewline
67 & 122.979433377715 & 108.970522378058 & 136.988344377372 \tabularnewline
68 & 150.084734583256 & NA & NA \tabularnewline
\hline
\end{tabular}
%Source: https://freestatistics.org/blog/index.php?pk=13084&T=3

[TABLE]
[ROW][C]Extrapolation Forecasts of Exponential Smoothing[/C][/ROW]
[ROW][C]t[/C][C]Forecast[/C][C]95% Lower Bound[/C][C]95% Upper Bound[/C][/ROW]
[ROW][C]57[/C][C]143.496715447539[/C][C]130.650414368644[/C][C]156.343016526434[/C][/ROW]
[ROW][C]58[/C][C]159.914123947998[/C][C]146.914200353622[/C][C]172.914047542375[/C][/ROW]
[ROW][C]59[/C][C]186.330652511677[/C][C]173.22637608088[/C][C]199.434928942474[/C][/ROW]
[ROW][C]60[/C][C]183.601696959642[/C][C]170.534149159407[/C][C]196.669244759877[/C][/ROW]
[ROW][C]61[/C][C]141.746655871753[/C][C]128.591189617804[/C][C]154.902122125702[/C][/ROW]
[ROW][C]62[/C][C]136.585153937784[/C][C]123.196050203477[/C][C]149.974257672091[/C][/ROW]
[ROW][C]63[/C][C]155.666866327906[/C][C]142.357833752865[/C][C]168.975898902946[/C][/ROW]
[ROW][C]64[/C][C]130.712348374896[/C][C]117.158383238447[/C][C]144.266313511345[/C][/ROW]
[ROW][C]65[/C][C]145.744420893647[/C][C]132.254487981846[/C][C]159.234353805448[/C][/ROW]
[ROW][C]66[/C][C]129.089148263673[/C][C]115.558960955790[/C][C]142.619335571556[/C][/ROW]
[ROW][C]67[/C][C]122.979433377715[/C][C]108.970522378058[/C][C]136.988344377372[/C][/ROW]
[ROW][C]68[/C][C]150.084734583256[/C][C]NA[/C][C]NA[/C][/ROW]
[/TABLE]
Source: https://freestatistics.org/blog/index.php?pk=13084&T=3

Globally Unique Identifier (entire table): ba.freestatistics.org/blog/index.php?pk=13084&T=3

As an alternative you can also use a QR Code:  

The GUIDs for individual cells are displayed in the table below:

Extrapolation Forecasts of Exponential Smoothing
tForecast95% Lower Bound95% Upper Bound
57143.496715447539130.650414368644156.343016526434
58159.914123947998146.914200353622172.914047542375
59186.330652511677173.22637608088199.434928942474
60183.601696959642170.534149159407196.669244759877
61141.746655871753128.591189617804154.902122125702
62136.585153937784123.196050203477149.974257672091
63155.666866327906142.357833752865168.975898902946
64130.712348374896117.158383238447144.266313511345
65145.744420893647132.254487981846159.234353805448
66129.089148263673115.558960955790142.619335571556
67122.979433377715108.970522378058136.988344377372
68150.084734583256NANA


Parameters (Session):
par1 = 12 ; par2 = Triple ; par3 = multiplicative ;
Parameters (R input):
par1 = 12 ; par2 = Triple ; par3 = multiplicative ;
R code (references can be found in the software module):
par1 <- as.numeric(par1)
if (par2 == 'Single') K <- 1
if (par2 == 'Double') K <- 2
if (par2 == 'Triple') K <- par1
nx <- length(x)
nxmK <- nx - K
x <- ts(x, frequency = par1)
if (par2 == 'Single') fit <- HoltWinters(x, gamma=0, beta=0)
if (par2 == 'Double') fit <- HoltWinters(x, gamma=0)
if (par2 == 'Triple') fit <- HoltWinters(x, seasonal=par3)
fit
myresid <- x - fit$fitted[,'xhat']
bitmap(file='test1.png')
op <- par(mfrow=c(2,1))
plot(fit,ylab='Observed (black) / Fitted (red)',main='Interpolation Fit of Exponential Smoothing')
plot(myresid,ylab='Residuals',main='Interpolation Prediction Errors')
par(op)
dev.off()
bitmap(file='test2.png')
p <- predict(fit, par1, prediction.interval=TRUE)
np <- length(p[,1])
plot(fit,p,ylab='Observed (black) / Fitted (red)',main='Extrapolation Fit of Exponential Smoothing')
dev.off()
bitmap(file='test3.png')
op <- par(mfrow = c(2,2))
acf(as.numeric(myresid),lag.max = nx/2,main='Residual ACF')
spectrum(myresid,main='Residals Periodogram')
cpgram(myresid,main='Residal Cumulative Periodogram')
qqnorm(myresid,main='Residual Normal QQ Plot')
qqline(myresid)
par(op)
dev.off()
load(file='createtable')
a<-table.start()
a<-table.row.start(a)
a<-table.element(a,'Estimated Parameters of Exponential Smoothing',2,TRUE)
a<-table.row.end(a)
a<-table.row.start(a)
a<-table.element(a,'Parameter',header=TRUE)
a<-table.element(a,'Value',header=TRUE)
a<-table.row.end(a)
a<-table.row.start(a)
a<-table.element(a,'alpha',header=TRUE)
a<-table.element(a,fit$alpha)
a<-table.row.end(a)
a<-table.row.start(a)
a<-table.element(a,'beta',header=TRUE)
a<-table.element(a,fit$beta)
a<-table.row.end(a)
a<-table.row.start(a)
a<-table.element(a,'gamma',header=TRUE)
a<-table.element(a,fit$gamma)
a<-table.row.end(a)
a<-table.end(a)
table.save(a,file='mytable.tab')
a<-table.start()
a<-table.row.start(a)
a<-table.element(a,'Interpolation Forecasts of Exponential Smoothing',4,TRUE)
a<-table.row.end(a)
a<-table.row.start(a)
a<-table.element(a,'t',header=TRUE)
a<-table.element(a,'Observed',header=TRUE)
a<-table.element(a,'Fitted',header=TRUE)
a<-table.element(a,'Residuals',header=TRUE)
a<-table.row.end(a)
for (i in 1:nxmK) {
a<-table.row.start(a)
a<-table.element(a,i+K,header=TRUE)
a<-table.element(a,x[i+K])
a<-table.element(a,fit$fitted[i,'xhat'])
a<-table.element(a,myresid[i])
a<-table.row.end(a)
}
a<-table.end(a)
table.save(a,file='mytable1.tab')
a<-table.start()
a<-table.row.start(a)
a<-table.element(a,'Extrapolation Forecasts of Exponential Smoothing',4,TRUE)
a<-table.row.end(a)
a<-table.row.start(a)
a<-table.element(a,'t',header=TRUE)
a<-table.element(a,'Forecast',header=TRUE)
a<-table.element(a,'95% Lower Bound',header=TRUE)
a<-table.element(a,'95% Upper Bound',header=TRUE)
a<-table.row.end(a)
for (i in 1:np) {
a<-table.row.start(a)
a<-table.element(a,nx+i,header=TRUE)
a<-table.element(a,p[i,'fit'])
a<-table.element(a,p[i,'lwr'])
a<-table.element(a,p[i,'upr'])
a<-table.row.end(a)
}
a<-table.end(a)
table.save(a,file='mytable2.tab')