Free Statistics

of Irreproducible Research!

Author's title

Author*Unverified author*
R Software Modulerwasp_exponentialsmoothing.wasp
Title produced by softwareExponential Smoothing
Date of computationSun, 25 May 2008 10:00:33 -0600
Cite this page as followsStatistical Computations at FreeStatistics.org, Office for Research Development and Education, URL https://freestatistics.org/blog/index.php?v=date/2008/May/25/t12117313075a1xx7vflq3pqlx.htm/, Retrieved Wed, 15 May 2024 22:08:23 +0000
Statistical Computations at FreeStatistics.org, Office for Research Development and Education, URL https://freestatistics.org/blog/index.php?pk=13175, Retrieved Wed, 15 May 2024 22:08:23 +0000
QR Codes:

Original text written by user:
IsPrivate?No (this computation is public)
User-defined keywords
Estimated Impact147
Family? (F = Feedback message, R = changed R code, M = changed R Module, P = changed Parameters, D = changed Data)
-       [Exponential Smoothing] [Tom Knaepen - Gou...] [2008-05-25 16:00:33] [d41d8cd98f00b204e9800998ecf8427e] [Current]
Feedback Forum

Post a new message
Dataseries X:
10236
10893
10756
10940
10997
10827
10166
10186
10457
10368
10244
10511
10812
10738
10171
9721
9897
9828
9924
10371
10846
10413
10709
10662
10570
10297
10635
10872
10296
10383
10431
10574
10653
10805
10872
10625
10407
10463
10556
10646
10702
11353
11346
11451
11964
12574
13031
13812
14544
14931
14886
16005
17064
15168
16050
15839
15137
14954
15648
15305
15579
16348
15928
16171
15937
15713
15594
15683
16438
17032
17696
17745


Summary of computational transaction
Raw Inputview raw input (R code)
Raw Outputview raw output of R engine
Computing time6 seconds
R Server'Herman Ole Andreas Wold' @ 193.190.124.10:1001

\begin{tabular}{lllllllll}
\hline
Summary of computational transaction \tabularnewline
Raw Input & view raw input (R code)  \tabularnewline
Raw Output & view raw output of R engine  \tabularnewline
Computing time & 6 seconds \tabularnewline
R Server & 'Herman Ole Andreas Wold' @ 193.190.124.10:1001 \tabularnewline
\hline
\end{tabular}
%Source: https://freestatistics.org/blog/index.php?pk=13175&T=0

[TABLE]
[ROW][C]Summary of computational transaction[/C][/ROW]
[ROW][C]Raw Input[/C][C]view raw input (R code) [/C][/ROW]
[ROW][C]Raw Output[/C][C]view raw output of R engine [/C][/ROW]
[ROW][C]Computing time[/C][C]6 seconds[/C][/ROW]
[ROW][C]R Server[/C][C]'Herman Ole Andreas Wold' @ 193.190.124.10:1001[/C][/ROW]
[/TABLE]
Source: https://freestatistics.org/blog/index.php?pk=13175&T=0

Globally Unique Identifier (entire table): ba.freestatistics.org/blog/index.php?pk=13175&T=0

As an alternative you can also use a QR Code:  

The GUIDs for individual cells are displayed in the table below:

Summary of computational transaction
Raw Inputview raw input (R code)
Raw Outputview raw output of R engine
Computing time6 seconds
R Server'Herman Ole Andreas Wold' @ 193.190.124.10:1001


Estimated Parameters of Exponential Smoothing
ParameterValue
alpha0.847259609453347
beta0.0285189422376599
gamma1

\begin{tabular}{lllllllll}
\hline
Estimated Parameters of Exponential Smoothing \tabularnewline
Parameter & Value \tabularnewline
alpha & 0.847259609453347 \tabularnewline
beta & 0.0285189422376599 \tabularnewline
gamma & 1 \tabularnewline
\hline
\end{tabular}
%Source: https://freestatistics.org/blog/index.php?pk=13175&T=1

[TABLE]
[ROW][C]Estimated Parameters of Exponential Smoothing[/C][/ROW]
[ROW][C]Parameter[/C][C]Value[/C][/ROW]
[ROW][C]alpha[/C][C]0.847259609453347[/C][/ROW]
[ROW][C]beta[/C][C]0.0285189422376599[/C][/ROW]
[ROW][C]gamma[/C][C]1[/C][/ROW]
[/TABLE]
Source: https://freestatistics.org/blog/index.php?pk=13175&T=1

Globally Unique Identifier (entire table): ba.freestatistics.org/blog/index.php?pk=13175&T=1

As an alternative you can also use a QR Code:  

The GUIDs for individual cells are displayed in the table below:

Estimated Parameters of Exponential Smoothing
ParameterValue
alpha0.847259609453347
beta0.0285189422376599
gamma1


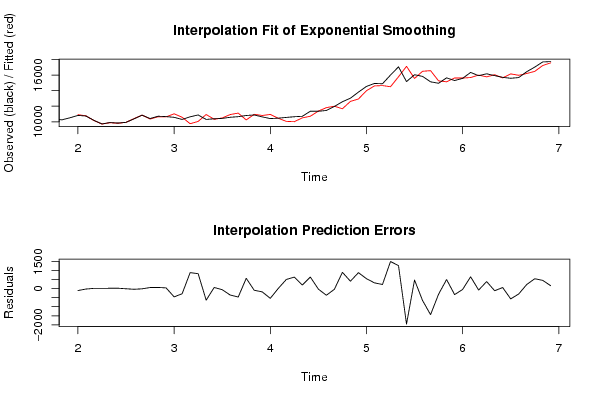
Interpolation Forecasts of Exponential Smoothing
tObservedFittedResiduals
131081210914.545-102.545000000002
141073810758.5325100920-20.5325100919545
151017110152.218097716218.7819022838121
1697219702.5003584747818.4996415252208
1798979875.8238103002621.1761896997414
1898289802.5100057877325.4899942122684
1999249927.92536033625-3.92536033624674
201037110403.9900914676-32.9900914675727
211084610853.2156453249-7.21564532493721
221041310349.771161759963.2288382401257
231070910639.247572283469.7524277165885
241066210617.769914286544.2300857134705
251057011023.6991726782-453.699172678183
261029710576.4797557018-279.479755701808
27106359744.30297144189890.697028558112
281087210041.876900282830.123099717992
291029610931.4724699731-635.4724699731
301038310314.806630017168.193369982906
311043110485.2827160569-54.2827160568722
321057410926.3983518576-352.398351857648
331065311113.3771581826-460.37715818264
341080510230.2353995896574.764600410377
351087210959.9604811899-87.9604811899335
361062510802.9986097014-177.998609701406
371040710941.2567172338-534.256717233828
381046310447.116136778115.8838632218649
391055610045.7807801648510.219219835191
401064610004.4041825719641.59581742813
411070210498.5222248473203.477775152729
421135310708.5244120152644.475587984793
431134611370.859951866-24.8599518660067
441145111814.3868015072-363.386801507182
451196411998.3140926721-34.3140926720862
461257411667.3125361300906.687463870016
471303112618.1040195344412.89598046557
481381212924.9137617263887.086238273743
491454413990.0644512583553.935548741722
501493114607.1320573339323.867942666113
511488614654.8840954089231.115904591148
521600514502.99703430611502.00296569392
531706415785.87094270921278.12905729083
541516817126.3926391424-1958.39263914245
551605015570.9482258911479.051774108901
561583916491.6481334537-652.64813345372
571513716575.7049980647-1438.70499806466
581495415259.5607950411-305.560795041072
591564815139.5619948300508.438005170025
601530515633.7778245057-328.777824505683
611557915622.5407604476-43.5407604476204
621634815688.4637410486659.536258951406
631592816004.7712741020-76.771274102035
641617115777.0244373676393.975562632419
651593716051.0284935064-114.028493506383
661571315648.156709631664.843290368377
671559416158.5749061471-564.57490614714
681568315976.3390119373-293.339011937251
691643816207.5865352134230.413464786594
701703216481.8518848546550.148115145385
711769617235.0236337073460.976366292685
721774517583.8361052263161.16389477365

\begin{tabular}{lllllllll}
\hline
Interpolation Forecasts of Exponential Smoothing \tabularnewline
t & Observed & Fitted & Residuals \tabularnewline
13 & 10812 & 10914.545 & -102.545000000002 \tabularnewline
14 & 10738 & 10758.5325100920 & -20.5325100919545 \tabularnewline
15 & 10171 & 10152.2180977162 & 18.7819022838121 \tabularnewline
16 & 9721 & 9702.50035847478 & 18.4996415252208 \tabularnewline
17 & 9897 & 9875.82381030026 & 21.1761896997414 \tabularnewline
18 & 9828 & 9802.51000578773 & 25.4899942122684 \tabularnewline
19 & 9924 & 9927.92536033625 & -3.92536033624674 \tabularnewline
20 & 10371 & 10403.9900914676 & -32.9900914675727 \tabularnewline
21 & 10846 & 10853.2156453249 & -7.21564532493721 \tabularnewline
22 & 10413 & 10349.7711617599 & 63.2288382401257 \tabularnewline
23 & 10709 & 10639.2475722834 & 69.7524277165885 \tabularnewline
24 & 10662 & 10617.7699142865 & 44.2300857134705 \tabularnewline
25 & 10570 & 11023.6991726782 & -453.699172678183 \tabularnewline
26 & 10297 & 10576.4797557018 & -279.479755701808 \tabularnewline
27 & 10635 & 9744.30297144189 & 890.697028558112 \tabularnewline
28 & 10872 & 10041.876900282 & 830.123099717992 \tabularnewline
29 & 10296 & 10931.4724699731 & -635.4724699731 \tabularnewline
30 & 10383 & 10314.8066300171 & 68.193369982906 \tabularnewline
31 & 10431 & 10485.2827160569 & -54.2827160568722 \tabularnewline
32 & 10574 & 10926.3983518576 & -352.398351857648 \tabularnewline
33 & 10653 & 11113.3771581826 & -460.37715818264 \tabularnewline
34 & 10805 & 10230.2353995896 & 574.764600410377 \tabularnewline
35 & 10872 & 10959.9604811899 & -87.9604811899335 \tabularnewline
36 & 10625 & 10802.9986097014 & -177.998609701406 \tabularnewline
37 & 10407 & 10941.2567172338 & -534.256717233828 \tabularnewline
38 & 10463 & 10447.1161367781 & 15.8838632218649 \tabularnewline
39 & 10556 & 10045.7807801648 & 510.219219835191 \tabularnewline
40 & 10646 & 10004.4041825719 & 641.59581742813 \tabularnewline
41 & 10702 & 10498.5222248473 & 203.477775152729 \tabularnewline
42 & 11353 & 10708.5244120152 & 644.475587984793 \tabularnewline
43 & 11346 & 11370.859951866 & -24.8599518660067 \tabularnewline
44 & 11451 & 11814.3868015072 & -363.386801507182 \tabularnewline
45 & 11964 & 11998.3140926721 & -34.3140926720862 \tabularnewline
46 & 12574 & 11667.3125361300 & 906.687463870016 \tabularnewline
47 & 13031 & 12618.1040195344 & 412.89598046557 \tabularnewline
48 & 13812 & 12924.9137617263 & 887.086238273743 \tabularnewline
49 & 14544 & 13990.0644512583 & 553.935548741722 \tabularnewline
50 & 14931 & 14607.1320573339 & 323.867942666113 \tabularnewline
51 & 14886 & 14654.8840954089 & 231.115904591148 \tabularnewline
52 & 16005 & 14502.9970343061 & 1502.00296569392 \tabularnewline
53 & 17064 & 15785.8709427092 & 1278.12905729083 \tabularnewline
54 & 15168 & 17126.3926391424 & -1958.39263914245 \tabularnewline
55 & 16050 & 15570.9482258911 & 479.051774108901 \tabularnewline
56 & 15839 & 16491.6481334537 & -652.64813345372 \tabularnewline
57 & 15137 & 16575.7049980647 & -1438.70499806466 \tabularnewline
58 & 14954 & 15259.5607950411 & -305.560795041072 \tabularnewline
59 & 15648 & 15139.5619948300 & 508.438005170025 \tabularnewline
60 & 15305 & 15633.7778245057 & -328.777824505683 \tabularnewline
61 & 15579 & 15622.5407604476 & -43.5407604476204 \tabularnewline
62 & 16348 & 15688.4637410486 & 659.536258951406 \tabularnewline
63 & 15928 & 16004.7712741020 & -76.771274102035 \tabularnewline
64 & 16171 & 15777.0244373676 & 393.975562632419 \tabularnewline
65 & 15937 & 16051.0284935064 & -114.028493506383 \tabularnewline
66 & 15713 & 15648.1567096316 & 64.843290368377 \tabularnewline
67 & 15594 & 16158.5749061471 & -564.57490614714 \tabularnewline
68 & 15683 & 15976.3390119373 & -293.339011937251 \tabularnewline
69 & 16438 & 16207.5865352134 & 230.413464786594 \tabularnewline
70 & 17032 & 16481.8518848546 & 550.148115145385 \tabularnewline
71 & 17696 & 17235.0236337073 & 460.976366292685 \tabularnewline
72 & 17745 & 17583.8361052263 & 161.16389477365 \tabularnewline
\hline
\end{tabular}
%Source: https://freestatistics.org/blog/index.php?pk=13175&T=2

[TABLE]
[ROW][C]Interpolation Forecasts of Exponential Smoothing[/C][/ROW]
[ROW][C]t[/C][C]Observed[/C][C]Fitted[/C][C]Residuals[/C][/ROW]
[ROW][C]13[/C][C]10812[/C][C]10914.545[/C][C]-102.545000000002[/C][/ROW]
[ROW][C]14[/C][C]10738[/C][C]10758.5325100920[/C][C]-20.5325100919545[/C][/ROW]
[ROW][C]15[/C][C]10171[/C][C]10152.2180977162[/C][C]18.7819022838121[/C][/ROW]
[ROW][C]16[/C][C]9721[/C][C]9702.50035847478[/C][C]18.4996415252208[/C][/ROW]
[ROW][C]17[/C][C]9897[/C][C]9875.82381030026[/C][C]21.1761896997414[/C][/ROW]
[ROW][C]18[/C][C]9828[/C][C]9802.51000578773[/C][C]25.4899942122684[/C][/ROW]
[ROW][C]19[/C][C]9924[/C][C]9927.92536033625[/C][C]-3.92536033624674[/C][/ROW]
[ROW][C]20[/C][C]10371[/C][C]10403.9900914676[/C][C]-32.9900914675727[/C][/ROW]
[ROW][C]21[/C][C]10846[/C][C]10853.2156453249[/C][C]-7.21564532493721[/C][/ROW]
[ROW][C]22[/C][C]10413[/C][C]10349.7711617599[/C][C]63.2288382401257[/C][/ROW]
[ROW][C]23[/C][C]10709[/C][C]10639.2475722834[/C][C]69.7524277165885[/C][/ROW]
[ROW][C]24[/C][C]10662[/C][C]10617.7699142865[/C][C]44.2300857134705[/C][/ROW]
[ROW][C]25[/C][C]10570[/C][C]11023.6991726782[/C][C]-453.699172678183[/C][/ROW]
[ROW][C]26[/C][C]10297[/C][C]10576.4797557018[/C][C]-279.479755701808[/C][/ROW]
[ROW][C]27[/C][C]10635[/C][C]9744.30297144189[/C][C]890.697028558112[/C][/ROW]
[ROW][C]28[/C][C]10872[/C][C]10041.876900282[/C][C]830.123099717992[/C][/ROW]
[ROW][C]29[/C][C]10296[/C][C]10931.4724699731[/C][C]-635.4724699731[/C][/ROW]
[ROW][C]30[/C][C]10383[/C][C]10314.8066300171[/C][C]68.193369982906[/C][/ROW]
[ROW][C]31[/C][C]10431[/C][C]10485.2827160569[/C][C]-54.2827160568722[/C][/ROW]
[ROW][C]32[/C][C]10574[/C][C]10926.3983518576[/C][C]-352.398351857648[/C][/ROW]
[ROW][C]33[/C][C]10653[/C][C]11113.3771581826[/C][C]-460.37715818264[/C][/ROW]
[ROW][C]34[/C][C]10805[/C][C]10230.2353995896[/C][C]574.764600410377[/C][/ROW]
[ROW][C]35[/C][C]10872[/C][C]10959.9604811899[/C][C]-87.9604811899335[/C][/ROW]
[ROW][C]36[/C][C]10625[/C][C]10802.9986097014[/C][C]-177.998609701406[/C][/ROW]
[ROW][C]37[/C][C]10407[/C][C]10941.2567172338[/C][C]-534.256717233828[/C][/ROW]
[ROW][C]38[/C][C]10463[/C][C]10447.1161367781[/C][C]15.8838632218649[/C][/ROW]
[ROW][C]39[/C][C]10556[/C][C]10045.7807801648[/C][C]510.219219835191[/C][/ROW]
[ROW][C]40[/C][C]10646[/C][C]10004.4041825719[/C][C]641.59581742813[/C][/ROW]
[ROW][C]41[/C][C]10702[/C][C]10498.5222248473[/C][C]203.477775152729[/C][/ROW]
[ROW][C]42[/C][C]11353[/C][C]10708.5244120152[/C][C]644.475587984793[/C][/ROW]
[ROW][C]43[/C][C]11346[/C][C]11370.859951866[/C][C]-24.8599518660067[/C][/ROW]
[ROW][C]44[/C][C]11451[/C][C]11814.3868015072[/C][C]-363.386801507182[/C][/ROW]
[ROW][C]45[/C][C]11964[/C][C]11998.3140926721[/C][C]-34.3140926720862[/C][/ROW]
[ROW][C]46[/C][C]12574[/C][C]11667.3125361300[/C][C]906.687463870016[/C][/ROW]
[ROW][C]47[/C][C]13031[/C][C]12618.1040195344[/C][C]412.89598046557[/C][/ROW]
[ROW][C]48[/C][C]13812[/C][C]12924.9137617263[/C][C]887.086238273743[/C][/ROW]
[ROW][C]49[/C][C]14544[/C][C]13990.0644512583[/C][C]553.935548741722[/C][/ROW]
[ROW][C]50[/C][C]14931[/C][C]14607.1320573339[/C][C]323.867942666113[/C][/ROW]
[ROW][C]51[/C][C]14886[/C][C]14654.8840954089[/C][C]231.115904591148[/C][/ROW]
[ROW][C]52[/C][C]16005[/C][C]14502.9970343061[/C][C]1502.00296569392[/C][/ROW]
[ROW][C]53[/C][C]17064[/C][C]15785.8709427092[/C][C]1278.12905729083[/C][/ROW]
[ROW][C]54[/C][C]15168[/C][C]17126.3926391424[/C][C]-1958.39263914245[/C][/ROW]
[ROW][C]55[/C][C]16050[/C][C]15570.9482258911[/C][C]479.051774108901[/C][/ROW]
[ROW][C]56[/C][C]15839[/C][C]16491.6481334537[/C][C]-652.64813345372[/C][/ROW]
[ROW][C]57[/C][C]15137[/C][C]16575.7049980647[/C][C]-1438.70499806466[/C][/ROW]
[ROW][C]58[/C][C]14954[/C][C]15259.5607950411[/C][C]-305.560795041072[/C][/ROW]
[ROW][C]59[/C][C]15648[/C][C]15139.5619948300[/C][C]508.438005170025[/C][/ROW]
[ROW][C]60[/C][C]15305[/C][C]15633.7778245057[/C][C]-328.777824505683[/C][/ROW]
[ROW][C]61[/C][C]15579[/C][C]15622.5407604476[/C][C]-43.5407604476204[/C][/ROW]
[ROW][C]62[/C][C]16348[/C][C]15688.4637410486[/C][C]659.536258951406[/C][/ROW]
[ROW][C]63[/C][C]15928[/C][C]16004.7712741020[/C][C]-76.771274102035[/C][/ROW]
[ROW][C]64[/C][C]16171[/C][C]15777.0244373676[/C][C]393.975562632419[/C][/ROW]
[ROW][C]65[/C][C]15937[/C][C]16051.0284935064[/C][C]-114.028493506383[/C][/ROW]
[ROW][C]66[/C][C]15713[/C][C]15648.1567096316[/C][C]64.843290368377[/C][/ROW]
[ROW][C]67[/C][C]15594[/C][C]16158.5749061471[/C][C]-564.57490614714[/C][/ROW]
[ROW][C]68[/C][C]15683[/C][C]15976.3390119373[/C][C]-293.339011937251[/C][/ROW]
[ROW][C]69[/C][C]16438[/C][C]16207.5865352134[/C][C]230.413464786594[/C][/ROW]
[ROW][C]70[/C][C]17032[/C][C]16481.8518848546[/C][C]550.148115145385[/C][/ROW]
[ROW][C]71[/C][C]17696[/C][C]17235.0236337073[/C][C]460.976366292685[/C][/ROW]
[ROW][C]72[/C][C]17745[/C][C]17583.8361052263[/C][C]161.16389477365[/C][/ROW]
[/TABLE]
Source: https://freestatistics.org/blog/index.php?pk=13175&T=2

Globally Unique Identifier (entire table): ba.freestatistics.org/blog/index.php?pk=13175&T=2

As an alternative you can also use a QR Code:  

The GUIDs for individual cells are displayed in the table below:

Interpolation Forecasts of Exponential Smoothing
tObservedFittedResiduals
131081210914.545-102.545000000002
141073810758.5325100920-20.5325100919545
151017110152.218097716218.7819022838121
1697219702.5003584747818.4996415252208
1798979875.8238103002621.1761896997414
1898289802.5100057877325.4899942122684
1999249927.92536033625-3.92536033624674
201037110403.9900914676-32.9900914675727
211084610853.2156453249-7.21564532493721
221041310349.771161759963.2288382401257
231070910639.247572283469.7524277165885
241066210617.769914286544.2300857134705
251057011023.6991726782-453.699172678183
261029710576.4797557018-279.479755701808
27106359744.30297144189890.697028558112
281087210041.876900282830.123099717992
291029610931.4724699731-635.4724699731
301038310314.806630017168.193369982906
311043110485.2827160569-54.2827160568722
321057410926.3983518576-352.398351857648
331065311113.3771581826-460.37715818264
341080510230.2353995896574.764600410377
351087210959.9604811899-87.9604811899335
361062510802.9986097014-177.998609701406
371040710941.2567172338-534.256717233828
381046310447.116136778115.8838632218649
391055610045.7807801648510.219219835191
401064610004.4041825719641.59581742813
411070210498.5222248473203.477775152729
421135310708.5244120152644.475587984793
431134611370.859951866-24.8599518660067
441145111814.3868015072-363.386801507182
451196411998.3140926721-34.3140926720862
461257411667.3125361300906.687463870016
471303112618.1040195344412.89598046557
481381212924.9137617263887.086238273743
491454413990.0644512583553.935548741722
501493114607.1320573339323.867942666113
511488614654.8840954089231.115904591148
521600514502.99703430611502.00296569392
531706415785.87094270921278.12905729083
541516817126.3926391424-1958.39263914245
551605015570.9482258911479.051774108901
561583916491.6481334537-652.64813345372
571513716575.7049980647-1438.70499806466
581495415259.5607950411-305.560795041072
591564815139.5619948300508.438005170025
601530515633.7778245057-328.777824505683
611557915622.5407604476-43.5407604476204
621634815688.4637410486659.536258951406
631592816004.7712741020-76.771274102035
641617115777.0244373676393.975562632419
651593716051.0284935064-114.028493506383
661571315648.156709631664.843290368377
671559416158.5749061471-564.57490614714
681568315976.3390119373-293.339011937251
691643816207.5865352134230.413464786594
701703216481.8518848546550.148115145385
711769617235.0236337073460.976366292685
721774517583.8361052263161.16389477365


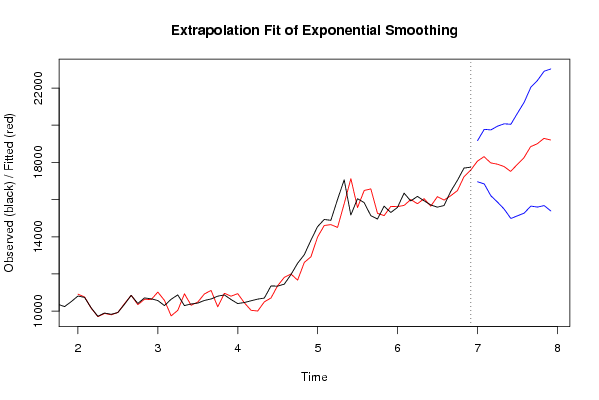
Extrapolation Forecasts of Exponential Smoothing
tForecast95% Lower Bound95% Upper Bound
7318065.7981719416958.401088161719173.1952557182
7418311.575892362716842.707571924319780.444212801
7517976.260905439416203.923621161819748.5981897170
7617906.956157766615862.799559241619951.1127562915
7717781.543117319715485.634501603820077.4517330356
7817517.334503668314983.469482541620051.1995247950
7917889.839700335115127.986174389320651.6932262808
8018254.179473225415271.778224070521236.5807223803
8118847.852862487915650.58045297922045.1252719969
8219004.060528222315596.309389055722411.8116673890
8319292.526614841215677.723703562722907.3295261197
8419208.873151084015389.700515280823028.0457868871

\begin{tabular}{lllllllll}
\hline
Extrapolation Forecasts of Exponential Smoothing \tabularnewline
t & Forecast & 95% Lower Bound & 95% Upper Bound \tabularnewline
73 & 18065.79817194 & 16958.4010881617 & 19173.1952557182 \tabularnewline
74 & 18311.5758923627 & 16842.7075719243 & 19780.444212801 \tabularnewline
75 & 17976.2609054394 & 16203.9236211618 & 19748.5981897170 \tabularnewline
76 & 17906.9561577666 & 15862.7995592416 & 19951.1127562915 \tabularnewline
77 & 17781.5431173197 & 15485.6345016038 & 20077.4517330356 \tabularnewline
78 & 17517.3345036683 & 14983.4694825416 & 20051.1995247950 \tabularnewline
79 & 17889.8397003351 & 15127.9861743893 & 20651.6932262808 \tabularnewline
80 & 18254.1794732254 & 15271.7782240705 & 21236.5807223803 \tabularnewline
81 & 18847.8528624879 & 15650.580452979 & 22045.1252719969 \tabularnewline
82 & 19004.0605282223 & 15596.3093890557 & 22411.8116673890 \tabularnewline
83 & 19292.5266148412 & 15677.7237035627 & 22907.3295261197 \tabularnewline
84 & 19208.8731510840 & 15389.7005152808 & 23028.0457868871 \tabularnewline
\hline
\end{tabular}
%Source: https://freestatistics.org/blog/index.php?pk=13175&T=3

[TABLE]
[ROW][C]Extrapolation Forecasts of Exponential Smoothing[/C][/ROW]
[ROW][C]t[/C][C]Forecast[/C][C]95% Lower Bound[/C][C]95% Upper Bound[/C][/ROW]
[ROW][C]73[/C][C]18065.79817194[/C][C]16958.4010881617[/C][C]19173.1952557182[/C][/ROW]
[ROW][C]74[/C][C]18311.5758923627[/C][C]16842.7075719243[/C][C]19780.444212801[/C][/ROW]
[ROW][C]75[/C][C]17976.2609054394[/C][C]16203.9236211618[/C][C]19748.5981897170[/C][/ROW]
[ROW][C]76[/C][C]17906.9561577666[/C][C]15862.7995592416[/C][C]19951.1127562915[/C][/ROW]
[ROW][C]77[/C][C]17781.5431173197[/C][C]15485.6345016038[/C][C]20077.4517330356[/C][/ROW]
[ROW][C]78[/C][C]17517.3345036683[/C][C]14983.4694825416[/C][C]20051.1995247950[/C][/ROW]
[ROW][C]79[/C][C]17889.8397003351[/C][C]15127.9861743893[/C][C]20651.6932262808[/C][/ROW]
[ROW][C]80[/C][C]18254.1794732254[/C][C]15271.7782240705[/C][C]21236.5807223803[/C][/ROW]
[ROW][C]81[/C][C]18847.8528624879[/C][C]15650.580452979[/C][C]22045.1252719969[/C][/ROW]
[ROW][C]82[/C][C]19004.0605282223[/C][C]15596.3093890557[/C][C]22411.8116673890[/C][/ROW]
[ROW][C]83[/C][C]19292.5266148412[/C][C]15677.7237035627[/C][C]22907.3295261197[/C][/ROW]
[ROW][C]84[/C][C]19208.8731510840[/C][C]15389.7005152808[/C][C]23028.0457868871[/C][/ROW]
[/TABLE]
Source: https://freestatistics.org/blog/index.php?pk=13175&T=3

Globally Unique Identifier (entire table): ba.freestatistics.org/blog/index.php?pk=13175&T=3

As an alternative you can also use a QR Code:  

The GUIDs for individual cells are displayed in the table below:

Extrapolation Forecasts of Exponential Smoothing
tForecast95% Lower Bound95% Upper Bound
7318065.7981719416958.401088161719173.1952557182
7418311.575892362716842.707571924319780.444212801
7517976.260905439416203.923621161819748.5981897170
7617906.956157766615862.799559241619951.1127562915
7717781.543117319715485.634501603820077.4517330356
7817517.334503668314983.469482541620051.1995247950
7917889.839700335115127.986174389320651.6932262808
8018254.179473225415271.778224070521236.5807223803
8118847.852862487915650.58045297922045.1252719969
8219004.060528222315596.309389055722411.8116673890
8319292.526614841215677.723703562722907.3295261197
8419208.873151084015389.700515280823028.0457868871


Parameters (Session):
par1 = 12 ; par2 = Triple ; par3 = additive ;
Parameters (R input):
par1 = 12 ; par2 = Triple ; par3 = additive ;
R code (references can be found in the software module):
par1 <- as.numeric(par1)
if (par2 == 'Single') K <- 1
if (par2 == 'Double') K <- 2
if (par2 == 'Triple') K <- par1
nx <- length(x)
nxmK <- nx - K
x <- ts(x, frequency = par1)
if (par2 == 'Single') fit <- HoltWinters(x, gamma=0, beta=0)
if (par2 == 'Double') fit <- HoltWinters(x, gamma=0)
if (par2 == 'Triple') fit <- HoltWinters(x, seasonal=par3)
fit
myresid <- x - fit$fitted[,'xhat']
bitmap(file='test1.png')
op <- par(mfrow=c(2,1))
plot(fit,ylab='Observed (black) / Fitted (red)',main='Interpolation Fit of Exponential Smoothing')
plot(myresid,ylab='Residuals',main='Interpolation Prediction Errors')
par(op)
dev.off()
bitmap(file='test2.png')
p <- predict(fit, par1, prediction.interval=TRUE)
np <- length(p[,1])
plot(fit,p,ylab='Observed (black) / Fitted (red)',main='Extrapolation Fit of Exponential Smoothing')
dev.off()
bitmap(file='test3.png')
op <- par(mfrow = c(2,2))
acf(as.numeric(myresid),lag.max = nx/2,main='Residual ACF')
spectrum(myresid,main='Residals Periodogram')
cpgram(myresid,main='Residal Cumulative Periodogram')
qqnorm(myresid,main='Residual Normal QQ Plot')
qqline(myresid)
par(op)
dev.off()
load(file='createtable')
a<-table.start()
a<-table.row.start(a)
a<-table.element(a,'Estimated Parameters of Exponential Smoothing',2,TRUE)
a<-table.row.end(a)
a<-table.row.start(a)
a<-table.element(a,'Parameter',header=TRUE)
a<-table.element(a,'Value',header=TRUE)
a<-table.row.end(a)
a<-table.row.start(a)
a<-table.element(a,'alpha',header=TRUE)
a<-table.element(a,fit$alpha)
a<-table.row.end(a)
a<-table.row.start(a)
a<-table.element(a,'beta',header=TRUE)
a<-table.element(a,fit$beta)
a<-table.row.end(a)
a<-table.row.start(a)
a<-table.element(a,'gamma',header=TRUE)
a<-table.element(a,fit$gamma)
a<-table.row.end(a)
a<-table.end(a)
table.save(a,file='mytable.tab')
a<-table.start()
a<-table.row.start(a)
a<-table.element(a,'Interpolation Forecasts of Exponential Smoothing',4,TRUE)
a<-table.row.end(a)
a<-table.row.start(a)
a<-table.element(a,'t',header=TRUE)
a<-table.element(a,'Observed',header=TRUE)
a<-table.element(a,'Fitted',header=TRUE)
a<-table.element(a,'Residuals',header=TRUE)
a<-table.row.end(a)
for (i in 1:nxmK) {
a<-table.row.start(a)
a<-table.element(a,i+K,header=TRUE)
a<-table.element(a,x[i+K])
a<-table.element(a,fit$fitted[i,'xhat'])
a<-table.element(a,myresid[i])
a<-table.row.end(a)
}
a<-table.end(a)
table.save(a,file='mytable1.tab')
a<-table.start()
a<-table.row.start(a)
a<-table.element(a,'Extrapolation Forecasts of Exponential Smoothing',4,TRUE)
a<-table.row.end(a)
a<-table.row.start(a)
a<-table.element(a,'t',header=TRUE)
a<-table.element(a,'Forecast',header=TRUE)
a<-table.element(a,'95% Lower Bound',header=TRUE)
a<-table.element(a,'95% Upper Bound',header=TRUE)
a<-table.row.end(a)
for (i in 1:np) {
a<-table.row.start(a)
a<-table.element(a,nx+i,header=TRUE)
a<-table.element(a,p[i,'fit'])
a<-table.element(a,p[i,'lwr'])
a<-table.element(a,p[i,'upr'])
a<-table.row.end(a)
}
a<-table.end(a)
table.save(a,file='mytable2.tab')