Free Statistics

of Irreproducible Research!

Author's title

Author*Unverified author*
R Software Modulerwasp_exponentialsmoothing.wasp
Title produced by softwareExponential Smoothing
Date of computationSun, 25 May 2008 13:19:29 -0600
Cite this page as followsStatistical Computations at FreeStatistics.org, Office for Research Development and Education, URL https://freestatistics.org/blog/index.php?v=date/2008/May/25/t1211743263coelcalfoyczxbq.htm/, Retrieved Wed, 15 May 2024 00:10:41 +0000
Statistical Computations at FreeStatistics.org, Office for Research Development and Education, URL https://freestatistics.org/blog/index.php?pk=13202, Retrieved Wed, 15 May 2024 00:10:41 +0000
QR Codes:

Original text written by user:
IsPrivate?No (this computation is public)
User-defined keywords
Estimated Impact160
Family? (F = Feedback message, R = changed R code, M = changed R Module, P = changed Parameters, D = changed Data)
-       [Exponential Smoothing] [exponential smoot...] [2008-05-25 19:19:29] [7f4b1d09016442cbb55a129b1af5b7b8] [Current]
Feedback Forum

Post a new message
Dataseries X:
16.100
15.800
16.900
17.800
17.600
18.300
18.000
15.700
14.500
14.000
15.500
15.800
15.800
15.900
18.000
19.900
20.600
20.600
20.800
20.000
18.500
17.700
17.000
16.600
16.700
17.300
19.100
20.200
20.700
21.500
21.000
16.800
16.800
16.500
17.200
17.300
17.600
18.400
19.900
20.500
21.200
21.300
20.800
18.800
18.100
18.100
18.800
18.700
18.700
19.000
20.100
20.500
21.600
21.800
21.500
21.200
20.400
20.400
20.600
19.300
18.600
19.400
23.500
24.600
25.900
26.600
24.100
21.800
21.300
21.100
21.200
21.600


Summary of computational transaction
Raw Inputview raw input (R code)
Raw Outputview raw output of R engine
Computing time5 seconds
R Server'Gwilym Jenkins' @ 72.249.127.135

\begin{tabular}{lllllllll}
\hline
Summary of computational transaction \tabularnewline
Raw Input & view raw input (R code)  \tabularnewline
Raw Output & view raw output of R engine  \tabularnewline
Computing time & 5 seconds \tabularnewline
R Server & 'Gwilym Jenkins' @ 72.249.127.135 \tabularnewline
\hline
\end{tabular}
%Source: https://freestatistics.org/blog/index.php?pk=13202&T=0

[TABLE]
[ROW][C]Summary of computational transaction[/C][/ROW]
[ROW][C]Raw Input[/C][C]view raw input (R code) [/C][/ROW]
[ROW][C]Raw Output[/C][C]view raw output of R engine [/C][/ROW]
[ROW][C]Computing time[/C][C]5 seconds[/C][/ROW]
[ROW][C]R Server[/C][C]'Gwilym Jenkins' @ 72.249.127.135[/C][/ROW]
[/TABLE]
Source: https://freestatistics.org/blog/index.php?pk=13202&T=0

Globally Unique Identifier (entire table): ba.freestatistics.org/blog/index.php?pk=13202&T=0

As an alternative you can also use a QR Code:  

The GUIDs for individual cells are displayed in the table below:

Summary of computational transaction
Raw Inputview raw input (R code)
Raw Outputview raw output of R engine
Computing time5 seconds
R Server'Gwilym Jenkins' @ 72.249.127.135


Estimated Parameters of Exponential Smoothing
ParameterValue
alpha0.713479405306526
beta0.000573542998306538
gamma0.982697728764368

\begin{tabular}{lllllllll}
\hline
Estimated Parameters of Exponential Smoothing \tabularnewline
Parameter & Value \tabularnewline
alpha & 0.713479405306526 \tabularnewline
beta & 0.000573542998306538 \tabularnewline
gamma & 0.982697728764368 \tabularnewline
\hline
\end{tabular}
%Source: https://freestatistics.org/blog/index.php?pk=13202&T=1

[TABLE]
[ROW][C]Estimated Parameters of Exponential Smoothing[/C][/ROW]
[ROW][C]Parameter[/C][C]Value[/C][/ROW]
[ROW][C]alpha[/C][C]0.713479405306526[/C][/ROW]
[ROW][C]beta[/C][C]0.000573542998306538[/C][/ROW]
[ROW][C]gamma[/C][C]0.982697728764368[/C][/ROW]
[/TABLE]
Source: https://freestatistics.org/blog/index.php?pk=13202&T=1

Globally Unique Identifier (entire table): ba.freestatistics.org/blog/index.php?pk=13202&T=1

As an alternative you can also use a QR Code:  

The GUIDs for individual cells are displayed in the table below:

Estimated Parameters of Exponential Smoothing
ParameterValue
alpha0.713479405306526
beta0.000573542998306538
gamma0.982697728764368


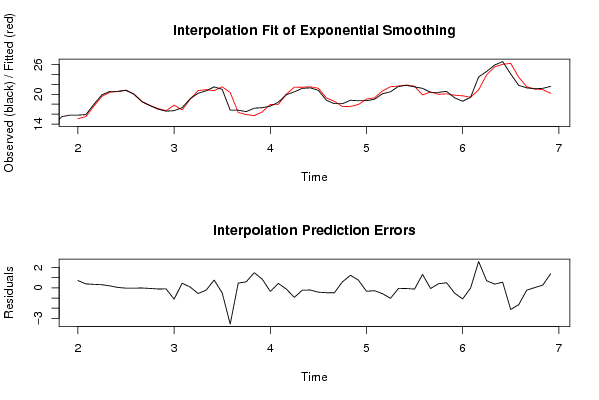
Interpolation Forecasts of Exponential Smoothing
tObservedFittedResiduals
1315.815.08465277777780.715347222222215
1415.915.51244152375900.387558476240956
151817.65651834342850.343481656571484
1619.919.59428781652490.305712183475109
1720.620.40940131590860.190598684091420
1820.620.56329503264300.0367049673569539
1920.820.8324037719621-0.0324037719621089
202020.0271915890666-0.0271915890665824
2118.518.5173537308898-0.0173537308898339
2217.717.7603612139083-0.0603612139082514
231717.1143257097058-0.114325709705835
2416.616.7047408657827-0.104740865782674
2516.717.8075338245395-1.10753382453946
2617.316.84235947474730.457640525252714
2719.119.02397488099750.0760251190025336
2820.220.7601225807557-0.560122580755731
2920.720.924552229563-0.224552229562999
3021.520.73822677736630.7617732226337
312121.5048082725798-0.50480827257983
3216.820.3634294147106-3.56342941471062
3316.816.33129825467620.468701745323813
3416.515.90715546804220.592844531957795
3517.215.71041017733161.48958982266844
3617.316.44697689155160.853023108448372
3717.617.9502492360665-0.350249236066507
3818.417.96587118115450.434128818845494
3919.920.0230469528414-0.123046952841381
4020.521.4377479392110-0.937747939210954
4121.221.4267822367241-0.226782236724112
4221.321.5161260207658-0.216126020765831
4320.821.2275211295833-0.427521129583308
4418.819.2792689617513-0.479268961751266
4518.118.5833632120164-0.483363212016389
4618.117.5149470663810.585052933618996
4718.817.56518120809111.23481879190890
4818.717.94068422192330.759315778076687
4918.719.0382067377487-0.338206737748724
501919.2831831899690-0.283183189968977
5120.120.6713084119903-0.571308411990277
5220.521.5362278338246-1.03622783382458
5321.621.6545737103083-0.0545737103082864
5421.821.8692488202708-0.0692488202708432
5521.521.6254405117158-0.125440511715766
5621.219.87779377131751.32220622868251
5720.420.4664352726871-0.0664352726871158
5820.419.99687043259880.403129567401241
5920.620.10073687296030.499263127039665
6019.319.8177317103542-0.517731710354184
6118.619.6947424407981-1.0947424407981
6219.419.4147864498598-0.0147864498597698
6323.520.91273920537082.5872607946292
6424.623.90107848535060.698921514649442
6525.925.53527529476190.364724705238064
6626.626.04661079301780.553389206982214
6724.126.2331067494480-2.13310674944795
6821.823.4617002593213-1.66170025932128
6921.321.5302394334239-0.230239433423886
7021.121.07579257484800.0242074251520243
7121.220.93599520502860.264004794971402
7221.620.19831520769341.40168479230663

\begin{tabular}{lllllllll}
\hline
Interpolation Forecasts of Exponential Smoothing \tabularnewline
t & Observed & Fitted & Residuals \tabularnewline
13 & 15.8 & 15.0846527777778 & 0.715347222222215 \tabularnewline
14 & 15.9 & 15.5124415237590 & 0.387558476240956 \tabularnewline
15 & 18 & 17.6565183434285 & 0.343481656571484 \tabularnewline
16 & 19.9 & 19.5942878165249 & 0.305712183475109 \tabularnewline
17 & 20.6 & 20.4094013159086 & 0.190598684091420 \tabularnewline
18 & 20.6 & 20.5632950326430 & 0.0367049673569539 \tabularnewline
19 & 20.8 & 20.8324037719621 & -0.0324037719621089 \tabularnewline
20 & 20 & 20.0271915890666 & -0.0271915890665824 \tabularnewline
21 & 18.5 & 18.5173537308898 & -0.0173537308898339 \tabularnewline
22 & 17.7 & 17.7603612139083 & -0.0603612139082514 \tabularnewline
23 & 17 & 17.1143257097058 & -0.114325709705835 \tabularnewline
24 & 16.6 & 16.7047408657827 & -0.104740865782674 \tabularnewline
25 & 16.7 & 17.8075338245395 & -1.10753382453946 \tabularnewline
26 & 17.3 & 16.8423594747473 & 0.457640525252714 \tabularnewline
27 & 19.1 & 19.0239748809975 & 0.0760251190025336 \tabularnewline
28 & 20.2 & 20.7601225807557 & -0.560122580755731 \tabularnewline
29 & 20.7 & 20.924552229563 & -0.224552229562999 \tabularnewline
30 & 21.5 & 20.7382267773663 & 0.7617732226337 \tabularnewline
31 & 21 & 21.5048082725798 & -0.50480827257983 \tabularnewline
32 & 16.8 & 20.3634294147106 & -3.56342941471062 \tabularnewline
33 & 16.8 & 16.3312982546762 & 0.468701745323813 \tabularnewline
34 & 16.5 & 15.9071554680422 & 0.592844531957795 \tabularnewline
35 & 17.2 & 15.7104101773316 & 1.48958982266844 \tabularnewline
36 & 17.3 & 16.4469768915516 & 0.853023108448372 \tabularnewline
37 & 17.6 & 17.9502492360665 & -0.350249236066507 \tabularnewline
38 & 18.4 & 17.9658711811545 & 0.434128818845494 \tabularnewline
39 & 19.9 & 20.0230469528414 & -0.123046952841381 \tabularnewline
40 & 20.5 & 21.4377479392110 & -0.937747939210954 \tabularnewline
41 & 21.2 & 21.4267822367241 & -0.226782236724112 \tabularnewline
42 & 21.3 & 21.5161260207658 & -0.216126020765831 \tabularnewline
43 & 20.8 & 21.2275211295833 & -0.427521129583308 \tabularnewline
44 & 18.8 & 19.2792689617513 & -0.479268961751266 \tabularnewline
45 & 18.1 & 18.5833632120164 & -0.483363212016389 \tabularnewline
46 & 18.1 & 17.514947066381 & 0.585052933618996 \tabularnewline
47 & 18.8 & 17.5651812080911 & 1.23481879190890 \tabularnewline
48 & 18.7 & 17.9406842219233 & 0.759315778076687 \tabularnewline
49 & 18.7 & 19.0382067377487 & -0.338206737748724 \tabularnewline
50 & 19 & 19.2831831899690 & -0.283183189968977 \tabularnewline
51 & 20.1 & 20.6713084119903 & -0.571308411990277 \tabularnewline
52 & 20.5 & 21.5362278338246 & -1.03622783382458 \tabularnewline
53 & 21.6 & 21.6545737103083 & -0.0545737103082864 \tabularnewline
54 & 21.8 & 21.8692488202708 & -0.0692488202708432 \tabularnewline
55 & 21.5 & 21.6254405117158 & -0.125440511715766 \tabularnewline
56 & 21.2 & 19.8777937713175 & 1.32220622868251 \tabularnewline
57 & 20.4 & 20.4664352726871 & -0.0664352726871158 \tabularnewline
58 & 20.4 & 19.9968704325988 & 0.403129567401241 \tabularnewline
59 & 20.6 & 20.1007368729603 & 0.499263127039665 \tabularnewline
60 & 19.3 & 19.8177317103542 & -0.517731710354184 \tabularnewline
61 & 18.6 & 19.6947424407981 & -1.0947424407981 \tabularnewline
62 & 19.4 & 19.4147864498598 & -0.0147864498597698 \tabularnewline
63 & 23.5 & 20.9127392053708 & 2.5872607946292 \tabularnewline
64 & 24.6 & 23.9010784853506 & 0.698921514649442 \tabularnewline
65 & 25.9 & 25.5352752947619 & 0.364724705238064 \tabularnewline
66 & 26.6 & 26.0466107930178 & 0.553389206982214 \tabularnewline
67 & 24.1 & 26.2331067494480 & -2.13310674944795 \tabularnewline
68 & 21.8 & 23.4617002593213 & -1.66170025932128 \tabularnewline
69 & 21.3 & 21.5302394334239 & -0.230239433423886 \tabularnewline
70 & 21.1 & 21.0757925748480 & 0.0242074251520243 \tabularnewline
71 & 21.2 & 20.9359952050286 & 0.264004794971402 \tabularnewline
72 & 21.6 & 20.1983152076934 & 1.40168479230663 \tabularnewline
\hline
\end{tabular}
%Source: https://freestatistics.org/blog/index.php?pk=13202&T=2

[TABLE]
[ROW][C]Interpolation Forecasts of Exponential Smoothing[/C][/ROW]
[ROW][C]t[/C][C]Observed[/C][C]Fitted[/C][C]Residuals[/C][/ROW]
[ROW][C]13[/C][C]15.8[/C][C]15.0846527777778[/C][C]0.715347222222215[/C][/ROW]
[ROW][C]14[/C][C]15.9[/C][C]15.5124415237590[/C][C]0.387558476240956[/C][/ROW]
[ROW][C]15[/C][C]18[/C][C]17.6565183434285[/C][C]0.343481656571484[/C][/ROW]
[ROW][C]16[/C][C]19.9[/C][C]19.5942878165249[/C][C]0.305712183475109[/C][/ROW]
[ROW][C]17[/C][C]20.6[/C][C]20.4094013159086[/C][C]0.190598684091420[/C][/ROW]
[ROW][C]18[/C][C]20.6[/C][C]20.5632950326430[/C][C]0.0367049673569539[/C][/ROW]
[ROW][C]19[/C][C]20.8[/C][C]20.8324037719621[/C][C]-0.0324037719621089[/C][/ROW]
[ROW][C]20[/C][C]20[/C][C]20.0271915890666[/C][C]-0.0271915890665824[/C][/ROW]
[ROW][C]21[/C][C]18.5[/C][C]18.5173537308898[/C][C]-0.0173537308898339[/C][/ROW]
[ROW][C]22[/C][C]17.7[/C][C]17.7603612139083[/C][C]-0.0603612139082514[/C][/ROW]
[ROW][C]23[/C][C]17[/C][C]17.1143257097058[/C][C]-0.114325709705835[/C][/ROW]
[ROW][C]24[/C][C]16.6[/C][C]16.7047408657827[/C][C]-0.104740865782674[/C][/ROW]
[ROW][C]25[/C][C]16.7[/C][C]17.8075338245395[/C][C]-1.10753382453946[/C][/ROW]
[ROW][C]26[/C][C]17.3[/C][C]16.8423594747473[/C][C]0.457640525252714[/C][/ROW]
[ROW][C]27[/C][C]19.1[/C][C]19.0239748809975[/C][C]0.0760251190025336[/C][/ROW]
[ROW][C]28[/C][C]20.2[/C][C]20.7601225807557[/C][C]-0.560122580755731[/C][/ROW]
[ROW][C]29[/C][C]20.7[/C][C]20.924552229563[/C][C]-0.224552229562999[/C][/ROW]
[ROW][C]30[/C][C]21.5[/C][C]20.7382267773663[/C][C]0.7617732226337[/C][/ROW]
[ROW][C]31[/C][C]21[/C][C]21.5048082725798[/C][C]-0.50480827257983[/C][/ROW]
[ROW][C]32[/C][C]16.8[/C][C]20.3634294147106[/C][C]-3.56342941471062[/C][/ROW]
[ROW][C]33[/C][C]16.8[/C][C]16.3312982546762[/C][C]0.468701745323813[/C][/ROW]
[ROW][C]34[/C][C]16.5[/C][C]15.9071554680422[/C][C]0.592844531957795[/C][/ROW]
[ROW][C]35[/C][C]17.2[/C][C]15.7104101773316[/C][C]1.48958982266844[/C][/ROW]
[ROW][C]36[/C][C]17.3[/C][C]16.4469768915516[/C][C]0.853023108448372[/C][/ROW]
[ROW][C]37[/C][C]17.6[/C][C]17.9502492360665[/C][C]-0.350249236066507[/C][/ROW]
[ROW][C]38[/C][C]18.4[/C][C]17.9658711811545[/C][C]0.434128818845494[/C][/ROW]
[ROW][C]39[/C][C]19.9[/C][C]20.0230469528414[/C][C]-0.123046952841381[/C][/ROW]
[ROW][C]40[/C][C]20.5[/C][C]21.4377479392110[/C][C]-0.937747939210954[/C][/ROW]
[ROW][C]41[/C][C]21.2[/C][C]21.4267822367241[/C][C]-0.226782236724112[/C][/ROW]
[ROW][C]42[/C][C]21.3[/C][C]21.5161260207658[/C][C]-0.216126020765831[/C][/ROW]
[ROW][C]43[/C][C]20.8[/C][C]21.2275211295833[/C][C]-0.427521129583308[/C][/ROW]
[ROW][C]44[/C][C]18.8[/C][C]19.2792689617513[/C][C]-0.479268961751266[/C][/ROW]
[ROW][C]45[/C][C]18.1[/C][C]18.5833632120164[/C][C]-0.483363212016389[/C][/ROW]
[ROW][C]46[/C][C]18.1[/C][C]17.514947066381[/C][C]0.585052933618996[/C][/ROW]
[ROW][C]47[/C][C]18.8[/C][C]17.5651812080911[/C][C]1.23481879190890[/C][/ROW]
[ROW][C]48[/C][C]18.7[/C][C]17.9406842219233[/C][C]0.759315778076687[/C][/ROW]
[ROW][C]49[/C][C]18.7[/C][C]19.0382067377487[/C][C]-0.338206737748724[/C][/ROW]
[ROW][C]50[/C][C]19[/C][C]19.2831831899690[/C][C]-0.283183189968977[/C][/ROW]
[ROW][C]51[/C][C]20.1[/C][C]20.6713084119903[/C][C]-0.571308411990277[/C][/ROW]
[ROW][C]52[/C][C]20.5[/C][C]21.5362278338246[/C][C]-1.03622783382458[/C][/ROW]
[ROW][C]53[/C][C]21.6[/C][C]21.6545737103083[/C][C]-0.0545737103082864[/C][/ROW]
[ROW][C]54[/C][C]21.8[/C][C]21.8692488202708[/C][C]-0.0692488202708432[/C][/ROW]
[ROW][C]55[/C][C]21.5[/C][C]21.6254405117158[/C][C]-0.125440511715766[/C][/ROW]
[ROW][C]56[/C][C]21.2[/C][C]19.8777937713175[/C][C]1.32220622868251[/C][/ROW]
[ROW][C]57[/C][C]20.4[/C][C]20.4664352726871[/C][C]-0.0664352726871158[/C][/ROW]
[ROW][C]58[/C][C]20.4[/C][C]19.9968704325988[/C][C]0.403129567401241[/C][/ROW]
[ROW][C]59[/C][C]20.6[/C][C]20.1007368729603[/C][C]0.499263127039665[/C][/ROW]
[ROW][C]60[/C][C]19.3[/C][C]19.8177317103542[/C][C]-0.517731710354184[/C][/ROW]
[ROW][C]61[/C][C]18.6[/C][C]19.6947424407981[/C][C]-1.0947424407981[/C][/ROW]
[ROW][C]62[/C][C]19.4[/C][C]19.4147864498598[/C][C]-0.0147864498597698[/C][/ROW]
[ROW][C]63[/C][C]23.5[/C][C]20.9127392053708[/C][C]2.5872607946292[/C][/ROW]
[ROW][C]64[/C][C]24.6[/C][C]23.9010784853506[/C][C]0.698921514649442[/C][/ROW]
[ROW][C]65[/C][C]25.9[/C][C]25.5352752947619[/C][C]0.364724705238064[/C][/ROW]
[ROW][C]66[/C][C]26.6[/C][C]26.0466107930178[/C][C]0.553389206982214[/C][/ROW]
[ROW][C]67[/C][C]24.1[/C][C]26.2331067494480[/C][C]-2.13310674944795[/C][/ROW]
[ROW][C]68[/C][C]21.8[/C][C]23.4617002593213[/C][C]-1.66170025932128[/C][/ROW]
[ROW][C]69[/C][C]21.3[/C][C]21.5302394334239[/C][C]-0.230239433423886[/C][/ROW]
[ROW][C]70[/C][C]21.1[/C][C]21.0757925748480[/C][C]0.0242074251520243[/C][/ROW]
[ROW][C]71[/C][C]21.2[/C][C]20.9359952050286[/C][C]0.264004794971402[/C][/ROW]
[ROW][C]72[/C][C]21.6[/C][C]20.1983152076934[/C][C]1.40168479230663[/C][/ROW]
[/TABLE]
Source: https://freestatistics.org/blog/index.php?pk=13202&T=2

Globally Unique Identifier (entire table): ba.freestatistics.org/blog/index.php?pk=13202&T=2

As an alternative you can also use a QR Code:  

The GUIDs for individual cells are displayed in the table below:

Interpolation Forecasts of Exponential Smoothing
tObservedFittedResiduals
1315.815.08465277777780.715347222222215
1415.915.51244152375900.387558476240956
151817.65651834342850.343481656571484
1619.919.59428781652490.305712183475109
1720.620.40940131590860.190598684091420
1820.620.56329503264300.0367049673569539
1920.820.8324037719621-0.0324037719621089
202020.0271915890666-0.0271915890665824
2118.518.5173537308898-0.0173537308898339
2217.717.7603612139083-0.0603612139082514
231717.1143257097058-0.114325709705835
2416.616.7047408657827-0.104740865782674
2516.717.8075338245395-1.10753382453946
2617.316.84235947474730.457640525252714
2719.119.02397488099750.0760251190025336
2820.220.7601225807557-0.560122580755731
2920.720.924552229563-0.224552229562999
3021.520.73822677736630.7617732226337
312121.5048082725798-0.50480827257983
3216.820.3634294147106-3.56342941471062
3316.816.33129825467620.468701745323813
3416.515.90715546804220.592844531957795
3517.215.71041017733161.48958982266844
3617.316.44697689155160.853023108448372
3717.617.9502492360665-0.350249236066507
3818.417.96587118115450.434128818845494
3919.920.0230469528414-0.123046952841381
4020.521.4377479392110-0.937747939210954
4121.221.4267822367241-0.226782236724112
4221.321.5161260207658-0.216126020765831
4320.821.2275211295833-0.427521129583308
4418.819.2792689617513-0.479268961751266
4518.118.5833632120164-0.483363212016389
4618.117.5149470663810.585052933618996
4718.817.56518120809111.23481879190890
4818.717.94068422192330.759315778076687
4918.719.0382067377487-0.338206737748724
501919.2831831899690-0.283183189968977
5120.120.6713084119903-0.571308411990277
5220.521.5362278338246-1.03622783382458
5321.621.6545737103083-0.0545737103082864
5421.821.8692488202708-0.0692488202708432
5521.521.6254405117158-0.125440511715766
5621.219.87779377131751.32220622868251
5720.420.4664352726871-0.0664352726871158
5820.419.99687043259880.403129567401241
5920.620.10073687296030.499263127039665
6019.319.8177317103542-0.517731710354184
6118.619.6947424407981-1.0947424407981
6219.419.4147864498598-0.0147864498597698
6323.520.91273920537082.5872607946292
6424.623.90107848535060.698921514649442
6525.925.53527529476190.364724705238064
6626.626.04661079301780.553389206982214
6724.126.2331067494480-2.13310674944795
6821.823.4617002593213-1.66170025932128
6921.321.5302394334239-0.230239433423886
7021.121.07579257484800.0242074251520243
7121.220.93599520502860.264004794971402
7221.620.19831520769341.40168479230663


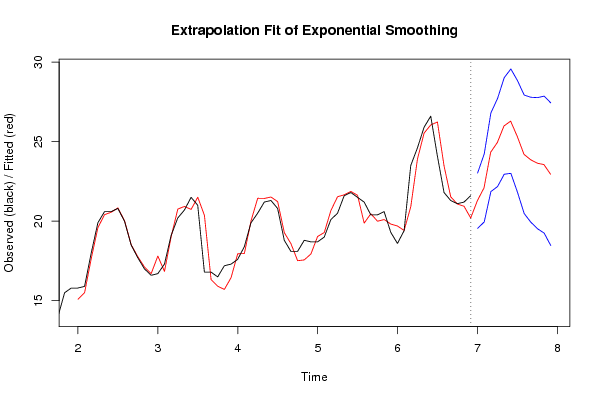
Extrapolation Forecasts of Exponential Smoothing
tForecast95% Lower Bound95% Upper Bound
7321.282635975360119.543357141687023.0219148090332
7422.088590792245619.951586121821224.2255954626701
7524.330498837326921.858605835045726.8023918396081
7624.940900231330322.174044609090427.7077558535703
7725.981753565175922.948192121373629.0153150089782
7826.285257350620523.006344264724229.5641704365167
7925.319547704867421.812152799519728.8269426102151
8024.202716962149620.480601966875827.9248319574234
8123.860488958741319.935156477799627.7858214396831
8223.642647574713219.523897135700527.7613980137259
8323.553778424135919.250087992662027.8574688556099
8422.948638777377218.467436421720727.4298411330338

\begin{tabular}{lllllllll}
\hline
Extrapolation Forecasts of Exponential Smoothing \tabularnewline
t & Forecast & 95% Lower Bound & 95% Upper Bound \tabularnewline
73 & 21.2826359753601 & 19.5433571416870 & 23.0219148090332 \tabularnewline
74 & 22.0885907922456 & 19.9515861218212 & 24.2255954626701 \tabularnewline
75 & 24.3304988373269 & 21.8586058350457 & 26.8023918396081 \tabularnewline
76 & 24.9409002313303 & 22.1740446090904 & 27.7077558535703 \tabularnewline
77 & 25.9817535651759 & 22.9481921213736 & 29.0153150089782 \tabularnewline
78 & 26.2852573506205 & 23.0063442647242 & 29.5641704365167 \tabularnewline
79 & 25.3195477048674 & 21.8121527995197 & 28.8269426102151 \tabularnewline
80 & 24.2027169621496 & 20.4806019668758 & 27.9248319574234 \tabularnewline
81 & 23.8604889587413 & 19.9351564777996 & 27.7858214396831 \tabularnewline
82 & 23.6426475747132 & 19.5238971357005 & 27.7613980137259 \tabularnewline
83 & 23.5537784241359 & 19.2500879926620 & 27.8574688556099 \tabularnewline
84 & 22.9486387773772 & 18.4674364217207 & 27.4298411330338 \tabularnewline
\hline
\end{tabular}
%Source: https://freestatistics.org/blog/index.php?pk=13202&T=3

[TABLE]
[ROW][C]Extrapolation Forecasts of Exponential Smoothing[/C][/ROW]
[ROW][C]t[/C][C]Forecast[/C][C]95% Lower Bound[/C][C]95% Upper Bound[/C][/ROW]
[ROW][C]73[/C][C]21.2826359753601[/C][C]19.5433571416870[/C][C]23.0219148090332[/C][/ROW]
[ROW][C]74[/C][C]22.0885907922456[/C][C]19.9515861218212[/C][C]24.2255954626701[/C][/ROW]
[ROW][C]75[/C][C]24.3304988373269[/C][C]21.8586058350457[/C][C]26.8023918396081[/C][/ROW]
[ROW][C]76[/C][C]24.9409002313303[/C][C]22.1740446090904[/C][C]27.7077558535703[/C][/ROW]
[ROW][C]77[/C][C]25.9817535651759[/C][C]22.9481921213736[/C][C]29.0153150089782[/C][/ROW]
[ROW][C]78[/C][C]26.2852573506205[/C][C]23.0063442647242[/C][C]29.5641704365167[/C][/ROW]
[ROW][C]79[/C][C]25.3195477048674[/C][C]21.8121527995197[/C][C]28.8269426102151[/C][/ROW]
[ROW][C]80[/C][C]24.2027169621496[/C][C]20.4806019668758[/C][C]27.9248319574234[/C][/ROW]
[ROW][C]81[/C][C]23.8604889587413[/C][C]19.9351564777996[/C][C]27.7858214396831[/C][/ROW]
[ROW][C]82[/C][C]23.6426475747132[/C][C]19.5238971357005[/C][C]27.7613980137259[/C][/ROW]
[ROW][C]83[/C][C]23.5537784241359[/C][C]19.2500879926620[/C][C]27.8574688556099[/C][/ROW]
[ROW][C]84[/C][C]22.9486387773772[/C][C]18.4674364217207[/C][C]27.4298411330338[/C][/ROW]
[/TABLE]
Source: https://freestatistics.org/blog/index.php?pk=13202&T=3

Globally Unique Identifier (entire table): ba.freestatistics.org/blog/index.php?pk=13202&T=3

As an alternative you can also use a QR Code:  

The GUIDs for individual cells are displayed in the table below:

Extrapolation Forecasts of Exponential Smoothing
tForecast95% Lower Bound95% Upper Bound
7321.282635975360119.543357141687023.0219148090332
7422.088590792245619.951586121821224.2255954626701
7524.330498837326921.858605835045726.8023918396081
7624.940900231330322.174044609090427.7077558535703
7725.981753565175922.948192121373629.0153150089782
7826.285257350620523.006344264724229.5641704365167
7925.319547704867421.812152799519728.8269426102151
8024.202716962149620.480601966875827.9248319574234
8123.860488958741319.935156477799627.7858214396831
8223.642647574713219.523897135700527.7613980137259
8323.553778424135919.250087992662027.8574688556099
8422.948638777377218.467436421720727.4298411330338


Parameters (Session):
par1 = 12 ; par2 = Triple ; par3 = additive ;
Parameters (R input):
par1 = 12 ; par2 = Triple ; par3 = additive ;
R code (references can be found in the software module):
par1 <- as.numeric(par1)
if (par2 == 'Single') K <- 1
if (par2 == 'Double') K <- 2
if (par2 == 'Triple') K <- par1
nx <- length(x)
nxmK <- nx - K
x <- ts(x, frequency = par1)
if (par2 == 'Single') fit <- HoltWinters(x, gamma=0, beta=0)
if (par2 == 'Double') fit <- HoltWinters(x, gamma=0)
if (par2 == 'Triple') fit <- HoltWinters(x, seasonal=par3)
fit
myresid <- x - fit$fitted[,'xhat']
bitmap(file='test1.png')
op <- par(mfrow=c(2,1))
plot(fit,ylab='Observed (black) / Fitted (red)',main='Interpolation Fit of Exponential Smoothing')
plot(myresid,ylab='Residuals',main='Interpolation Prediction Errors')
par(op)
dev.off()
bitmap(file='test2.png')
p <- predict(fit, par1, prediction.interval=TRUE)
np <- length(p[,1])
plot(fit,p,ylab='Observed (black) / Fitted (red)',main='Extrapolation Fit of Exponential Smoothing')
dev.off()
bitmap(file='test3.png')
op <- par(mfrow = c(2,2))
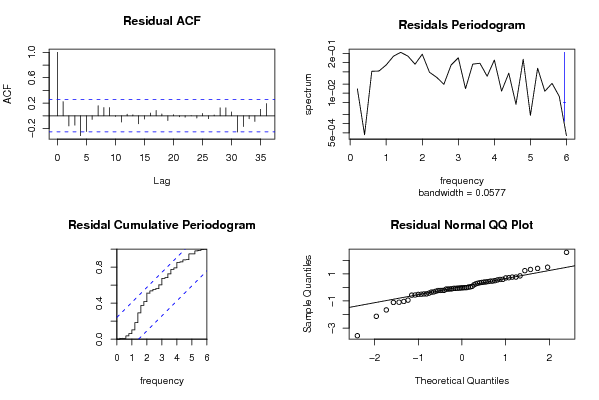
acf(as.numeric(myresid),lag.max = nx/2,main='Residual ACF')
spectrum(myresid,main='Residals Periodogram')
cpgram(myresid,main='Residal Cumulative Periodogram')
qqnorm(myresid,main='Residual Normal QQ Plot')
qqline(myresid)
par(op)
dev.off()
load(file='createtable')
a<-table.start()
a<-table.row.start(a)
a<-table.element(a,'Estimated Parameters of Exponential Smoothing',2,TRUE)
a<-table.row.end(a)
a<-table.row.start(a)
a<-table.element(a,'Parameter',header=TRUE)
a<-table.element(a,'Value',header=TRUE)
a<-table.row.end(a)
a<-table.row.start(a)
a<-table.element(a,'alpha',header=TRUE)
a<-table.element(a,fit$alpha)
a<-table.row.end(a)
a<-table.row.start(a)
a<-table.element(a,'beta',header=TRUE)
a<-table.element(a,fit$beta)
a<-table.row.end(a)
a<-table.row.start(a)
a<-table.element(a,'gamma',header=TRUE)
a<-table.element(a,fit$gamma)
a<-table.row.end(a)
a<-table.end(a)
table.save(a,file='mytable.tab')
a<-table.start()
a<-table.row.start(a)
a<-table.element(a,'Interpolation Forecasts of Exponential Smoothing',4,TRUE)
a<-table.row.end(a)
a<-table.row.start(a)
a<-table.element(a,'t',header=TRUE)
a<-table.element(a,'Observed',header=TRUE)
a<-table.element(a,'Fitted',header=TRUE)
a<-table.element(a,'Residuals',header=TRUE)
a<-table.row.end(a)
for (i in 1:nxmK) {
a<-table.row.start(a)
a<-table.element(a,i+K,header=TRUE)
a<-table.element(a,x[i+K])
a<-table.element(a,fit$fitted[i,'xhat'])
a<-table.element(a,myresid[i])
a<-table.row.end(a)
}
a<-table.end(a)
table.save(a,file='mytable1.tab')
a<-table.start()
a<-table.row.start(a)
a<-table.element(a,'Extrapolation Forecasts of Exponential Smoothing',4,TRUE)
a<-table.row.end(a)
a<-table.row.start(a)
a<-table.element(a,'t',header=TRUE)
a<-table.element(a,'Forecast',header=TRUE)
a<-table.element(a,'95% Lower Bound',header=TRUE)
a<-table.element(a,'95% Upper Bound',header=TRUE)
a<-table.row.end(a)
for (i in 1:np) {
a<-table.row.start(a)
a<-table.element(a,nx+i,header=TRUE)
a<-table.element(a,p[i,'fit'])
a<-table.element(a,p[i,'lwr'])
a<-table.element(a,p[i,'upr'])
a<-table.row.end(a)
}
a<-table.end(a)
table.save(a,file='mytable2.tab')