Free Statistics

of Irreproducible Research!

Author's title

Author*Unverified author*
R Software Modulerwasp_centraltendency.wasp
Title produced by softwareCentral Tendency
Date of computationMon, 26 May 2008 11:11:31 -0600
Cite this page as followsStatistical Computations at FreeStatistics.org, Office for Research Development and Education, URL https://freestatistics.org/blog/index.php?v=date/2008/May/26/t1211821932kui72emgepl5dgn.htm/, Retrieved Tue, 14 May 2024 01:09:55 +0000
Statistical Computations at FreeStatistics.org, Office for Research Development and Education, URL https://freestatistics.org/blog/index.php?pk=13281, Retrieved Tue, 14 May 2024 01:09:55 +0000
QR Codes:

Original text written by user:
IsPrivate?No (this computation is public)
User-defined keywordsCentrummaten Goudkoers KDG Stijn Cappaert
Estimated Impact174
Family? (F = Feedback message, R = changed R code, M = changed R Module, P = changed Parameters, D = changed Data)
-       [Central Tendency] [Centrummaten Goud...] [2008-05-26 17:11:31] [f38aed22bcf737d6f431a6f90e40d4b2] [Current]
Feedback Forum

Post a new message
Dataseries X:
10236
10893
10756
10940
10997
10827
10166
10186
10457
10368
10244
10511
10812
10738
10171
9721
9897
9828
9924
10371
10846
10413
10709
10662
10570
10297
10635
10872
10296
10383
10431
10574
10653
10805
10872
10625
10407
10463
10556
10646
10702
11353
11346
11451
11964
12574
13031
13812
14544
14931
14886
16005
17064
15168
16050
15839
15137
14954
15648
15305
15579
16348
15928
16171
15937
15713
15594
15683
16438
17032
17696
17745
19394


Summary of computational transaction
Raw Inputview raw input (R code)
Raw Outputview raw output of R engine
Computing time4 seconds
R Server'George Udny Yule' @ 72.249.76.132

\begin{tabular}{lllllllll}
\hline
Summary of computational transaction \tabularnewline
Raw Input & view raw input (R code)  \tabularnewline
Raw Output & view raw output of R engine  \tabularnewline
Computing time & 4 seconds \tabularnewline
R Server & 'George Udny Yule' @ 72.249.76.132 \tabularnewline
\hline
\end{tabular}
%Source: https://freestatistics.org/blog/index.php?pk=13281&T=0

[TABLE]
[ROW][C]Summary of computational transaction[/C][/ROW]
[ROW][C]Raw Input[/C][C]view raw input (R code) [/C][/ROW]
[ROW][C]Raw Output[/C][C]view raw output of R engine [/C][/ROW]
[ROW][C]Computing time[/C][C]4 seconds[/C][/ROW]
[ROW][C]R Server[/C][C]'George Udny Yule' @ 72.249.76.132[/C][/ROW]
[/TABLE]
Source: https://freestatistics.org/blog/index.php?pk=13281&T=0

Globally Unique Identifier (entire table): ba.freestatistics.org/blog/index.php?pk=13281&T=0

As an alternative you can also use a QR Code:  

The GUIDs for individual cells are displayed in the table below:

Summary of computational transaction
Raw Inputview raw input (R code)
Raw Outputview raw output of R engine
Computing time4 seconds
R Server'George Udny Yule' @ 72.249.76.132


Central Tendency - Ungrouped Data
MeasureValueS.E.Value/S.E.
Arithmetic Mean12558.6301369863312.68412688616640.1639515956572
Geometric Mean12299.7173015987
Harmonic Mean12065.7011738507
Quadratic Mean12835.8376847206
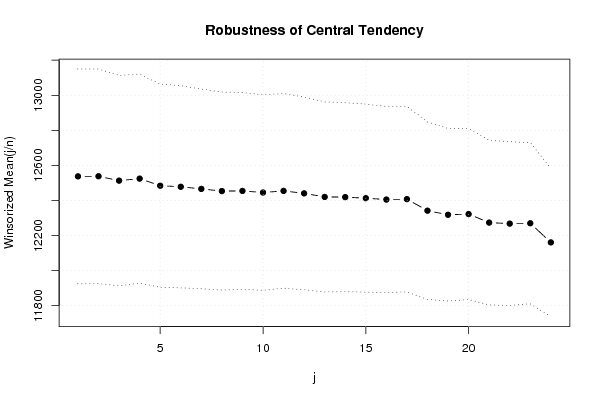
Winsorized Mean ( 1 / 24 )12537.5068493151306.39867566414140.9189328972755
Winsorized Mean ( 2 / 24 )12538.0547945205305.85355704998140.9936536800572
Winsorized Mean ( 3 / 24 )12513.1917808219299.93924527982641.7190880411393
Winsorized Mean ( 4 / 24 )12524.698630137298.04647677069342.0226360862943
Winsorized Mean ( 5 / 24 )12484.3561643836289.87663975332943.0678242131105
Winsorized Mean ( 6 / 24 )12478.1917808219288.35017744338943.2744376697036
Winsorized Mean ( 7 / 24 )12466.0136986301284.70875963556743.7851428055353
Winsorized Mean ( 8 / 24 )12453.6301369863282.24160574454844.1240054035757
Winsorized Mean ( 9 / 24 )12454.4931506849280.57205921511544.3896415969776
Winsorized Mean ( 10 / 24 )12445.3150684932278.92901618836444.6182159122832
Winsorized Mean ( 11 / 24 )12454.6575342466277.56246518092644.8715481977296
Winsorized Mean ( 12 / 24 )12440.5205479452274.98386496846445.2409109508004
Winsorized Mean ( 13 / 24 )12420.2191780822270.94085413768545.8410719107373
Winsorized Mean ( 14 / 24 )12419.0684931507269.49239259853146.0831876306492
Winsorized Mean ( 15 / 24 )12413.1095890411268.15724430240246.2904130050008
Winsorized Mean ( 16 / 24 )12405.2191780822265.77168825229446.6762252204458
Winsorized Mean ( 17 / 24 )12407.7808219178264.567492781946.8983573584618
Winsorized Mean ( 18 / 24 )12341.698630137253.30002986824248.7236366950162
Winsorized Mean ( 19 / 24 )12318.5342465753246.25708009832150.0230663080104
Winsorized Mean ( 20 / 24 )12322.3698630137243.64408560771050.5752882622971
Winsorized Mean ( 21 / 24 )12273.7534246575234.84181322276452.2639186617717
Winsorized Mean ( 22 / 24 )12268.0273972603233.62232834881552.5122212588484
Winsorized Mean ( 23 / 24 )12269.9178082192229.77094738530053.4006494199805
Winsorized Mean ( 24 / 24 )12160.7671232877211.76108842151057.4268257399663
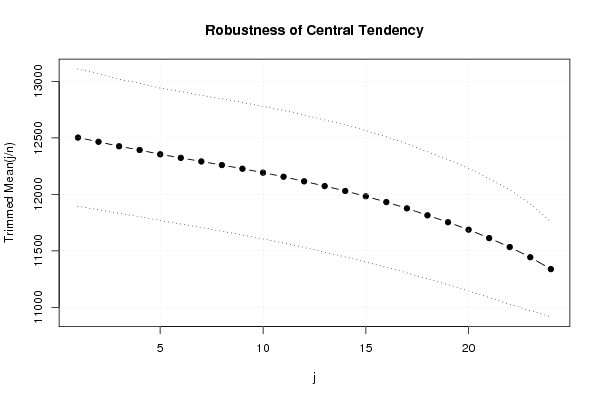
Trimmed Mean ( 1 / 24 )12502.3239436620303.86072525413841.1449157610134
Trimmed Mean ( 2 / 24 )12465.1014492754300.66475805615841.4584719867538
Trimmed Mean ( 3 / 24 )12425.3582089552297.01143228799441.834612604767
Trimmed Mean ( 4 / 24 )12392.4769230769295.09050119908841.99551280953
Trimmed Mean ( 5 / 24 )12354.1746031746293.15076057874542.1427342667803
Trimmed Mean ( 6 / 24 )12323.0163934426292.98177780651942.06069225773
Trimmed Mean ( 7 / 24 )12291.0169491525292.78311089314841.9799383634467
Trimmed Mean ( 8 / 24 )12259292.98648039497641.841521095013
Trimmed Mean ( 9 / 24 )12226.7090909091293.31236457735341.6849426328383
Trimmed Mean ( 10 / 24 )12191.8490566038293.52466114899441.5360297457772
Trimmed Mean ( 11 / 24 )12155.5686274510293.56777652802741.4063449715521
Trimmed Mean ( 12 / 24 )12115.0612244898293.24680726808941.3135315516465
Trimmed Mean ( 13 / 24 )12072.9361702128292.73052366621741.242491623384
Trimmed Mean ( 14 / 24 )12029.6292.21707961062441.1666560217128
Trimmed Mean ( 15 / 24 )11982.3720930233291.06075717423541.1679410489898
Trimmed Mean ( 16 / 24 )11931.2439024390289.01727895954641.2821127698356
Trimmed Mean ( 17 / 24 )11875.7948717949285.97961994213841.5267174430041
Trimmed Mean ( 18 / 24 )11814.0540540541281.21445106253942.0108355364239
Trimmed Mean ( 19 / 24 )11752.9142857143276.82741148647142.4557460643259
Trimmed Mean ( 20 / 24 )11687.0606060606271.50934027195643.0447828953299
Trimmed Mean ( 21 / 24 )11612.2580645161263.33398788978944.0970729132622
Trimmed Mean ( 22 / 24 )11532.9655172414253.19335123625045.5500330515401
Trimmed Mean ( 23 / 24 )11442.6296296296236.81225898614348.3194142001711
Trimmed Mean ( 24 / 24 )11337.6210.42454704715453.8796455028574
Median10872
Midrange14557.5
Midmean - Weighted Average at Xnp11717.0833333333
Midmean - Weighted Average at X(n+1)p11814.0540540541
Midmean - Empirical Distribution Function11814.0540540541
Midmean - Empirical Distribution Function - Averaging11814.0540540541
Midmean - Empirical Distribution Function - Interpolation11814.0540540541
Midmean - Closest Observation11778.3421052632
Midmean - True Basic - Statistics Graphics Toolkit11814.0540540541
Midmean - MS Excel (old versions)11814.0540540541
Number of observations73

\begin{tabular}{lllllllll}
\hline
Central Tendency - Ungrouped Data \tabularnewline
Measure & Value & S.E. & Value/S.E. \tabularnewline
Arithmetic Mean & 12558.6301369863 & 312.684126886166 & 40.1639515956572 \tabularnewline
Geometric Mean & 12299.7173015987 &  &  \tabularnewline
Harmonic Mean & 12065.7011738507 &  &  \tabularnewline
Quadratic Mean & 12835.8376847206 &  &  \tabularnewline
Winsorized Mean ( 1 / 24 ) & 12537.5068493151 & 306.398675664141 & 40.9189328972755 \tabularnewline
Winsorized Mean ( 2 / 24 ) & 12538.0547945205 & 305.853557049981 & 40.9936536800572 \tabularnewline
Winsorized Mean ( 3 / 24 ) & 12513.1917808219 & 299.939245279826 & 41.7190880411393 \tabularnewline
Winsorized Mean ( 4 / 24 ) & 12524.698630137 & 298.046476770693 & 42.0226360862943 \tabularnewline
Winsorized Mean ( 5 / 24 ) & 12484.3561643836 & 289.876639753329 & 43.0678242131105 \tabularnewline
Winsorized Mean ( 6 / 24 ) & 12478.1917808219 & 288.350177443389 & 43.2744376697036 \tabularnewline
Winsorized Mean ( 7 / 24 ) & 12466.0136986301 & 284.708759635567 & 43.7851428055353 \tabularnewline
Winsorized Mean ( 8 / 24 ) & 12453.6301369863 & 282.241605744548 & 44.1240054035757 \tabularnewline
Winsorized Mean ( 9 / 24 ) & 12454.4931506849 & 280.572059215115 & 44.3896415969776 \tabularnewline
Winsorized Mean ( 10 / 24 ) & 12445.3150684932 & 278.929016188364 & 44.6182159122832 \tabularnewline
Winsorized Mean ( 11 / 24 ) & 12454.6575342466 & 277.562465180926 & 44.8715481977296 \tabularnewline
Winsorized Mean ( 12 / 24 ) & 12440.5205479452 & 274.983864968464 & 45.2409109508004 \tabularnewline
Winsorized Mean ( 13 / 24 ) & 12420.2191780822 & 270.940854137685 & 45.8410719107373 \tabularnewline
Winsorized Mean ( 14 / 24 ) & 12419.0684931507 & 269.492392598531 & 46.0831876306492 \tabularnewline
Winsorized Mean ( 15 / 24 ) & 12413.1095890411 & 268.157244302402 & 46.2904130050008 \tabularnewline
Winsorized Mean ( 16 / 24 ) & 12405.2191780822 & 265.771688252294 & 46.6762252204458 \tabularnewline
Winsorized Mean ( 17 / 24 ) & 12407.7808219178 & 264.5674927819 & 46.8983573584618 \tabularnewline
Winsorized Mean ( 18 / 24 ) & 12341.698630137 & 253.300029868242 & 48.7236366950162 \tabularnewline
Winsorized Mean ( 19 / 24 ) & 12318.5342465753 & 246.257080098321 & 50.0230663080104 \tabularnewline
Winsorized Mean ( 20 / 24 ) & 12322.3698630137 & 243.644085607710 & 50.5752882622971 \tabularnewline
Winsorized Mean ( 21 / 24 ) & 12273.7534246575 & 234.841813222764 & 52.2639186617717 \tabularnewline
Winsorized Mean ( 22 / 24 ) & 12268.0273972603 & 233.622328348815 & 52.5122212588484 \tabularnewline
Winsorized Mean ( 23 / 24 ) & 12269.9178082192 & 229.770947385300 & 53.4006494199805 \tabularnewline
Winsorized Mean ( 24 / 24 ) & 12160.7671232877 & 211.761088421510 & 57.4268257399663 \tabularnewline
Trimmed Mean ( 1 / 24 ) & 12502.3239436620 & 303.860725254138 & 41.1449157610134 \tabularnewline
Trimmed Mean ( 2 / 24 ) & 12465.1014492754 & 300.664758056158 & 41.4584719867538 \tabularnewline
Trimmed Mean ( 3 / 24 ) & 12425.3582089552 & 297.011432287994 & 41.834612604767 \tabularnewline
Trimmed Mean ( 4 / 24 ) & 12392.4769230769 & 295.090501199088 & 41.99551280953 \tabularnewline
Trimmed Mean ( 5 / 24 ) & 12354.1746031746 & 293.150760578745 & 42.1427342667803 \tabularnewline
Trimmed Mean ( 6 / 24 ) & 12323.0163934426 & 292.981777806519 & 42.06069225773 \tabularnewline
Trimmed Mean ( 7 / 24 ) & 12291.0169491525 & 292.783110893148 & 41.9799383634467 \tabularnewline
Trimmed Mean ( 8 / 24 ) & 12259 & 292.986480394976 & 41.841521095013 \tabularnewline
Trimmed Mean ( 9 / 24 ) & 12226.7090909091 & 293.312364577353 & 41.6849426328383 \tabularnewline
Trimmed Mean ( 10 / 24 ) & 12191.8490566038 & 293.524661148994 & 41.5360297457772 \tabularnewline
Trimmed Mean ( 11 / 24 ) & 12155.5686274510 & 293.567776528027 & 41.4063449715521 \tabularnewline
Trimmed Mean ( 12 / 24 ) & 12115.0612244898 & 293.246807268089 & 41.3135315516465 \tabularnewline
Trimmed Mean ( 13 / 24 ) & 12072.9361702128 & 292.730523666217 & 41.242491623384 \tabularnewline
Trimmed Mean ( 14 / 24 ) & 12029.6 & 292.217079610624 & 41.1666560217128 \tabularnewline
Trimmed Mean ( 15 / 24 ) & 11982.3720930233 & 291.060757174235 & 41.1679410489898 \tabularnewline
Trimmed Mean ( 16 / 24 ) & 11931.2439024390 & 289.017278959546 & 41.2821127698356 \tabularnewline
Trimmed Mean ( 17 / 24 ) & 11875.7948717949 & 285.979619942138 & 41.5267174430041 \tabularnewline
Trimmed Mean ( 18 / 24 ) & 11814.0540540541 & 281.214451062539 & 42.0108355364239 \tabularnewline
Trimmed Mean ( 19 / 24 ) & 11752.9142857143 & 276.827411486471 & 42.4557460643259 \tabularnewline
Trimmed Mean ( 20 / 24 ) & 11687.0606060606 & 271.509340271956 & 43.0447828953299 \tabularnewline
Trimmed Mean ( 21 / 24 ) & 11612.2580645161 & 263.333987889789 & 44.0970729132622 \tabularnewline
Trimmed Mean ( 22 / 24 ) & 11532.9655172414 & 253.193351236250 & 45.5500330515401 \tabularnewline
Trimmed Mean ( 23 / 24 ) & 11442.6296296296 & 236.812258986143 & 48.3194142001711 \tabularnewline
Trimmed Mean ( 24 / 24 ) & 11337.6 & 210.424547047154 & 53.8796455028574 \tabularnewline
Median & 10872 &  &  \tabularnewline
Midrange & 14557.5 &  &  \tabularnewline
Midmean - Weighted Average at Xnp & 11717.0833333333 &  &  \tabularnewline
Midmean - Weighted Average at X(n+1)p & 11814.0540540541 &  &  \tabularnewline
Midmean - Empirical Distribution Function & 11814.0540540541 &  &  \tabularnewline
Midmean - Empirical Distribution Function - Averaging & 11814.0540540541 &  &  \tabularnewline
Midmean - Empirical Distribution Function - Interpolation & 11814.0540540541 &  &  \tabularnewline
Midmean - Closest Observation & 11778.3421052632 &  &  \tabularnewline
Midmean - True Basic - Statistics Graphics Toolkit & 11814.0540540541 &  &  \tabularnewline
Midmean - MS Excel (old versions) & 11814.0540540541 &  &  \tabularnewline
Number of observations & 73 &  &  \tabularnewline
\hline
\end{tabular}
%Source: https://freestatistics.org/blog/index.php?pk=13281&T=1

[TABLE]
[ROW][C]Central Tendency - Ungrouped Data[/C][/ROW]
[ROW][C]Measure[/C][C]Value[/C][C]S.E.[/C][C]Value/S.E.[/C][/ROW]
[ROW][C]Arithmetic Mean[/C][C]12558.6301369863[/C][C]312.684126886166[/C][C]40.1639515956572[/C][/ROW]
[ROW][C]Geometric Mean[/C][C]12299.7173015987[/C][C][/C][C][/C][/ROW]
[ROW][C]Harmonic Mean[/C][C]12065.7011738507[/C][C][/C][C][/C][/ROW]
[ROW][C]Quadratic Mean[/C][C]12835.8376847206[/C][C][/C][C][/C][/ROW]
[ROW][C]Winsorized Mean ( 1 / 24 )[/C][C]12537.5068493151[/C][C]306.398675664141[/C][C]40.9189328972755[/C][/ROW]
[ROW][C]Winsorized Mean ( 2 / 24 )[/C][C]12538.0547945205[/C][C]305.853557049981[/C][C]40.9936536800572[/C][/ROW]
[ROW][C]Winsorized Mean ( 3 / 24 )[/C][C]12513.1917808219[/C][C]299.939245279826[/C][C]41.7190880411393[/C][/ROW]
[ROW][C]Winsorized Mean ( 4 / 24 )[/C][C]12524.698630137[/C][C]298.046476770693[/C][C]42.0226360862943[/C][/ROW]
[ROW][C]Winsorized Mean ( 5 / 24 )[/C][C]12484.3561643836[/C][C]289.876639753329[/C][C]43.0678242131105[/C][/ROW]
[ROW][C]Winsorized Mean ( 6 / 24 )[/C][C]12478.1917808219[/C][C]288.350177443389[/C][C]43.2744376697036[/C][/ROW]
[ROW][C]Winsorized Mean ( 7 / 24 )[/C][C]12466.0136986301[/C][C]284.708759635567[/C][C]43.7851428055353[/C][/ROW]
[ROW][C]Winsorized Mean ( 8 / 24 )[/C][C]12453.6301369863[/C][C]282.241605744548[/C][C]44.1240054035757[/C][/ROW]
[ROW][C]Winsorized Mean ( 9 / 24 )[/C][C]12454.4931506849[/C][C]280.572059215115[/C][C]44.3896415969776[/C][/ROW]
[ROW][C]Winsorized Mean ( 10 / 24 )[/C][C]12445.3150684932[/C][C]278.929016188364[/C][C]44.6182159122832[/C][/ROW]
[ROW][C]Winsorized Mean ( 11 / 24 )[/C][C]12454.6575342466[/C][C]277.562465180926[/C][C]44.8715481977296[/C][/ROW]
[ROW][C]Winsorized Mean ( 12 / 24 )[/C][C]12440.5205479452[/C][C]274.983864968464[/C][C]45.2409109508004[/C][/ROW]
[ROW][C]Winsorized Mean ( 13 / 24 )[/C][C]12420.2191780822[/C][C]270.940854137685[/C][C]45.8410719107373[/C][/ROW]
[ROW][C]Winsorized Mean ( 14 / 24 )[/C][C]12419.0684931507[/C][C]269.492392598531[/C][C]46.0831876306492[/C][/ROW]
[ROW][C]Winsorized Mean ( 15 / 24 )[/C][C]12413.1095890411[/C][C]268.157244302402[/C][C]46.2904130050008[/C][/ROW]
[ROW][C]Winsorized Mean ( 16 / 24 )[/C][C]12405.2191780822[/C][C]265.771688252294[/C][C]46.6762252204458[/C][/ROW]
[ROW][C]Winsorized Mean ( 17 / 24 )[/C][C]12407.7808219178[/C][C]264.5674927819[/C][C]46.8983573584618[/C][/ROW]
[ROW][C]Winsorized Mean ( 18 / 24 )[/C][C]12341.698630137[/C][C]253.300029868242[/C][C]48.7236366950162[/C][/ROW]
[ROW][C]Winsorized Mean ( 19 / 24 )[/C][C]12318.5342465753[/C][C]246.257080098321[/C][C]50.0230663080104[/C][/ROW]
[ROW][C]Winsorized Mean ( 20 / 24 )[/C][C]12322.3698630137[/C][C]243.644085607710[/C][C]50.5752882622971[/C][/ROW]
[ROW][C]Winsorized Mean ( 21 / 24 )[/C][C]12273.7534246575[/C][C]234.841813222764[/C][C]52.2639186617717[/C][/ROW]
[ROW][C]Winsorized Mean ( 22 / 24 )[/C][C]12268.0273972603[/C][C]233.622328348815[/C][C]52.5122212588484[/C][/ROW]
[ROW][C]Winsorized Mean ( 23 / 24 )[/C][C]12269.9178082192[/C][C]229.770947385300[/C][C]53.4006494199805[/C][/ROW]
[ROW][C]Winsorized Mean ( 24 / 24 )[/C][C]12160.7671232877[/C][C]211.761088421510[/C][C]57.4268257399663[/C][/ROW]
[ROW][C]Trimmed Mean ( 1 / 24 )[/C][C]12502.3239436620[/C][C]303.860725254138[/C][C]41.1449157610134[/C][/ROW]
[ROW][C]Trimmed Mean ( 2 / 24 )[/C][C]12465.1014492754[/C][C]300.664758056158[/C][C]41.4584719867538[/C][/ROW]
[ROW][C]Trimmed Mean ( 3 / 24 )[/C][C]12425.3582089552[/C][C]297.011432287994[/C][C]41.834612604767[/C][/ROW]
[ROW][C]Trimmed Mean ( 4 / 24 )[/C][C]12392.4769230769[/C][C]295.090501199088[/C][C]41.99551280953[/C][/ROW]
[ROW][C]Trimmed Mean ( 5 / 24 )[/C][C]12354.1746031746[/C][C]293.150760578745[/C][C]42.1427342667803[/C][/ROW]
[ROW][C]Trimmed Mean ( 6 / 24 )[/C][C]12323.0163934426[/C][C]292.981777806519[/C][C]42.06069225773[/C][/ROW]
[ROW][C]Trimmed Mean ( 7 / 24 )[/C][C]12291.0169491525[/C][C]292.783110893148[/C][C]41.9799383634467[/C][/ROW]
[ROW][C]Trimmed Mean ( 8 / 24 )[/C][C]12259[/C][C]292.986480394976[/C][C]41.841521095013[/C][/ROW]
[ROW][C]Trimmed Mean ( 9 / 24 )[/C][C]12226.7090909091[/C][C]293.312364577353[/C][C]41.6849426328383[/C][/ROW]
[ROW][C]Trimmed Mean ( 10 / 24 )[/C][C]12191.8490566038[/C][C]293.524661148994[/C][C]41.5360297457772[/C][/ROW]
[ROW][C]Trimmed Mean ( 11 / 24 )[/C][C]12155.5686274510[/C][C]293.567776528027[/C][C]41.4063449715521[/C][/ROW]
[ROW][C]Trimmed Mean ( 12 / 24 )[/C][C]12115.0612244898[/C][C]293.246807268089[/C][C]41.3135315516465[/C][/ROW]
[ROW][C]Trimmed Mean ( 13 / 24 )[/C][C]12072.9361702128[/C][C]292.730523666217[/C][C]41.242491623384[/C][/ROW]
[ROW][C]Trimmed Mean ( 14 / 24 )[/C][C]12029.6[/C][C]292.217079610624[/C][C]41.1666560217128[/C][/ROW]
[ROW][C]Trimmed Mean ( 15 / 24 )[/C][C]11982.3720930233[/C][C]291.060757174235[/C][C]41.1679410489898[/C][/ROW]
[ROW][C]Trimmed Mean ( 16 / 24 )[/C][C]11931.2439024390[/C][C]289.017278959546[/C][C]41.2821127698356[/C][/ROW]
[ROW][C]Trimmed Mean ( 17 / 24 )[/C][C]11875.7948717949[/C][C]285.979619942138[/C][C]41.5267174430041[/C][/ROW]
[ROW][C]Trimmed Mean ( 18 / 24 )[/C][C]11814.0540540541[/C][C]281.214451062539[/C][C]42.0108355364239[/C][/ROW]
[ROW][C]Trimmed Mean ( 19 / 24 )[/C][C]11752.9142857143[/C][C]276.827411486471[/C][C]42.4557460643259[/C][/ROW]
[ROW][C]Trimmed Mean ( 20 / 24 )[/C][C]11687.0606060606[/C][C]271.509340271956[/C][C]43.0447828953299[/C][/ROW]
[ROW][C]Trimmed Mean ( 21 / 24 )[/C][C]11612.2580645161[/C][C]263.333987889789[/C][C]44.0970729132622[/C][/ROW]
[ROW][C]Trimmed Mean ( 22 / 24 )[/C][C]11532.9655172414[/C][C]253.193351236250[/C][C]45.5500330515401[/C][/ROW]
[ROW][C]Trimmed Mean ( 23 / 24 )[/C][C]11442.6296296296[/C][C]236.812258986143[/C][C]48.3194142001711[/C][/ROW]
[ROW][C]Trimmed Mean ( 24 / 24 )[/C][C]11337.6[/C][C]210.424547047154[/C][C]53.8796455028574[/C][/ROW]
[ROW][C]Median[/C][C]10872[/C][C][/C][C][/C][/ROW]
[ROW][C]Midrange[/C][C]14557.5[/C][C][/C][C][/C][/ROW]
[ROW][C]Midmean - Weighted Average at Xnp[/C][C]11717.0833333333[/C][C][/C][C][/C][/ROW]
[ROW][C]Midmean - Weighted Average at X(n+1)p[/C][C]11814.0540540541[/C][C][/C][C][/C][/ROW]
[ROW][C]Midmean - Empirical Distribution Function[/C][C]11814.0540540541[/C][C][/C][C][/C][/ROW]
[ROW][C]Midmean - Empirical Distribution Function - Averaging[/C][C]11814.0540540541[/C][C][/C][C][/C][/ROW]
[ROW][C]Midmean - Empirical Distribution Function - Interpolation[/C][C]11814.0540540541[/C][C][/C][C][/C][/ROW]
[ROW][C]Midmean - Closest Observation[/C][C]11778.3421052632[/C][C][/C][C][/C][/ROW]
[ROW][C]Midmean - True Basic - Statistics Graphics Toolkit[/C][C]11814.0540540541[/C][C][/C][C][/C][/ROW]
[ROW][C]Midmean - MS Excel (old versions)[/C][C]11814.0540540541[/C][C][/C][C][/C][/ROW]
[ROW][C]Number of observations[/C][C]73[/C][C][/C][C][/C][/ROW]
[/TABLE]
Source: https://freestatistics.org/blog/index.php?pk=13281&T=1

Globally Unique Identifier (entire table): ba.freestatistics.org/blog/index.php?pk=13281&T=1

As an alternative you can also use a QR Code:  

The GUIDs for individual cells are displayed in the table below:

Central Tendency - Ungrouped Data
MeasureValueS.E.Value/S.E.
Arithmetic Mean12558.6301369863312.68412688616640.1639515956572
Geometric Mean12299.7173015987
Harmonic Mean12065.7011738507
Quadratic Mean12835.8376847206
Winsorized Mean ( 1 / 24 )12537.5068493151306.39867566414140.9189328972755
Winsorized Mean ( 2 / 24 )12538.0547945205305.85355704998140.9936536800572
Winsorized Mean ( 3 / 24 )12513.1917808219299.93924527982641.7190880411393
Winsorized Mean ( 4 / 24 )12524.698630137298.04647677069342.0226360862943
Winsorized Mean ( 5 / 24 )12484.3561643836289.87663975332943.0678242131105
Winsorized Mean ( 6 / 24 )12478.1917808219288.35017744338943.2744376697036
Winsorized Mean ( 7 / 24 )12466.0136986301284.70875963556743.7851428055353
Winsorized Mean ( 8 / 24 )12453.6301369863282.24160574454844.1240054035757
Winsorized Mean ( 9 / 24 )12454.4931506849280.57205921511544.3896415969776
Winsorized Mean ( 10 / 24 )12445.3150684932278.92901618836444.6182159122832
Winsorized Mean ( 11 / 24 )12454.6575342466277.56246518092644.8715481977296
Winsorized Mean ( 12 / 24 )12440.5205479452274.98386496846445.2409109508004
Winsorized Mean ( 13 / 24 )12420.2191780822270.94085413768545.8410719107373
Winsorized Mean ( 14 / 24 )12419.0684931507269.49239259853146.0831876306492
Winsorized Mean ( 15 / 24 )12413.1095890411268.15724430240246.2904130050008
Winsorized Mean ( 16 / 24 )12405.2191780822265.77168825229446.6762252204458
Winsorized Mean ( 17 / 24 )12407.7808219178264.567492781946.8983573584618
Winsorized Mean ( 18 / 24 )12341.698630137253.30002986824248.7236366950162
Winsorized Mean ( 19 / 24 )12318.5342465753246.25708009832150.0230663080104
Winsorized Mean ( 20 / 24 )12322.3698630137243.64408560771050.5752882622971
Winsorized Mean ( 21 / 24 )12273.7534246575234.84181322276452.2639186617717
Winsorized Mean ( 22 / 24 )12268.0273972603233.62232834881552.5122212588484
Winsorized Mean ( 23 / 24 )12269.9178082192229.77094738530053.4006494199805
Winsorized Mean ( 24 / 24 )12160.7671232877211.76108842151057.4268257399663
Trimmed Mean ( 1 / 24 )12502.3239436620303.86072525413841.1449157610134
Trimmed Mean ( 2 / 24 )12465.1014492754300.66475805615841.4584719867538
Trimmed Mean ( 3 / 24 )12425.3582089552297.01143228799441.834612604767
Trimmed Mean ( 4 / 24 )12392.4769230769295.09050119908841.99551280953
Trimmed Mean ( 5 / 24 )12354.1746031746293.15076057874542.1427342667803
Trimmed Mean ( 6 / 24 )12323.0163934426292.98177780651942.06069225773
Trimmed Mean ( 7 / 24 )12291.0169491525292.78311089314841.9799383634467
Trimmed Mean ( 8 / 24 )12259292.98648039497641.841521095013
Trimmed Mean ( 9 / 24 )12226.7090909091293.31236457735341.6849426328383
Trimmed Mean ( 10 / 24 )12191.8490566038293.52466114899441.5360297457772
Trimmed Mean ( 11 / 24 )12155.5686274510293.56777652802741.4063449715521
Trimmed Mean ( 12 / 24 )12115.0612244898293.24680726808941.3135315516465
Trimmed Mean ( 13 / 24 )12072.9361702128292.73052366621741.242491623384
Trimmed Mean ( 14 / 24 )12029.6292.21707961062441.1666560217128
Trimmed Mean ( 15 / 24 )11982.3720930233291.06075717423541.1679410489898
Trimmed Mean ( 16 / 24 )11931.2439024390289.01727895954641.2821127698356
Trimmed Mean ( 17 / 24 )11875.7948717949285.97961994213841.5267174430041
Trimmed Mean ( 18 / 24 )11814.0540540541281.21445106253942.0108355364239
Trimmed Mean ( 19 / 24 )11752.9142857143276.82741148647142.4557460643259
Trimmed Mean ( 20 / 24 )11687.0606060606271.50934027195643.0447828953299
Trimmed Mean ( 21 / 24 )11612.2580645161263.33398788978944.0970729132622
Trimmed Mean ( 22 / 24 )11532.9655172414253.19335123625045.5500330515401
Trimmed Mean ( 23 / 24 )11442.6296296296236.81225898614348.3194142001711
Trimmed Mean ( 24 / 24 )11337.6210.42454704715453.8796455028574
Median10872
Midrange14557.5
Midmean - Weighted Average at Xnp11717.0833333333
Midmean - Weighted Average at X(n+1)p11814.0540540541
Midmean - Empirical Distribution Function11814.0540540541
Midmean - Empirical Distribution Function - Averaging11814.0540540541
Midmean - Empirical Distribution Function - Interpolation11814.0540540541
Midmean - Closest Observation11778.3421052632
Midmean - True Basic - Statistics Graphics Toolkit11814.0540540541
Midmean - MS Excel (old versions)11814.0540540541
Number of observations73


Parameters (Session):
par1 = 0.01 ; par2 = 0.99 ; par3 = 0.01 ;
Parameters (R input):
R code (references can be found in the software module):
geomean <- function(x) {
return(exp(mean(log(x))))
}
harmean <- function(x) {
return(1/mean(1/x))
}
quamean <- function(x) {
return(sqrt(mean(x*x)))
}
winmean <- function(x) {
x <-sort(x[!is.na(x)])
n<-length(x)
denom <- 3
nodenom <- n/denom
if (nodenom>40) denom <- n/40
sqrtn = sqrt(n)
roundnodenom = floor(nodenom)
win <- array(NA,dim=c(roundnodenom,2))
for (j in 1:roundnodenom) {
win[j,1] <- (j*x[j+1]+sum(x[(j+1):(n-j)])+j*x[n-j])/n
win[j,2] <- sd(c(rep(x[j+1],j),x[(j+1):(n-j)],rep(x[n-j],j)))/sqrtn
}
return(win)
}
trimean <- function(x) {
x <-sort(x[!is.na(x)])
n<-length(x)
denom <- 3
nodenom <- n/denom
if (nodenom>40) denom <- n/40
sqrtn = sqrt(n)
roundnodenom = floor(nodenom)
tri <- array(NA,dim=c(roundnodenom,2))
for (j in 1:roundnodenom) {
tri[j,1] <- mean(x,trim=j/n)
tri[j,2] <- sd(x[(j+1):(n-j)]) / sqrt(n-j*2)
}
return(tri)
}
midrange <- function(x) {
return((max(x)+min(x))/2)
}
q1 <- function(data,n,p,i,f) {
np <- n*p;
i <<- floor(np)
f <<- np - i
qvalue <- (1-f)*data[i] + f*data[i+1]
}
q2 <- function(data,n,p,i,f) {
np <- (n+1)*p
i <<- floor(np)
f <<- np - i
qvalue <- (1-f)*data[i] + f*data[i+1]
}
q3 <- function(data,n,p,i,f) {
np <- n*p
i <<- floor(np)
f <<- np - i
if (f==0) {
qvalue <- data[i]
} else {
qvalue <- data[i+1]
}
}
q4 <- function(data,n,p,i,f) {
np <- n*p
i <<- floor(np)
f <<- np - i
if (f==0) {
qvalue <- (data[i]+data[i+1])/2
} else {
qvalue <- data[i+1]
}
}
q5 <- function(data,n,p,i,f) {
np <- (n-1)*p
i <<- floor(np)
f <<- np - i
if (f==0) {
qvalue <- data[i+1]
} else {
qvalue <- data[i+1] + f*(data[i+2]-data[i+1])
}
}
q6 <- function(data,n,p,i,f) {
np <- n*p+0.5
i <<- floor(np)
f <<- np - i
qvalue <- data[i]
}
q7 <- function(data,n,p,i,f) {
np <- (n+1)*p
i <<- floor(np)
f <<- np - i
if (f==0) {
qvalue <- data[i]
} else {
qvalue <- f*data[i] + (1-f)*data[i+1]
}
}
q8 <- function(data,n,p,i,f) {
np <- (n+1)*p
i <<- floor(np)
f <<- np - i
if (f==0) {
qvalue <- data[i]
} else {
if (f == 0.5) {
qvalue <- (data[i]+data[i+1])/2
} else {
if (f < 0.5) {
qvalue <- data[i]
} else {
qvalue <- data[i+1]
}
}
}
}
midmean <- function(x,def) {
x <-sort(x[!is.na(x)])
n<-length(x)
if (def==1) {
qvalue1 <- q1(x,n,0.25,i,f)
qvalue3 <- q1(x,n,0.75,i,f)
}
if (def==2) {
qvalue1 <- q2(x,n,0.25,i,f)
qvalue3 <- q2(x,n,0.75,i,f)
}
if (def==3) {
qvalue1 <- q3(x,n,0.25,i,f)
qvalue3 <- q3(x,n,0.75,i,f)
}
if (def==4) {
qvalue1 <- q4(x,n,0.25,i,f)
qvalue3 <- q4(x,n,0.75,i,f)
}
if (def==5) {
qvalue1 <- q5(x,n,0.25,i,f)
qvalue3 <- q5(x,n,0.75,i,f)
}
if (def==6) {
qvalue1 <- q6(x,n,0.25,i,f)
qvalue3 <- q6(x,n,0.75,i,f)
}
if (def==7) {
qvalue1 <- q7(x,n,0.25,i,f)
qvalue3 <- q7(x,n,0.75,i,f)
}
if (def==8) {
qvalue1 <- q8(x,n,0.25,i,f)
qvalue3 <- q8(x,n,0.75,i,f)
}
midm <- 0
myn <- 0
roundno4 <- round(n/4)
round3no4 <- round(3*n/4)
for (i in 1:n) {
if ((x[i]>=qvalue1) & (x[i]<=qvalue3)){
midm = midm + x[i]
myn = myn + 1
}
}
midm = midm / myn
return(midm)
}
(arm <- mean(x))
sqrtn <- sqrt(length(x))
(armse <- sd(x) / sqrtn)
(armose <- arm / armse)
(geo <- geomean(x))
(har <- harmean(x))
(qua <- quamean(x))
(win <- winmean(x))
(tri <- trimean(x))
(midr <- midrange(x))
midm <- array(NA,dim=8)
for (j in 1:8) midm[j] <- midmean(x,j)
midm
bitmap(file='test1.png')
lb <- win[,1] - 2*win[,2]
ub <- win[,1] + 2*win[,2]
if ((ylimmin == '') | (ylimmax == '')) plot(win[,1],type='b',main=main, xlab='j', pch=19, ylab='Winsorized Mean(j/n)', ylim=c(min(lb),max(ub))) else plot(win[,1],type='l',main=main, xlab='j', pch=19, ylab='Winsorized Mean(j/n)', ylim=c(ylimmin,ylimmax))
lines(ub,lty=3)
lines(lb,lty=3)
grid()
dev.off()
bitmap(file='test2.png')
lb <- tri[,1] - 2*tri[,2]
ub <- tri[,1] + 2*tri[,2]
if ((ylimmin == '') | (ylimmax == '')) plot(tri[,1],type='b',main=main, xlab='j', pch=19, ylab='Trimmed Mean(j/n)', ylim=c(min(lb),max(ub))) else plot(tri[,1],type='l',main=main, xlab='j', pch=19, ylab='Trimmed Mean(j/n)', ylim=c(ylimmin,ylimmax))
lines(ub,lty=3)
lines(lb,lty=3)
grid()
dev.off()
load(file='createtable')
a<-table.start()
a<-table.row.start(a)
a<-table.element(a,'Central Tendency - Ungrouped Data',4,TRUE)
a<-table.row.end(a)
a<-table.row.start(a)
a<-table.element(a,'Measure',header=TRUE)
a<-table.element(a,'Value',header=TRUE)
a<-table.element(a,'S.E.',header=TRUE)
a<-table.element(a,'Value/S.E.',header=TRUE)
a<-table.row.end(a)
a<-table.row.start(a)
a<-table.element(a,hyperlink('arithmetic_mean.htm', 'Arithmetic Mean', 'click to view the definition of the Arithmetic Mean'),header=TRUE)
a<-table.element(a,arm)
a<-table.element(a,hyperlink('arithmetic_mean_standard_error.htm', armse, 'click to view the definition of the Standard Error of the Arithmetic Mean'))
a<-table.element(a,armose)
a<-table.row.end(a)
a<-table.row.start(a)
a<-table.element(a,hyperlink('geometric_mean.htm', 'Geometric Mean', 'click to view the definition of the Geometric Mean'),header=TRUE)
a<-table.element(a,geo)
a<-table.element(a,'')
a<-table.row.end(a)
a<-table.row.start(a)
a<-table.element(a,hyperlink('harmonic_mean.htm', 'Harmonic Mean', 'click to view the definition of the Harmonic Mean'),header=TRUE)
a<-table.element(a,har)
a<-table.element(a,'')
a<-table.row.end(a)
a<-table.row.start(a)
a<-table.element(a,hyperlink('quadratic_mean.htm', 'Quadratic Mean', 'click to view the definition of the Quadratic Mean'),header=TRUE)
a<-table.element(a,qua)
a<-table.element(a,'')
a<-table.row.end(a)
for (j in 1:length(win[,1])) {
a<-table.row.start(a)
mylabel <- paste('Winsorized Mean (',j)
mylabel <- paste(mylabel,'/')
mylabel <- paste(mylabel,length(win[,1]))
mylabel <- paste(mylabel,')')
a<-table.element(a,hyperlink('winsorized_mean.htm', mylabel, 'click to view the definition of the Winsorized Mean'),header=TRUE)
a<-table.element(a,win[j,1])
a<-table.element(a,win[j,2])
a<-table.element(a,win[j,1]/win[j,2])
a<-table.row.end(a)
}
for (j in 1:length(tri[,1])) {
a<-table.row.start(a)
mylabel <- paste('Trimmed Mean (',j)
mylabel <- paste(mylabel,'/')
mylabel <- paste(mylabel,length(tri[,1]))
mylabel <- paste(mylabel,')')
a<-table.element(a,hyperlink('arithmetic_mean.htm', mylabel, 'click to view the definition of the Trimmed Mean'),header=TRUE)
a<-table.element(a,tri[j,1])
a<-table.element(a,tri[j,2])
a<-table.element(a,tri[j,1]/tri[j,2])
a<-table.row.end(a)
}
a<-table.row.start(a)
a<-table.element(a,hyperlink('median_1.htm', 'Median', 'click to view the definition of the Median'),header=TRUE)
a<-table.element(a,median(x))
a<-table.element(a,'')
a<-table.row.end(a)
a<-table.row.start(a)
a<-table.element(a,hyperlink('midrange.htm', 'Midrange', 'click to view the definition of the Midrange'),header=TRUE)
a<-table.element(a,midr)
a<-table.element(a,'')
a<-table.row.end(a)
a<-table.row.start(a)
mymid <- hyperlink('midmean.htm', 'Midmean', 'click to view the definition of the Midmean')
mylabel <- paste(mymid,hyperlink('method_1.htm','Weighted Average at Xnp',''),sep=' - ')
a<-table.element(a,mylabel,header=TRUE)
a<-table.element(a,midm[1])
a<-table.element(a,'')
a<-table.row.end(a)
a<-table.row.start(a)
mymid <- hyperlink('midmean.htm', 'Midmean', 'click to view the definition of the Midmean')
mylabel <- paste(mymid,hyperlink('method_2.htm','Weighted Average at X(n+1)p',''),sep=' - ')
a<-table.element(a,mylabel,header=TRUE)
a<-table.element(a,midm[2])
a<-table.element(a,'')
a<-table.row.end(a)
a<-table.row.start(a)
mymid <- hyperlink('midmean.htm', 'Midmean', 'click to view the definition of the Midmean')
mylabel <- paste(mymid,hyperlink('method_3.htm','Empirical Distribution Function',''),sep=' - ')
a<-table.element(a,mylabel,header=TRUE)
a<-table.element(a,midm[3])
a<-table.element(a,'')
a<-table.row.end(a)
a<-table.row.start(a)
mymid <- hyperlink('midmean.htm', 'Midmean', 'click to view the definition of the Midmean')
mylabel <- paste(mymid,hyperlink('method_4.htm','Empirical Distribution Function - Averaging',''),sep=' - ')
a<-table.element(a,mylabel,header=TRUE)
a<-table.element(a,midm[4])
a<-table.element(a,'')
a<-table.row.end(a)
a<-table.row.start(a)
mymid <- hyperlink('midmean.htm', 'Midmean', 'click to view the definition of the Midmean')
mylabel <- paste(mymid,hyperlink('method_5.htm','Empirical Distribution Function - Interpolation',''),sep=' - ')
a<-table.element(a,mylabel,header=TRUE)
a<-table.element(a,midm[5])
a<-table.element(a,'')
a<-table.row.end(a)
a<-table.row.start(a)
mymid <- hyperlink('midmean.htm', 'Midmean', 'click to view the definition of the Midmean')
mylabel <- paste(mymid,hyperlink('method_6.htm','Closest Observation',''),sep=' - ')
a<-table.element(a,mylabel,header=TRUE)
a<-table.element(a,midm[6])
a<-table.element(a,'')
a<-table.row.end(a)
a<-table.row.start(a)
mymid <- hyperlink('midmean.htm', 'Midmean', 'click to view the definition of the Midmean')
mylabel <- paste(mymid,hyperlink('method_7.htm','True Basic - Statistics Graphics Toolkit',''),sep=' - ')
a<-table.element(a,mylabel,header=TRUE)
a<-table.element(a,midm[7])
a<-table.element(a,'')
a<-table.row.end(a)
a<-table.row.start(a)
mymid <- hyperlink('midmean.htm', 'Midmean', 'click to view the definition of the Midmean')
mylabel <- paste(mymid,hyperlink('method_8.htm','MS Excel (old versions)',''),sep=' - ')
a<-table.element(a,mylabel,header=TRUE)
a<-table.element(a,midm[8])
a<-table.element(a,'')
a<-table.row.end(a)
a<-table.row.start(a)
a<-table.element(a,'Number of observations',header=TRUE)
a<-table.element(a,length(x))
a<-table.element(a,'')
a<-table.row.end(a)
a<-table.end(a)
table.save(a,file='mytable.tab')