Free Statistics

of Irreproducible Research!

Author's title

Author*Unverified author*
R Software Modulerwasp_exponentialsmoothing.wasp
Title produced by softwareExponential Smoothing
Date of computationWed, 28 May 2008 16:26:58 -0600
Cite this page as followsStatistical Computations at FreeStatistics.org, Office for Research Development and Education, URL https://freestatistics.org/blog/index.php?v=date/2008/May/29/t12120137137q4vz9scdzik5lz.htm/, Retrieved Wed, 15 May 2024 11:32:32 +0000
Statistical Computations at FreeStatistics.org, Office for Research Development and Education, URL https://freestatistics.org/blog/index.php?pk=13486, Retrieved Wed, 15 May 2024 11:32:32 +0000
QR Codes:

Original text written by user:
IsPrivate?No (this computation is public)
User-defined keywords
Estimated Impact223
Family? (F = Feedback message, R = changed R code, M = changed R Module, P = changed Parameters, D = changed Data)
-     [Bootstrap Plot - Central Tendency] [Sophie Volckaerts...] [2008-05-14 17:49:08] [4b92e24c7e9c2a828d526c4c975b3e2c]
- RMPD    [Exponential Smoothing] [Triple exponentia...] [2008-05-28 22:26:58] [2601e7ca60b500bc938791a6f424379d] [Current]
Feedback Forum

Post a new message
Dataseries X:
2,6900
2,7200
2,6800
2,7200
2,7000
2,7200
2,7200
2,7100
2,6800
2,6500
2,6600
2,6900
2,6700
2,6700
2,6500
2,6600
2,7600
2,7900
2,7900
2,7800
2,8100
2,8100
2,7900
2,7900
2,7900
2,8000
2,8000
2,8000
2,7700
2,7800
2,7500
2,7400
2,7400
2,7200
2,7100
2,7100
2,7000
2,6900
2,7000
2,7100
2,7600
2,7600
2,7500
2,7400
2,7100
2,7300
2,7300
2,7300
2,7200
2,7200
2,7500
2,8200
2,8500
2,8300
2,8500
2,8500
2,7900
2,8100
2,8000
2,7900
2,7900
2,8000
2,8000
2,8600
2,8600
2,8500
2,8100
2,7900
2,7800
2,7700
2,7800
2,8500
2,8200


Summary of computational transaction
Raw Inputview raw input (R code)
Raw Outputview raw output of R engine
Computing time3 seconds
R Server'Herman Ole Andreas Wold' @ 193.190.124.10:1001

\begin{tabular}{lllllllll}
\hline
Summary of computational transaction \tabularnewline
Raw Input & view raw input (R code)  \tabularnewline
Raw Output & view raw output of R engine  \tabularnewline
Computing time & 3 seconds \tabularnewline
R Server & 'Herman Ole Andreas Wold' @ 193.190.124.10:1001 \tabularnewline
\hline
\end{tabular}
%Source: https://freestatistics.org/blog/index.php?pk=13486&T=0

[TABLE]
[ROW][C]Summary of computational transaction[/C][/ROW]
[ROW][C]Raw Input[/C][C]view raw input (R code) [/C][/ROW]
[ROW][C]Raw Output[/C][C]view raw output of R engine [/C][/ROW]
[ROW][C]Computing time[/C][C]3 seconds[/C][/ROW]
[ROW][C]R Server[/C][C]'Herman Ole Andreas Wold' @ 193.190.124.10:1001[/C][/ROW]
[/TABLE]
Source: https://freestatistics.org/blog/index.php?pk=13486&T=0

Globally Unique Identifier (entire table): ba.freestatistics.org/blog/index.php?pk=13486&T=0

As an alternative you can also use a QR Code:  

The GUIDs for individual cells are displayed in the table below:

Summary of computational transaction
Raw Inputview raw input (R code)
Raw Outputview raw output of R engine
Computing time3 seconds
R Server'Herman Ole Andreas Wold' @ 193.190.124.10:1001


Estimated Parameters of Exponential Smoothing
ParameterValue
alpha0.700557932823512
beta0
gamma1

\begin{tabular}{lllllllll}
\hline
Estimated Parameters of Exponential Smoothing \tabularnewline
Parameter & Value \tabularnewline
alpha & 0.700557932823512 \tabularnewline
beta & 0 \tabularnewline
gamma & 1 \tabularnewline
\hline
\end{tabular}
%Source: https://freestatistics.org/blog/index.php?pk=13486&T=1

[TABLE]
[ROW][C]Estimated Parameters of Exponential Smoothing[/C][/ROW]
[ROW][C]Parameter[/C][C]Value[/C][/ROW]
[ROW][C]alpha[/C][C]0.700557932823512[/C][/ROW]
[ROW][C]beta[/C][C]0[/C][/ROW]
[ROW][C]gamma[/C][C]1[/C][/ROW]
[/TABLE]
Source: https://freestatistics.org/blog/index.php?pk=13486&T=1

Globally Unique Identifier (entire table): ba.freestatistics.org/blog/index.php?pk=13486&T=1

As an alternative you can also use a QR Code:  

The GUIDs for individual cells are displayed in the table below:

Estimated Parameters of Exponential Smoothing
ParameterValue
alpha0.700557932823512
beta0
gamma1


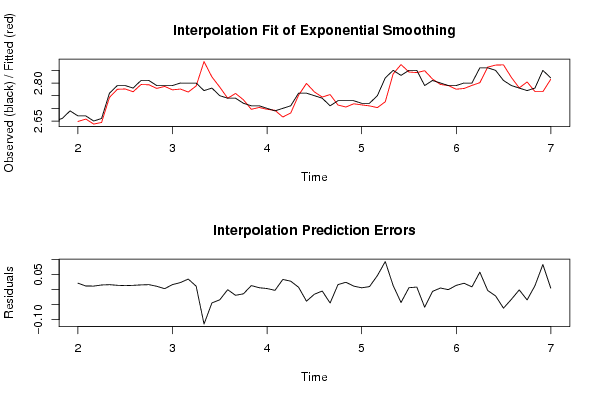
Interpolation Forecasts of Exponential Smoothing
tObservedFittedResiduals
132.672.648239734299520.0217602657004825
142.672.657650727723000.0123492722769951
152.652.637968775047920.0120312249520826
162.662.644314011796350.0156859882036500
172.762.743219621933260.0167803780667408
182.792.775391915570360.0146080844296415
192.792.776459058334230.0135409416657670
202.782.765528605769420.0144713942305801
212.812.793999989130.0160000108699974
222.812.793125590336910.0168744096630915
232.792.77869709188810.0113029081118987
242.792.786615433829870.00338456617013350
252.792.773002457453180.0169975425468185
262.82.776258840064610.0237411599353856
272.82.764462327910010.0355376720899852
282.82.788369582536490.0116304174635080
292.772.88476173678217-0.114761736782168
302.782.82413068226428-0.0441306822642762
312.752.78372836862127-0.0337283686212699
322.742.739961642395193.8357604806194e-05
332.742.75877957957929-0.0187795795792862
342.722.73380189457873-0.0138018945787346
352.712.696214525901840.0137854740981571
362.712.703500964459390.00649903554061337
372.72.696146152093390.00385384790661369
382.692.69221393788909-0.00221393788909374
392.72.665766748041390.0342332519586095
402.712.681601343051230.0283986569487689
412.762.751893492545580.0081065074544231
422.762.79848867019142-0.0384886701914184
432.752.76515380316382-0.0151538031638188
442.742.74451081442063-0.00451081442062851
452.712.75450691104412-0.0445069110441221
462.732.712996268181820.0170037318181819
472.732.705250844157450.0247491558425481
482.732.718036110709960.0119638892900444
492.722.713717664536650.00628233546335499
502.722.709669796233140.0103302037668604
512.752.702924326203750.0470756737962525
522.822.726008658517730.0939913414822695
532.852.836175960305170.0138240396948315
542.832.87282404420348-0.042824044203476
552.852.843439437340010.0065605626599945
562.852.841195578381120.0088044216188834
572.792.84854325538758-0.0585432553875784
582.812.81561821419967-0.00561821419966657
592.82.794344112217610.00565588778239379
602.792.789924991721167.50082788414375e-05
612.792.775576399420420.0144236005795833
622.82.778444061029760.0215559389702356
632.82.790566008353850.00943399164615455
642.862.801328686147620.0586713138523782
652.862.8627467998242-0.00274679982420212
662.852.87082323129981-0.0208232312998087
672.812.87163929721046-0.0616392972104638
682.792.82228939116698-0.0322893911669753
692.782.78068174401399-0.00068174401399057
702.772.80414002736271-0.0341400273627124
712.782.766260683313840.0137393166861632
722.852.765833322965130.084166677034867
732.822.81469238843540.00530761156460136

\begin{tabular}{lllllllll}
\hline
Interpolation Forecasts of Exponential Smoothing \tabularnewline
t & Observed & Fitted & Residuals \tabularnewline
13 & 2.67 & 2.64823973429952 & 0.0217602657004825 \tabularnewline
14 & 2.67 & 2.65765072772300 & 0.0123492722769951 \tabularnewline
15 & 2.65 & 2.63796877504792 & 0.0120312249520826 \tabularnewline
16 & 2.66 & 2.64431401179635 & 0.0156859882036500 \tabularnewline
17 & 2.76 & 2.74321962193326 & 0.0167803780667408 \tabularnewline
18 & 2.79 & 2.77539191557036 & 0.0146080844296415 \tabularnewline
19 & 2.79 & 2.77645905833423 & 0.0135409416657670 \tabularnewline
20 & 2.78 & 2.76552860576942 & 0.0144713942305801 \tabularnewline
21 & 2.81 & 2.79399998913 & 0.0160000108699974 \tabularnewline
22 & 2.81 & 2.79312559033691 & 0.0168744096630915 \tabularnewline
23 & 2.79 & 2.7786970918881 & 0.0113029081118987 \tabularnewline
24 & 2.79 & 2.78661543382987 & 0.00338456617013350 \tabularnewline
25 & 2.79 & 2.77300245745318 & 0.0169975425468185 \tabularnewline
26 & 2.8 & 2.77625884006461 & 0.0237411599353856 \tabularnewline
27 & 2.8 & 2.76446232791001 & 0.0355376720899852 \tabularnewline
28 & 2.8 & 2.78836958253649 & 0.0116304174635080 \tabularnewline
29 & 2.77 & 2.88476173678217 & -0.114761736782168 \tabularnewline
30 & 2.78 & 2.82413068226428 & -0.0441306822642762 \tabularnewline
31 & 2.75 & 2.78372836862127 & -0.0337283686212699 \tabularnewline
32 & 2.74 & 2.73996164239519 & 3.8357604806194e-05 \tabularnewline
33 & 2.74 & 2.75877957957929 & -0.0187795795792862 \tabularnewline
34 & 2.72 & 2.73380189457873 & -0.0138018945787346 \tabularnewline
35 & 2.71 & 2.69621452590184 & 0.0137854740981571 \tabularnewline
36 & 2.71 & 2.70350096445939 & 0.00649903554061337 \tabularnewline
37 & 2.7 & 2.69614615209339 & 0.00385384790661369 \tabularnewline
38 & 2.69 & 2.69221393788909 & -0.00221393788909374 \tabularnewline
39 & 2.7 & 2.66576674804139 & 0.0342332519586095 \tabularnewline
40 & 2.71 & 2.68160134305123 & 0.0283986569487689 \tabularnewline
41 & 2.76 & 2.75189349254558 & 0.0081065074544231 \tabularnewline
42 & 2.76 & 2.79848867019142 & -0.0384886701914184 \tabularnewline
43 & 2.75 & 2.76515380316382 & -0.0151538031638188 \tabularnewline
44 & 2.74 & 2.74451081442063 & -0.00451081442062851 \tabularnewline
45 & 2.71 & 2.75450691104412 & -0.0445069110441221 \tabularnewline
46 & 2.73 & 2.71299626818182 & 0.0170037318181819 \tabularnewline
47 & 2.73 & 2.70525084415745 & 0.0247491558425481 \tabularnewline
48 & 2.73 & 2.71803611070996 & 0.0119638892900444 \tabularnewline
49 & 2.72 & 2.71371766453665 & 0.00628233546335499 \tabularnewline
50 & 2.72 & 2.70966979623314 & 0.0103302037668604 \tabularnewline
51 & 2.75 & 2.70292432620375 & 0.0470756737962525 \tabularnewline
52 & 2.82 & 2.72600865851773 & 0.0939913414822695 \tabularnewline
53 & 2.85 & 2.83617596030517 & 0.0138240396948315 \tabularnewline
54 & 2.83 & 2.87282404420348 & -0.042824044203476 \tabularnewline
55 & 2.85 & 2.84343943734001 & 0.0065605626599945 \tabularnewline
56 & 2.85 & 2.84119557838112 & 0.0088044216188834 \tabularnewline
57 & 2.79 & 2.84854325538758 & -0.0585432553875784 \tabularnewline
58 & 2.81 & 2.81561821419967 & -0.00561821419966657 \tabularnewline
59 & 2.8 & 2.79434411221761 & 0.00565588778239379 \tabularnewline
60 & 2.79 & 2.78992499172116 & 7.50082788414375e-05 \tabularnewline
61 & 2.79 & 2.77557639942042 & 0.0144236005795833 \tabularnewline
62 & 2.8 & 2.77844406102976 & 0.0215559389702356 \tabularnewline
63 & 2.8 & 2.79056600835385 & 0.00943399164615455 \tabularnewline
64 & 2.86 & 2.80132868614762 & 0.0586713138523782 \tabularnewline
65 & 2.86 & 2.8627467998242 & -0.00274679982420212 \tabularnewline
66 & 2.85 & 2.87082323129981 & -0.0208232312998087 \tabularnewline
67 & 2.81 & 2.87163929721046 & -0.0616392972104638 \tabularnewline
68 & 2.79 & 2.82228939116698 & -0.0322893911669753 \tabularnewline
69 & 2.78 & 2.78068174401399 & -0.00068174401399057 \tabularnewline
70 & 2.77 & 2.80414002736271 & -0.0341400273627124 \tabularnewline
71 & 2.78 & 2.76626068331384 & 0.0137393166861632 \tabularnewline
72 & 2.85 & 2.76583332296513 & 0.084166677034867 \tabularnewline
73 & 2.82 & 2.8146923884354 & 0.00530761156460136 \tabularnewline
\hline
\end{tabular}
%Source: https://freestatistics.org/blog/index.php?pk=13486&T=2

[TABLE]
[ROW][C]Interpolation Forecasts of Exponential Smoothing[/C][/ROW]
[ROW][C]t[/C][C]Observed[/C][C]Fitted[/C][C]Residuals[/C][/ROW]
[ROW][C]13[/C][C]2.67[/C][C]2.64823973429952[/C][C]0.0217602657004825[/C][/ROW]
[ROW][C]14[/C][C]2.67[/C][C]2.65765072772300[/C][C]0.0123492722769951[/C][/ROW]
[ROW][C]15[/C][C]2.65[/C][C]2.63796877504792[/C][C]0.0120312249520826[/C][/ROW]
[ROW][C]16[/C][C]2.66[/C][C]2.64431401179635[/C][C]0.0156859882036500[/C][/ROW]
[ROW][C]17[/C][C]2.76[/C][C]2.74321962193326[/C][C]0.0167803780667408[/C][/ROW]
[ROW][C]18[/C][C]2.79[/C][C]2.77539191557036[/C][C]0.0146080844296415[/C][/ROW]
[ROW][C]19[/C][C]2.79[/C][C]2.77645905833423[/C][C]0.0135409416657670[/C][/ROW]
[ROW][C]20[/C][C]2.78[/C][C]2.76552860576942[/C][C]0.0144713942305801[/C][/ROW]
[ROW][C]21[/C][C]2.81[/C][C]2.79399998913[/C][C]0.0160000108699974[/C][/ROW]
[ROW][C]22[/C][C]2.81[/C][C]2.79312559033691[/C][C]0.0168744096630915[/C][/ROW]
[ROW][C]23[/C][C]2.79[/C][C]2.7786970918881[/C][C]0.0113029081118987[/C][/ROW]
[ROW][C]24[/C][C]2.79[/C][C]2.78661543382987[/C][C]0.00338456617013350[/C][/ROW]
[ROW][C]25[/C][C]2.79[/C][C]2.77300245745318[/C][C]0.0169975425468185[/C][/ROW]
[ROW][C]26[/C][C]2.8[/C][C]2.77625884006461[/C][C]0.0237411599353856[/C][/ROW]
[ROW][C]27[/C][C]2.8[/C][C]2.76446232791001[/C][C]0.0355376720899852[/C][/ROW]
[ROW][C]28[/C][C]2.8[/C][C]2.78836958253649[/C][C]0.0116304174635080[/C][/ROW]
[ROW][C]29[/C][C]2.77[/C][C]2.88476173678217[/C][C]-0.114761736782168[/C][/ROW]
[ROW][C]30[/C][C]2.78[/C][C]2.82413068226428[/C][C]-0.0441306822642762[/C][/ROW]
[ROW][C]31[/C][C]2.75[/C][C]2.78372836862127[/C][C]-0.0337283686212699[/C][/ROW]
[ROW][C]32[/C][C]2.74[/C][C]2.73996164239519[/C][C]3.8357604806194e-05[/C][/ROW]
[ROW][C]33[/C][C]2.74[/C][C]2.75877957957929[/C][C]-0.0187795795792862[/C][/ROW]
[ROW][C]34[/C][C]2.72[/C][C]2.73380189457873[/C][C]-0.0138018945787346[/C][/ROW]
[ROW][C]35[/C][C]2.71[/C][C]2.69621452590184[/C][C]0.0137854740981571[/C][/ROW]
[ROW][C]36[/C][C]2.71[/C][C]2.70350096445939[/C][C]0.00649903554061337[/C][/ROW]
[ROW][C]37[/C][C]2.7[/C][C]2.69614615209339[/C][C]0.00385384790661369[/C][/ROW]
[ROW][C]38[/C][C]2.69[/C][C]2.69221393788909[/C][C]-0.00221393788909374[/C][/ROW]
[ROW][C]39[/C][C]2.7[/C][C]2.66576674804139[/C][C]0.0342332519586095[/C][/ROW]
[ROW][C]40[/C][C]2.71[/C][C]2.68160134305123[/C][C]0.0283986569487689[/C][/ROW]
[ROW][C]41[/C][C]2.76[/C][C]2.75189349254558[/C][C]0.0081065074544231[/C][/ROW]
[ROW][C]42[/C][C]2.76[/C][C]2.79848867019142[/C][C]-0.0384886701914184[/C][/ROW]
[ROW][C]43[/C][C]2.75[/C][C]2.76515380316382[/C][C]-0.0151538031638188[/C][/ROW]
[ROW][C]44[/C][C]2.74[/C][C]2.74451081442063[/C][C]-0.00451081442062851[/C][/ROW]
[ROW][C]45[/C][C]2.71[/C][C]2.75450691104412[/C][C]-0.0445069110441221[/C][/ROW]
[ROW][C]46[/C][C]2.73[/C][C]2.71299626818182[/C][C]0.0170037318181819[/C][/ROW]
[ROW][C]47[/C][C]2.73[/C][C]2.70525084415745[/C][C]0.0247491558425481[/C][/ROW]
[ROW][C]48[/C][C]2.73[/C][C]2.71803611070996[/C][C]0.0119638892900444[/C][/ROW]
[ROW][C]49[/C][C]2.72[/C][C]2.71371766453665[/C][C]0.00628233546335499[/C][/ROW]
[ROW][C]50[/C][C]2.72[/C][C]2.70966979623314[/C][C]0.0103302037668604[/C][/ROW]
[ROW][C]51[/C][C]2.75[/C][C]2.70292432620375[/C][C]0.0470756737962525[/C][/ROW]
[ROW][C]52[/C][C]2.82[/C][C]2.72600865851773[/C][C]0.0939913414822695[/C][/ROW]
[ROW][C]53[/C][C]2.85[/C][C]2.83617596030517[/C][C]0.0138240396948315[/C][/ROW]
[ROW][C]54[/C][C]2.83[/C][C]2.87282404420348[/C][C]-0.042824044203476[/C][/ROW]
[ROW][C]55[/C][C]2.85[/C][C]2.84343943734001[/C][C]0.0065605626599945[/C][/ROW]
[ROW][C]56[/C][C]2.85[/C][C]2.84119557838112[/C][C]0.0088044216188834[/C][/ROW]
[ROW][C]57[/C][C]2.79[/C][C]2.84854325538758[/C][C]-0.0585432553875784[/C][/ROW]
[ROW][C]58[/C][C]2.81[/C][C]2.81561821419967[/C][C]-0.00561821419966657[/C][/ROW]
[ROW][C]59[/C][C]2.8[/C][C]2.79434411221761[/C][C]0.00565588778239379[/C][/ROW]
[ROW][C]60[/C][C]2.79[/C][C]2.78992499172116[/C][C]7.50082788414375e-05[/C][/ROW]
[ROW][C]61[/C][C]2.79[/C][C]2.77557639942042[/C][C]0.0144236005795833[/C][/ROW]
[ROW][C]62[/C][C]2.8[/C][C]2.77844406102976[/C][C]0.0215559389702356[/C][/ROW]
[ROW][C]63[/C][C]2.8[/C][C]2.79056600835385[/C][C]0.00943399164615455[/C][/ROW]
[ROW][C]64[/C][C]2.86[/C][C]2.80132868614762[/C][C]0.0586713138523782[/C][/ROW]
[ROW][C]65[/C][C]2.86[/C][C]2.8627467998242[/C][C]-0.00274679982420212[/C][/ROW]
[ROW][C]66[/C][C]2.85[/C][C]2.87082323129981[/C][C]-0.0208232312998087[/C][/ROW]
[ROW][C]67[/C][C]2.81[/C][C]2.87163929721046[/C][C]-0.0616392972104638[/C][/ROW]
[ROW][C]68[/C][C]2.79[/C][C]2.82228939116698[/C][C]-0.0322893911669753[/C][/ROW]
[ROW][C]69[/C][C]2.78[/C][C]2.78068174401399[/C][C]-0.00068174401399057[/C][/ROW]
[ROW][C]70[/C][C]2.77[/C][C]2.80414002736271[/C][C]-0.0341400273627124[/C][/ROW]
[ROW][C]71[/C][C]2.78[/C][C]2.76626068331384[/C][C]0.0137393166861632[/C][/ROW]
[ROW][C]72[/C][C]2.85[/C][C]2.76583332296513[/C][C]0.084166677034867[/C][/ROW]
[ROW][C]73[/C][C]2.82[/C][C]2.8146923884354[/C][C]0.00530761156460136[/C][/ROW]
[/TABLE]
Source: https://freestatistics.org/blog/index.php?pk=13486&T=2

Globally Unique Identifier (entire table): ba.freestatistics.org/blog/index.php?pk=13486&T=2

As an alternative you can also use a QR Code:  

The GUIDs for individual cells are displayed in the table below:

Interpolation Forecasts of Exponential Smoothing
tObservedFittedResiduals
132.672.648239734299520.0217602657004825
142.672.657650727723000.0123492722769951
152.652.637968775047920.0120312249520826
162.662.644314011796350.0156859882036500
172.762.743219621933260.0167803780667408
182.792.775391915570360.0146080844296415
192.792.776459058334230.0135409416657670
202.782.765528605769420.0144713942305801
212.812.793999989130.0160000108699974
222.812.793125590336910.0168744096630915
232.792.77869709188810.0113029081118987
242.792.786615433829870.00338456617013350
252.792.773002457453180.0169975425468185
262.82.776258840064610.0237411599353856
272.82.764462327910010.0355376720899852
282.82.788369582536490.0116304174635080
292.772.88476173678217-0.114761736782168
302.782.82413068226428-0.0441306822642762
312.752.78372836862127-0.0337283686212699
322.742.739961642395193.8357604806194e-05
332.742.75877957957929-0.0187795795792862
342.722.73380189457873-0.0138018945787346
352.712.696214525901840.0137854740981571
362.712.703500964459390.00649903554061337
372.72.696146152093390.00385384790661369
382.692.69221393788909-0.00221393788909374
392.72.665766748041390.0342332519586095
402.712.681601343051230.0283986569487689
412.762.751893492545580.0081065074544231
422.762.79848867019142-0.0384886701914184
432.752.76515380316382-0.0151538031638188
442.742.74451081442063-0.00451081442062851
452.712.75450691104412-0.0445069110441221
462.732.712996268181820.0170037318181819
472.732.705250844157450.0247491558425481
482.732.718036110709960.0119638892900444
492.722.713717664536650.00628233546335499
502.722.709669796233140.0103302037668604
512.752.702924326203750.0470756737962525
522.822.726008658517730.0939913414822695
532.852.836175960305170.0138240396948315
542.832.87282404420348-0.042824044203476
552.852.843439437340010.0065605626599945
562.852.841195578381120.0088044216188834
572.792.84854325538758-0.0585432553875784
582.812.81561821419967-0.00561821419966657
592.82.794344112217610.00565588778239379
602.792.789924991721167.50082788414375e-05
612.792.775576399420420.0144236005795833
622.82.778444061029760.0215559389702356
632.82.790566008353850.00943399164615455
642.862.801328686147620.0586713138523782
652.862.8627467998242-0.00274679982420212
662.852.87082323129981-0.0208232312998087
672.812.87163929721046-0.0616392972104638
682.792.82228939116698-0.0322893911669753
692.782.78068174401399-0.00068174401399057
702.772.80414002736271-0.0341400273627124
712.782.766260683313840.0137393166861632
722.852.765833322965130.084166677034867
732.822.81469238843540.00530761156460136


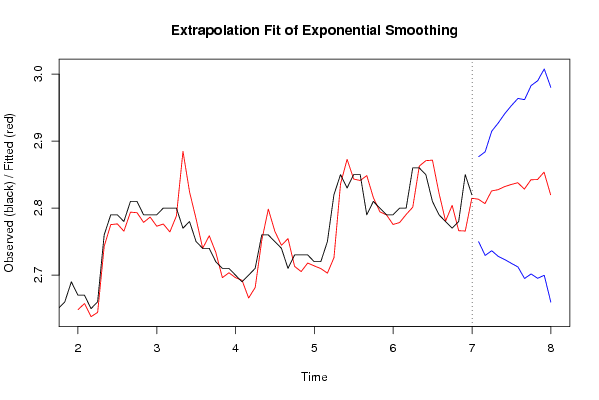
Extrapolation Forecasts of Exponential Smoothing
tForecast95% Lower Bound95% Upper Bound
742.813309493776272.749945495161412.87667349239112
752.806700436090362.729334539825662.88406633235507
762.82559778174192.736401551500822.91479401198298
772.827522074148632.727890487422342.92715366087491
782.832109954022732.723036865417072.94118304262838
792.835291852657182.717531824454252.95305188086011
802.837912441785252.712063684037182.96376119953332
812.828390042962402.694941942896832.96183814302797
822.842307109958162.701669700299542.98294451961679
832.84268192266212.695205258135582.99015858718862
842.853718289385932.699705782866993.00773079590486
852.822.659717943148262.98028205685174

\begin{tabular}{lllllllll}
\hline
Extrapolation Forecasts of Exponential Smoothing \tabularnewline
t & Forecast & 95% Lower Bound & 95% Upper Bound \tabularnewline
74 & 2.81330949377627 & 2.74994549516141 & 2.87667349239112 \tabularnewline
75 & 2.80670043609036 & 2.72933453982566 & 2.88406633235507 \tabularnewline
76 & 2.8255977817419 & 2.73640155150082 & 2.91479401198298 \tabularnewline
77 & 2.82752207414863 & 2.72789048742234 & 2.92715366087491 \tabularnewline
78 & 2.83210995402273 & 2.72303686541707 & 2.94118304262838 \tabularnewline
79 & 2.83529185265718 & 2.71753182445425 & 2.95305188086011 \tabularnewline
80 & 2.83791244178525 & 2.71206368403718 & 2.96376119953332 \tabularnewline
81 & 2.82839004296240 & 2.69494194289683 & 2.96183814302797 \tabularnewline
82 & 2.84230710995816 & 2.70166970029954 & 2.98294451961679 \tabularnewline
83 & 2.8426819226621 & 2.69520525813558 & 2.99015858718862 \tabularnewline
84 & 2.85371828938593 & 2.69970578286699 & 3.00773079590486 \tabularnewline
85 & 2.82 & 2.65971794314826 & 2.98028205685174 \tabularnewline
\hline
\end{tabular}
%Source: https://freestatistics.org/blog/index.php?pk=13486&T=3

[TABLE]
[ROW][C]Extrapolation Forecasts of Exponential Smoothing[/C][/ROW]
[ROW][C]t[/C][C]Forecast[/C][C]95% Lower Bound[/C][C]95% Upper Bound[/C][/ROW]
[ROW][C]74[/C][C]2.81330949377627[/C][C]2.74994549516141[/C][C]2.87667349239112[/C][/ROW]
[ROW][C]75[/C][C]2.80670043609036[/C][C]2.72933453982566[/C][C]2.88406633235507[/C][/ROW]
[ROW][C]76[/C][C]2.8255977817419[/C][C]2.73640155150082[/C][C]2.91479401198298[/C][/ROW]
[ROW][C]77[/C][C]2.82752207414863[/C][C]2.72789048742234[/C][C]2.92715366087491[/C][/ROW]
[ROW][C]78[/C][C]2.83210995402273[/C][C]2.72303686541707[/C][C]2.94118304262838[/C][/ROW]
[ROW][C]79[/C][C]2.83529185265718[/C][C]2.71753182445425[/C][C]2.95305188086011[/C][/ROW]
[ROW][C]80[/C][C]2.83791244178525[/C][C]2.71206368403718[/C][C]2.96376119953332[/C][/ROW]
[ROW][C]81[/C][C]2.82839004296240[/C][C]2.69494194289683[/C][C]2.96183814302797[/C][/ROW]
[ROW][C]82[/C][C]2.84230710995816[/C][C]2.70166970029954[/C][C]2.98294451961679[/C][/ROW]
[ROW][C]83[/C][C]2.8426819226621[/C][C]2.69520525813558[/C][C]2.99015858718862[/C][/ROW]
[ROW][C]84[/C][C]2.85371828938593[/C][C]2.69970578286699[/C][C]3.00773079590486[/C][/ROW]
[ROW][C]85[/C][C]2.82[/C][C]2.65971794314826[/C][C]2.98028205685174[/C][/ROW]
[/TABLE]
Source: https://freestatistics.org/blog/index.php?pk=13486&T=3

Globally Unique Identifier (entire table): ba.freestatistics.org/blog/index.php?pk=13486&T=3

As an alternative you can also use a QR Code:  

The GUIDs for individual cells are displayed in the table below:

Extrapolation Forecasts of Exponential Smoothing
tForecast95% Lower Bound95% Upper Bound
742.813309493776272.749945495161412.87667349239112
752.806700436090362.729334539825662.88406633235507
762.82559778174192.736401551500822.91479401198298
772.827522074148632.727890487422342.92715366087491
782.832109954022732.723036865417072.94118304262838
792.835291852657182.717531824454252.95305188086011
802.837912441785252.712063684037182.96376119953332
812.828390042962402.694941942896832.96183814302797
822.842307109958162.701669700299542.98294451961679
832.84268192266212.695205258135582.99015858718862
842.853718289385932.699705782866993.00773079590486
852.822.659717943148262.98028205685174


Parameters (Session):
par1 = 12 ; par2 = Triple ; par3 = additive ;
Parameters (R input):
par1 = 12 ; par2 = Triple ; par3 = additive ;
R code (references can be found in the software module):
par1 <- as.numeric(par1)
if (par2 == 'Single') K <- 1
if (par2 == 'Double') K <- 2
if (par2 == 'Triple') K <- par1
nx <- length(x)
nxmK <- nx - K
x <- ts(x, frequency = par1)
if (par2 == 'Single') fit <- HoltWinters(x, gamma=0, beta=0)
if (par2 == 'Double') fit <- HoltWinters(x, gamma=0)
if (par2 == 'Triple') fit <- HoltWinters(x, seasonal=par3)
fit
myresid <- x - fit$fitted[,'xhat']
bitmap(file='test1.png')
op <- par(mfrow=c(2,1))
plot(fit,ylab='Observed (black) / Fitted (red)',main='Interpolation Fit of Exponential Smoothing')
plot(myresid,ylab='Residuals',main='Interpolation Prediction Errors')
par(op)
dev.off()
bitmap(file='test2.png')
p <- predict(fit, par1, prediction.interval=TRUE)
np <- length(p[,1])
plot(fit,p,ylab='Observed (black) / Fitted (red)',main='Extrapolation Fit of Exponential Smoothing')
dev.off()
bitmap(file='test3.png')
op <- par(mfrow = c(2,2))
acf(as.numeric(myresid),lag.max = nx/2,main='Residual ACF')
spectrum(myresid,main='Residals Periodogram')
cpgram(myresid,main='Residal Cumulative Periodogram')
qqnorm(myresid,main='Residual Normal QQ Plot')
qqline(myresid)
par(op)
dev.off()
load(file='createtable')
a<-table.start()
a<-table.row.start(a)
a<-table.element(a,'Estimated Parameters of Exponential Smoothing',2,TRUE)
a<-table.row.end(a)
a<-table.row.start(a)
a<-table.element(a,'Parameter',header=TRUE)
a<-table.element(a,'Value',header=TRUE)
a<-table.row.end(a)
a<-table.row.start(a)
a<-table.element(a,'alpha',header=TRUE)
a<-table.element(a,fit$alpha)
a<-table.row.end(a)
a<-table.row.start(a)
a<-table.element(a,'beta',header=TRUE)
a<-table.element(a,fit$beta)
a<-table.row.end(a)
a<-table.row.start(a)
a<-table.element(a,'gamma',header=TRUE)
a<-table.element(a,fit$gamma)
a<-table.row.end(a)
a<-table.end(a)
table.save(a,file='mytable.tab')
a<-table.start()
a<-table.row.start(a)
a<-table.element(a,'Interpolation Forecasts of Exponential Smoothing',4,TRUE)
a<-table.row.end(a)
a<-table.row.start(a)
a<-table.element(a,'t',header=TRUE)
a<-table.element(a,'Observed',header=TRUE)
a<-table.element(a,'Fitted',header=TRUE)
a<-table.element(a,'Residuals',header=TRUE)
a<-table.row.end(a)
for (i in 1:nxmK) {
a<-table.row.start(a)
a<-table.element(a,i+K,header=TRUE)
a<-table.element(a,x[i+K])
a<-table.element(a,fit$fitted[i,'xhat'])
a<-table.element(a,myresid[i])
a<-table.row.end(a)
}
a<-table.end(a)
table.save(a,file='mytable1.tab')
a<-table.start()
a<-table.row.start(a)
a<-table.element(a,'Extrapolation Forecasts of Exponential Smoothing',4,TRUE)
a<-table.row.end(a)
a<-table.row.start(a)
a<-table.element(a,'t',header=TRUE)
a<-table.element(a,'Forecast',header=TRUE)
a<-table.element(a,'95% Lower Bound',header=TRUE)
a<-table.element(a,'95% Upper Bound',header=TRUE)
a<-table.row.end(a)
for (i in 1:np) {
a<-table.row.start(a)
a<-table.element(a,nx+i,header=TRUE)
a<-table.element(a,p[i,'fit'])
a<-table.element(a,p[i,'lwr'])
a<-table.element(a,p[i,'upr'])
a<-table.row.end(a)
}
a<-table.end(a)
table.save(a,file='mytable2.tab')