Free Statistics

of Irreproducible Research!

Author's title

Author*The author of this computation has been verified*
R Software Modulerwasp_meanplot.wasp
Title produced by softwareMean Plot
Date of computationSun, 02 Nov 2008 05:30:55 -0700
Cite this page as followsStatistical Computations at FreeStatistics.org, Office for Research Development and Education, URL https://freestatistics.org/blog/index.php?v=date/2008/Nov/02/t1225629160mur6kqw0sp1qvov.htm/, Retrieved Sat, 18 May 2024 21:19:47 +0000
Statistical Computations at FreeStatistics.org, Office for Research Development and Education, URL https://freestatistics.org/blog/index.php?pk=20525, Retrieved Sat, 18 May 2024 21:19:47 +0000
QR Codes:

Original text written by user:
IsPrivate?No (this computation is public)
User-defined keywords
Estimated Impact177
Family? (F = Feedback message, R = changed R code, M = changed R Module, P = changed Parameters, D = changed Data)
F     [Mean Plot] [workshop 3] [2007-10-26 12:14:28] [e9ffc5de6f8a7be62f22b142b5b6b1a8]
F    D  [Mean Plot] [Q2: seasonality] [2008-11-02 08:55:25] [4396f984ebeab43316cd6baa88a4fd40]
F   PD      [Mean Plot] [Task 5] [2008-11-02 12:30:55] [54ae75b68e6a45c6d55fa4235827d5b3] [Current]
Feedback Forum
2008-11-05 16:17:56 [Ken Van den Heuvel] [reply
Je tijdsreeks is niet terug te vinden in je document, er is ook geen link naar de blog ervan.

Verder zijn je conclusies nogal beperkt.
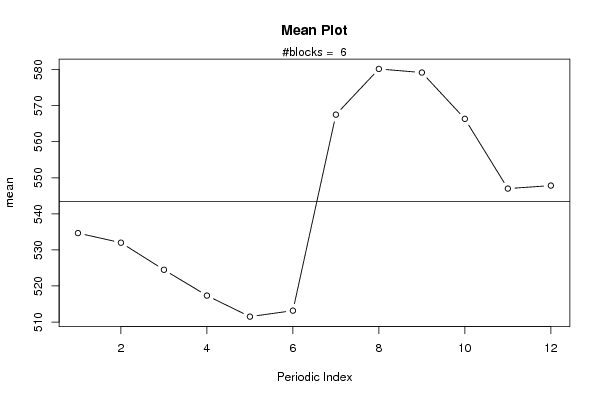
Je stelt: 'De Mean Plot vertoont een grote wijziging in de locatie na de 6de maand. '
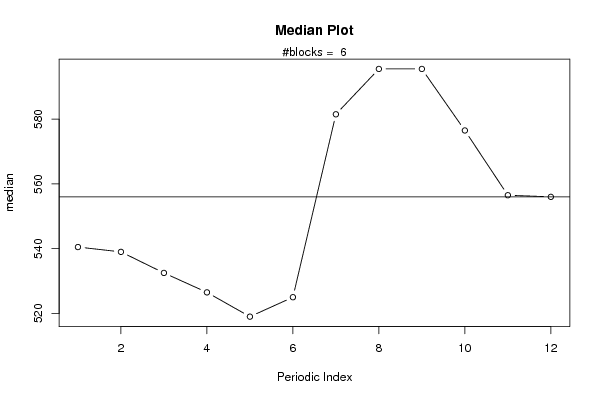
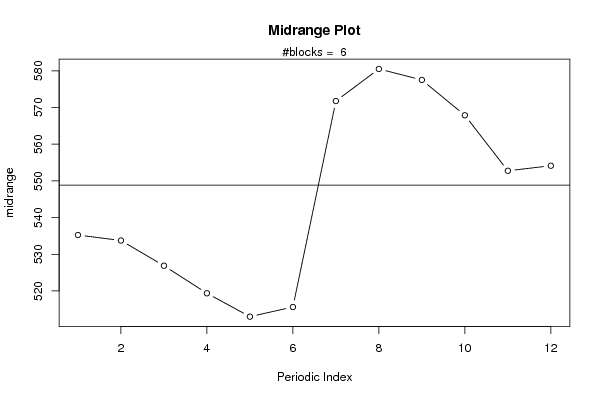
Dat is waar, maar je had dit nog kunnen proberen te verklaren...of staven dmv van een van de andere grafieken/figuren in deze computatie.
Waarom is er juist rond maand 6 altijd een stijging van de werkloosheid? (mogelijks zitten de zomermaanden hier voor iets mee tussen...).
2008-11-08 11:16:47 [Astrid Sniekers] [reply
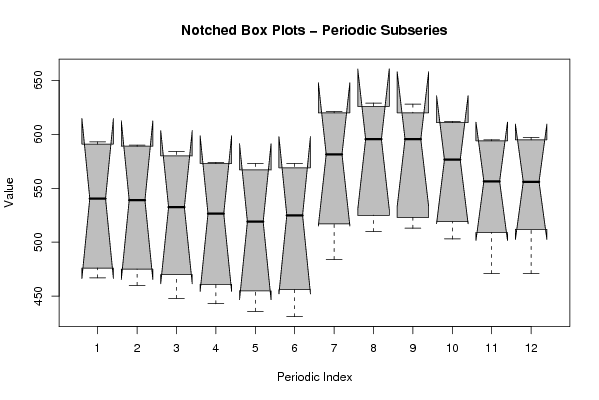
Ik ben vergeten mijn tijdreeks werkloosheid bij het document te voegen. De mean plot toont een grote verandering van het gemiddelde in maand 6 t.o.v. het gemiddelde in maand 7. Dit is echter toevallig, want als we naar Notched Box Plots – Periodic Subseries gaan kijken zien we dat de betrouwbaarheidsintervallen van maand 6 en maand 7 elkaar overlappen.

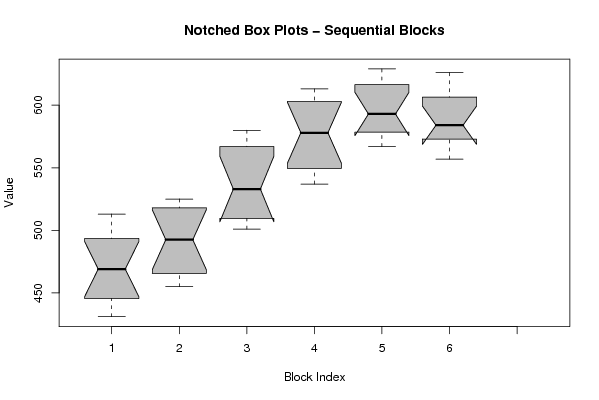
Notched Box Plots – Sequential Blocks
Aan de hand van de Sequential Blocks kunnen we een besluit trekken over de verschillende jaren van de tijdreeks werkloosheid. Er valt een stijgende trend op te merken van de mediaan. Als we nu naar de grenzen van de verschillende boxplots kijken, merken we op dat de betrouwbaarheidsintervallen elkaar overlappen. De stijging van de mediaan kan dus louter toevallig zijn.
2008-11-11 15:50:20 [Ellen Smolders] [reply
De student is inderdaad de tijdreeks vergeten toe te voegen in het document. De grafiek vertoont enkele zeer opvallende kenmerken. Van maand 6 naar 7 stijgt het gemiddelde drastisch, dit betekent dat de werkloosheid in die periode groter wordt, dit zou de student moeten proberen te verklaren. we kunnen zien dat de werkloosheid een stijgende trend vertoont, dit moet de student ook verklaren. Tussen maand 6 en 7 is het verschil veel groter dan in de andere maanden.

Post a new message
Dataseries X:
467
460
448
443
436
431
484
510
513
503
471
471
476
475
470
461
455
456
517
525
523
519
509
512
519
517
510
509
501
507
569
580
578
565
547
555
562
561
555
544
537
543
594
611
613
611
594
595
591
589
584
573
567
569
621
629
628
612
595
597
593
590
580
574
573
573
620
626
620
588
566
557


Summary of computational transaction
Raw Inputview raw input (R code)
Raw Outputview raw output of R engine
Computing time3 seconds
R Server'Sir Ronald Aylmer Fisher' @ 193.190.124.24

\begin{tabular}{lllllllll}
\hline
Summary of computational transaction \tabularnewline
Raw Input & view raw input (R code)  \tabularnewline
Raw Output & view raw output of R engine  \tabularnewline
Computing time & 3 seconds \tabularnewline
R Server & 'Sir Ronald Aylmer Fisher' @ 193.190.124.24 \tabularnewline
\hline
\end{tabular}
%Source: https://freestatistics.org/blog/index.php?pk=20525&T=0

[TABLE]
[ROW][C]Summary of computational transaction[/C][/ROW]
[ROW][C]Raw Input[/C][C]view raw input (R code) [/C][/ROW]
[ROW][C]Raw Output[/C][C]view raw output of R engine [/C][/ROW]
[ROW][C]Computing time[/C][C]3 seconds[/C][/ROW]
[ROW][C]R Server[/C][C]'Sir Ronald Aylmer Fisher' @ 193.190.124.24[/C][/ROW]
[/TABLE]
Source: https://freestatistics.org/blog/index.php?pk=20525&T=0

Globally Unique Identifier (entire table): ba.freestatistics.org/blog/index.php?pk=20525&T=0

As an alternative you can also use a QR Code:  

The GUIDs for individual cells are displayed in the table below:

Summary of computational transaction
Raw Inputview raw input (R code)
Raw Outputview raw output of R engine
Computing time3 seconds
R Server'Sir Ronald Aylmer Fisher' @ 193.190.124.24


Parameters (Session):
par1 = red ;
Parameters (R input):
par1 = 12 ;
R code (references can be found in the software module):
par1 <- as.numeric(par1)
(n <- length(x))
(np <- floor(n / par1))
arr <- array(NA,dim=c(par1,np+1))
ari <- array(0,dim=par1)
j <- 0
for (i in 1:n)
{
j = j + 1
ari[j] = ari[j] + 1
arr[j,ari[j]] <- x[i]
if (j == par1) j = 0
}
ari
arr
arr.mean <- array(NA,dim=par1)
arr.median <- array(NA,dim=par1)
arr.midrange <- array(NA,dim=par1)
for (j in 1:par1)
{
arr.mean[j] <- mean(arr[j,],na.rm=TRUE)
arr.median[j] <- median(arr[j,],na.rm=TRUE)
arr.midrange[j] <- (quantile(arr[j,],0.75,na.rm=TRUE) + quantile(arr[j,],0.25,na.rm=TRUE)) / 2
}
overall.mean <- mean(x)
overall.median <- median(x)
overall.midrange <- (quantile(x,0.75) + quantile(x,0.25)) / 2
bitmap(file='plot1.png')
plot(arr.mean,type='b',ylab='mean',main='Mean Plot',xlab='Periodic Index')
mtext(paste('#blocks = ',np))
abline(overall.mean,0)
dev.off()
bitmap(file='plot2.png')
plot(arr.median,type='b',ylab='median',main='Median Plot',xlab='Periodic Index')
mtext(paste('#blocks = ',np))
abline(overall.median,0)
dev.off()
bitmap(file='plot3.png')
plot(arr.midrange,type='b',ylab='midrange',main='Midrange Plot',xlab='Periodic Index')
mtext(paste('#blocks = ',np))
abline(overall.midrange,0)
dev.off()
bitmap(file='plot4.png')
z <- data.frame(t(arr))
names(z) <- c(1:par1)
(boxplot(z,notch=TRUE,col='grey',xlab='Periodic Index',ylab='Value',main='Notched Box Plots - Periodic Subseries'))
dev.off()
bitmap(file='plot5.png')
z <- data.frame(arr)
names(z) <- c(1:np)
(boxplot(z,notch=TRUE,col='grey',xlab='Block Index',ylab='Value',main='Notched Box Plots - Sequential Blocks'))
dev.off()
bitmap(file='plot6.png')
z <- data.frame(cbind(arr.mean,arr.median,arr.midrange))
names(z) <- list('mean','median','midrange')
(boxplot(z,notch=TRUE,col='grey',ylab='Overall Central Tendency',main='Notched Box Plots'))
dev.off()