Free Statistics

of Irreproducible Research!

Author's title

Author*The author of this computation has been verified*
R Software Modulerwasp_hierarchicalclustering.wasp
Title produced by softwareHierarchical Clustering
Date of computationSat, 08 Nov 2008 05:46:45 -0700
Cite this page as followsStatistical Computations at FreeStatistics.org, Office for Research Development and Education, URL https://freestatistics.org/blog/index.php?v=date/2008/Nov/08/t1226148451vgzkf4sank6ensh.htm/, Retrieved Sat, 18 May 2024 23:05:38 +0000
Statistical Computations at FreeStatistics.org, Office for Research Development and Education, URL https://freestatistics.org/blog/index.php?pk=22587, Retrieved Sat, 18 May 2024 23:05:38 +0000
QR Codes:

Original text written by user:
IsPrivate?No (this computation is public)
User-defined keywords
Estimated Impact191
Family? (F = Feedback message, R = changed R code, M = changed R Module, P = changed Parameters, D = changed Data)
F       [Hierarchical Clustering] [Q2 Hierarchical C...] [2008-11-08 12:46:45] [d7f41258beeebb8716e3f5d39f3cdc01] [Current]
Feedback Forum
2008-11-14 13:15:27 [Dana Molenberghs] [reply
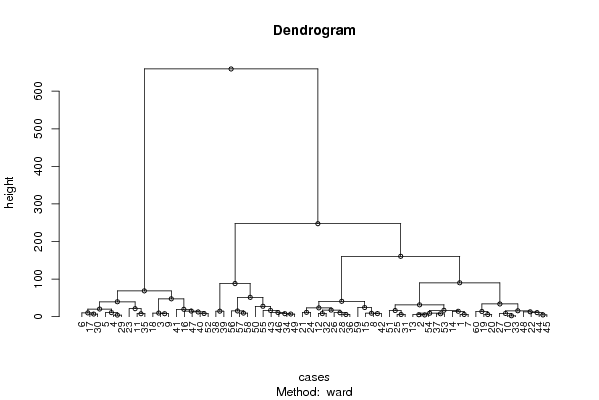
Het dendrogram heeft de clustering weer van de observaties uit je tijdrijks, die gelijkaardig zijn. Elk puntje is een observatie en krijgt een volgnummer. De takken zijn de groeperingen. We zien hier 2 groepen. Maar de 2de groep is opmerkelijk groter.
2008-11-20 12:53:22 [Evelien Blockx] [reply
In het dendrogram zijn clusters te zien. De cijfers onderaan stellen de observaties voor. Met het dendrogram kan je kijken welke observaties iets gelijkaardig hebben.

Op het eerste zicht is er in de 2 grote clusters van het dendrogram niet echt iets opvallends te zien. In de eerste grote cluster heb je bijvoorbeeld de cijfers 6, 17, 30, 5, 4, 29, 23, 11, 35, 18, 3, 9, 41, 16, 47, 40, 52. Dat zijn dus observaties die zowel uit het begin van de tijdreeks komen, als uit het midden en het einde van de tijdreeks.

In principe kan je ook voor de kleinere clusters dit gaan bekijken. Zo is er bijvoorbeeld een cluster met 56, 57, 58. Het is opvallend dat dat 3 observaties zijn uit het einde van de tijdreeks.
2008-11-23 21:27:43 [Isabel Wilms] [reply
Het dendogram wordt meestal gebruikt voor niet-tijdreeksen vb: in de marketing, om producten die samen horen te categoriseren.
Het dendogram geeft een clustering weer van observaties (maanden), er staat ook telkens een volgnummer bij. Welke observaties van de tijdreeksen gelijkaardig zijn, worden geclusterd, vormen dus aparte takken. Des te minder clusters er gevormd worden, des te meer verband in de tijdreeksen.

Post a new message
Dataseries X:
109.8	148.8	118.3	110.3
111.7	146.7	127.3	114.8
98.6	118.8	112.3	94.6
96.9	99.4	114.9	92
95.1	97.6	108.2	93.8
97	110.2	105.4	93.8
112.7	146.6	122.1	107.6
102.9	136.4	113.5	101
97.4	126.2	110	95.4
111.4	154.9	125.3	96.5
87.4	109	114.3	89.2
96.8	128.5	115.6	87.1
114.1	144.9	127.1	110.5
110.3	136.3	123	110.8
103.9	134.8	122.2	104.2
101.6	103.4	126.4	88.9
94.6	106.6	112.7	89.8
95.9	119.2	105.8	90
104.7	149.3	120.9	93.9
102.8	150.2	116.3	91.3
98.1	142.9	115.7	87.8
113.9	163.6	127.9	99.7
80.9	98.2	108.3	73.5
95.7	138.2	121.1	79.2
113.2	143.7	128.6	96.9
105.9	132.8	123.1	95.2
108.8	149.4	127.7	95.6
102.3	128.8	126.6	89.7
99	98.9	118.4	92.8
100.7	106.2	110	88
115.5	140.7	129.6	101.1
100.7	133	115.8	92.7
109.9	156.4	125.9	95.8
114.6	157.7	128.4	103.8
85.4	107.9	114	81.8
100.5	133.6	125.6	87.1
114.8	148.1	128.5	105.9
116.5	205.6	136.6	108.1
112.9	193.1	133.1	102.6
102	117.5	124.6	93.7
106	116.4	123.5	103.5
105.3	129.5	117.2	100.6
118.8	157.1	135.5	113.3
106.1	157	124.8	102.4
109.3	158.4	127.8	102.1
117.2	161.7	133.1	106.9
92.5	116.9	125.7	87.3
104.2	161.1	128.4	93.1
112.5	155.7	131.9	109.1
122.4	160.8	146.3	120.3
113.3	145.4	140.6	104.9
100	111	129.5	92.6
110.7	144.8	132.4	109.8
112.8	149.2	125.9	111.4
109.8	156.6	126.9	117.9
117.3	182.5	135.8	121.6
109.1	171.3	129.5	117.8
115.9	172.7	130.2	124.2
96	133	133.8	106.8
97.6	148.1	123.3	100.9


Summary of computational transaction
Raw Inputview raw input (R code)
Raw Outputview raw output of R engine
Computing time2 seconds
R Server'Gwilym Jenkins' @ 72.249.127.135

\begin{tabular}{lllllllll}
\hline
Summary of computational transaction \tabularnewline
Raw Input & view raw input (R code)  \tabularnewline
Raw Output & view raw output of R engine  \tabularnewline
Computing time & 2 seconds \tabularnewline
R Server & 'Gwilym Jenkins' @ 72.249.127.135 \tabularnewline
\hline
\end{tabular}
%Source: https://freestatistics.org/blog/index.php?pk=22587&T=0

[TABLE]
[ROW][C]Summary of computational transaction[/C][/ROW]
[ROW][C]Raw Input[/C][C]view raw input (R code) [/C][/ROW]
[ROW][C]Raw Output[/C][C]view raw output of R engine [/C][/ROW]
[ROW][C]Computing time[/C][C]2 seconds[/C][/ROW]
[ROW][C]R Server[/C][C]'Gwilym Jenkins' @ 72.249.127.135[/C][/ROW]
[/TABLE]
Source: https://freestatistics.org/blog/index.php?pk=22587&T=0

Globally Unique Identifier (entire table): ba.freestatistics.org/blog/index.php?pk=22587&T=0

As an alternative you can also use a QR Code:  

The GUIDs for individual cells are displayed in the table below:

Summary of computational transaction
Raw Inputview raw input (R code)
Raw Outputview raw output of R engine
Computing time2 seconds
R Server'Gwilym Jenkins' @ 72.249.127.135


Summary of Dendrogram
LabelHeight
12.31300670124408
24.18927201313068
34.58039299623950
44.61410879802374
55.12849296353602
65.68682688324518
75.73846669416142
85.83438085832592
95.91438923304851
106.92098258919932
116.98212002188447
127.62364742101836
137.74983870799903
147.88225855957543
157.94115570231299
168.17679643870386
178.19878039710786
188.45399313933954
198.5057982855388
209.07156186831972
219.14004933124971
229.46836839165018
239.58581927896433
2410.0751449484902
2510.4125797550762
2610.702000817405
2710.8919110126347
2811.0136236810983
2911.4442125111342
3012.569425267137
3113.0023252126165
3213.7466072788174
3314.3346266451543
3414.5502577296761
3515.0075419335415
3615.0953674629106
3715.6308638135530
3816.2637412624147
3916.5339307568122
4016.9955730315128
4117.4031677326043
4219.5876995966315
4320.3226366603704
4421.2143572606957
4523.3188212342353
4624.2686321723351
4727.6415380997149
4831.4119996674662
4933.7652240625095
5039.6074135103671
5140.7994691936216
5247.4371132914931
5351.3664581475435
5468.5807933588385
5588.0766563900602
5690.119397994664
57160.61112212819
58247.395704984203
59659.263321866696

\begin{tabular}{lllllllll}
\hline
Summary of Dendrogram \tabularnewline
Label & Height \tabularnewline
1 & 2.31300670124408 \tabularnewline
2 & 4.18927201313068 \tabularnewline
3 & 4.58039299623950 \tabularnewline
4 & 4.61410879802374 \tabularnewline
5 & 5.12849296353602 \tabularnewline
6 & 5.68682688324518 \tabularnewline
7 & 5.73846669416142 \tabularnewline
8 & 5.83438085832592 \tabularnewline
9 & 5.91438923304851 \tabularnewline
10 & 6.92098258919932 \tabularnewline
11 & 6.98212002188447 \tabularnewline
12 & 7.62364742101836 \tabularnewline
13 & 7.74983870799903 \tabularnewline
14 & 7.88225855957543 \tabularnewline
15 & 7.94115570231299 \tabularnewline
16 & 8.17679643870386 \tabularnewline
17 & 8.19878039710786 \tabularnewline
18 & 8.45399313933954 \tabularnewline
19 & 8.5057982855388 \tabularnewline
20 & 9.07156186831972 \tabularnewline
21 & 9.14004933124971 \tabularnewline
22 & 9.46836839165018 \tabularnewline
23 & 9.58581927896433 \tabularnewline
24 & 10.0751449484902 \tabularnewline
25 & 10.4125797550762 \tabularnewline
26 & 10.702000817405 \tabularnewline
27 & 10.8919110126347 \tabularnewline
28 & 11.0136236810983 \tabularnewline
29 & 11.4442125111342 \tabularnewline
30 & 12.569425267137 \tabularnewline
31 & 13.0023252126165 \tabularnewline
32 & 13.7466072788174 \tabularnewline
33 & 14.3346266451543 \tabularnewline
34 & 14.5502577296761 \tabularnewline
35 & 15.0075419335415 \tabularnewline
36 & 15.0953674629106 \tabularnewline
37 & 15.6308638135530 \tabularnewline
38 & 16.2637412624147 \tabularnewline
39 & 16.5339307568122 \tabularnewline
40 & 16.9955730315128 \tabularnewline
41 & 17.4031677326043 \tabularnewline
42 & 19.5876995966315 \tabularnewline
43 & 20.3226366603704 \tabularnewline
44 & 21.2143572606957 \tabularnewline
45 & 23.3188212342353 \tabularnewline
46 & 24.2686321723351 \tabularnewline
47 & 27.6415380997149 \tabularnewline
48 & 31.4119996674662 \tabularnewline
49 & 33.7652240625095 \tabularnewline
50 & 39.6074135103671 \tabularnewline
51 & 40.7994691936216 \tabularnewline
52 & 47.4371132914931 \tabularnewline
53 & 51.3664581475435 \tabularnewline
54 & 68.5807933588385 \tabularnewline
55 & 88.0766563900602 \tabularnewline
56 & 90.119397994664 \tabularnewline
57 & 160.61112212819 \tabularnewline
58 & 247.395704984203 \tabularnewline
59 & 659.263321866696 \tabularnewline
\hline
\end{tabular}
%Source: https://freestatistics.org/blog/index.php?pk=22587&T=1

[TABLE]
[ROW][C]Summary of Dendrogram[/C][/ROW]
[ROW][C]Label[/C][C]Height[/C][/ROW]
[ROW][C]1[/C][C]2.31300670124408[/C][/ROW]
[ROW][C]2[/C][C]4.18927201313068[/C][/ROW]
[ROW][C]3[/C][C]4.58039299623950[/C][/ROW]
[ROW][C]4[/C][C]4.61410879802374[/C][/ROW]
[ROW][C]5[/C][C]5.12849296353602[/C][/ROW]
[ROW][C]6[/C][C]5.68682688324518[/C][/ROW]
[ROW][C]7[/C][C]5.73846669416142[/C][/ROW]
[ROW][C]8[/C][C]5.83438085832592[/C][/ROW]
[ROW][C]9[/C][C]5.91438923304851[/C][/ROW]
[ROW][C]10[/C][C]6.92098258919932[/C][/ROW]
[ROW][C]11[/C][C]6.98212002188447[/C][/ROW]
[ROW][C]12[/C][C]7.62364742101836[/C][/ROW]
[ROW][C]13[/C][C]7.74983870799903[/C][/ROW]
[ROW][C]14[/C][C]7.88225855957543[/C][/ROW]
[ROW][C]15[/C][C]7.94115570231299[/C][/ROW]
[ROW][C]16[/C][C]8.17679643870386[/C][/ROW]
[ROW][C]17[/C][C]8.19878039710786[/C][/ROW]
[ROW][C]18[/C][C]8.45399313933954[/C][/ROW]
[ROW][C]19[/C][C]8.5057982855388[/C][/ROW]
[ROW][C]20[/C][C]9.07156186831972[/C][/ROW]
[ROW][C]21[/C][C]9.14004933124971[/C][/ROW]
[ROW][C]22[/C][C]9.46836839165018[/C][/ROW]
[ROW][C]23[/C][C]9.58581927896433[/C][/ROW]
[ROW][C]24[/C][C]10.0751449484902[/C][/ROW]
[ROW][C]25[/C][C]10.4125797550762[/C][/ROW]
[ROW][C]26[/C][C]10.702000817405[/C][/ROW]
[ROW][C]27[/C][C]10.8919110126347[/C][/ROW]
[ROW][C]28[/C][C]11.0136236810983[/C][/ROW]
[ROW][C]29[/C][C]11.4442125111342[/C][/ROW]
[ROW][C]30[/C][C]12.569425267137[/C][/ROW]
[ROW][C]31[/C][C]13.0023252126165[/C][/ROW]
[ROW][C]32[/C][C]13.7466072788174[/C][/ROW]
[ROW][C]33[/C][C]14.3346266451543[/C][/ROW]
[ROW][C]34[/C][C]14.5502577296761[/C][/ROW]
[ROW][C]35[/C][C]15.0075419335415[/C][/ROW]
[ROW][C]36[/C][C]15.0953674629106[/C][/ROW]
[ROW][C]37[/C][C]15.6308638135530[/C][/ROW]
[ROW][C]38[/C][C]16.2637412624147[/C][/ROW]
[ROW][C]39[/C][C]16.5339307568122[/C][/ROW]
[ROW][C]40[/C][C]16.9955730315128[/C][/ROW]
[ROW][C]41[/C][C]17.4031677326043[/C][/ROW]
[ROW][C]42[/C][C]19.5876995966315[/C][/ROW]
[ROW][C]43[/C][C]20.3226366603704[/C][/ROW]
[ROW][C]44[/C][C]21.2143572606957[/C][/ROW]
[ROW][C]45[/C][C]23.3188212342353[/C][/ROW]
[ROW][C]46[/C][C]24.2686321723351[/C][/ROW]
[ROW][C]47[/C][C]27.6415380997149[/C][/ROW]
[ROW][C]48[/C][C]31.4119996674662[/C][/ROW]
[ROW][C]49[/C][C]33.7652240625095[/C][/ROW]
[ROW][C]50[/C][C]39.6074135103671[/C][/ROW]
[ROW][C]51[/C][C]40.7994691936216[/C][/ROW]
[ROW][C]52[/C][C]47.4371132914931[/C][/ROW]
[ROW][C]53[/C][C]51.3664581475435[/C][/ROW]
[ROW][C]54[/C][C]68.5807933588385[/C][/ROW]
[ROW][C]55[/C][C]88.0766563900602[/C][/ROW]
[ROW][C]56[/C][C]90.119397994664[/C][/ROW]
[ROW][C]57[/C][C]160.61112212819[/C][/ROW]
[ROW][C]58[/C][C]247.395704984203[/C][/ROW]
[ROW][C]59[/C][C]659.263321866696[/C][/ROW]
[/TABLE]
Source: https://freestatistics.org/blog/index.php?pk=22587&T=1

Globally Unique Identifier (entire table): ba.freestatistics.org/blog/index.php?pk=22587&T=1

As an alternative you can also use a QR Code:  

The GUIDs for individual cells are displayed in the table below:

Summary of Dendrogram
LabelHeight
12.31300670124408
24.18927201313068
34.58039299623950
44.61410879802374
55.12849296353602
65.68682688324518
75.73846669416142
85.83438085832592
95.91438923304851
106.92098258919932
116.98212002188447
127.62364742101836
137.74983870799903
147.88225855957543
157.94115570231299
168.17679643870386
178.19878039710786
188.45399313933954
198.5057982855388
209.07156186831972
219.14004933124971
229.46836839165018
239.58581927896433
2410.0751449484902
2510.4125797550762
2610.702000817405
2710.8919110126347
2811.0136236810983
2911.4442125111342
3012.569425267137
3113.0023252126165
3213.7466072788174
3314.3346266451543
3414.5502577296761
3515.0075419335415
3615.0953674629106
3715.6308638135530
3816.2637412624147
3916.5339307568122
4016.9955730315128
4117.4031677326043
4219.5876995966315
4320.3226366603704
4421.2143572606957
4523.3188212342353
4624.2686321723351
4727.6415380997149
4831.4119996674662
4933.7652240625095
5039.6074135103671
5140.7994691936216
5247.4371132914931
5351.3664581475435
5468.5807933588385
5588.0766563900602
5690.119397994664
57160.61112212819
58247.395704984203
59659.263321866696


Parameters (Session):
par1 = ward ; par2 = ALL ; par3 = FALSE ; par4 = FALSE ;
Parameters (R input):
par1 = ward ; par2 = ALL ; par3 = FALSE ; par4 = FALSE ;
R code (references can be found in the software module):
par3 <- as.logical(par3)
par4 <- as.logical(par4)
if (par3 == 'TRUE'){
dum = xlab
xlab = ylab
ylab = dum
}
x <- t(y)
hc <- hclust(dist(x),method=par1)
d <- as.dendrogram(hc)
str(d)
mysub <- paste('Method: ',par1)
bitmap(file='test1.png')
if (par4 == 'TRUE'){
plot(d,main=main,ylab=ylab,xlab=xlab,horiz=par3, nodePar=list(pch = c(1,NA), cex=0.8, lab.cex = 0.8),type='t',center=T, sub=mysub)
} else {
plot(d,main=main,ylab=ylab,xlab=xlab,horiz=par3, nodePar=list(pch = c(1,NA), cex=0.8, lab.cex = 0.8), sub=mysub)
}
dev.off()
if (par2 != 'ALL'){
if (par3 == 'TRUE'){
ylab = 'cluster'
} else {
xlab = 'cluster'
}
par2 <- as.numeric(par2)
memb <- cutree(hc, k = par2)
cent <- NULL
for(k in 1:par2){
cent <- rbind(cent, colMeans(x[memb == k, , drop = FALSE]))
}
hc1 <- hclust(dist(cent),method=par1, members = table(memb))
de <- as.dendrogram(hc1)
bitmap(file='test2.png')
if (par4 == 'TRUE'){
plot(de,main=main,ylab=ylab,xlab=xlab,horiz=par3, nodePar=list(pch = c(1,NA), cex=0.8, lab.cex = 0.8),type='t',center=T, sub=mysub)
} else {
plot(de,main=main,ylab=ylab,xlab=xlab,horiz=par3, nodePar=list(pch = c(1,NA), cex=0.8, lab.cex = 0.8), sub=mysub)
}
dev.off()
str(de)
}
load(file='createtable')
a<-table.start()
a<-table.row.start(a)
a<-table.element(a,'Summary of Dendrogram',2,TRUE)
a<-table.row.end(a)
a<-table.row.start(a)
a<-table.element(a,'Label',header=TRUE)
a<-table.element(a,'Height',header=TRUE)
a<-table.row.end(a)
num <- length(x[,1])-1
for (i in 1:num)
{
a<-table.row.start(a)
a<-table.element(a,hc$labels[i])
a<-table.element(a,hc$height[i])
a<-table.row.end(a)
}
a<-table.end(a)
table.save(a,file='mytable1.tab')
if (par2 != 'ALL'){
a<-table.start()
a<-table.row.start(a)
a<-table.element(a,'Summary of Cut Dendrogram',2,TRUE)
a<-table.row.end(a)
a<-table.row.start(a)
a<-table.element(a,'Label',header=TRUE)
a<-table.element(a,'Height',header=TRUE)
a<-table.row.end(a)
num <- par2-1
for (i in 1:num)
{
a<-table.row.start(a)
a<-table.element(a,i)
a<-table.element(a,hc1$height[i])
a<-table.row.end(a)
}
a<-table.end(a)
table.save(a,file='mytable2.tab')
}