Free Statistics

of Irreproducible Research!

Author's title

Trivariate Scatterplots prijsindexcijfers van de grondstoffen (x) en de hoe...

Author*The author of this computation has been verified*
R Software Modulerwasp_cloud.wasp
Title produced by softwareTrivariate Scatterplots
Date of computationMon, 10 Nov 2008 14:48:17 -0700
Cite this page as followsStatistical Computations at FreeStatistics.org, Office for Research Development and Education, URL https://freestatistics.org/blog/index.php?v=date/2008/Nov/10/t122635374895r62pa05p8ic8v.htm/, Retrieved Sat, 25 May 2024 07:48:36 +0000
Statistical Computations at FreeStatistics.org, Office for Research Development and Education, URL https://freestatistics.org/blog/index.php?pk=23211, Retrieved Sat, 25 May 2024 07:48:36 +0000
QR Codes:

Original text written by user:
IsPrivate?No (this computation is public)
User-defined keywords
Estimated Impact155
Family? (F = Feedback message, R = changed R code, M = changed R Module, P = changed Parameters, D = changed Data)
F       [Trivariate Scatterplots] [Trivariate Scatte...] [2008-11-10 21:48:17] [63db34dadd44fb018112addcdefe949f] [Current]
- RMPD    [Kendall tau Correlation Matrix] [Kendall tau Corre...] [2008-12-07 22:23:00] [58bf45a666dc5198906262e8815a9722]
Feedback Forum
2008-11-20 22:58:49 [Olivier Uyttendaele] [reply
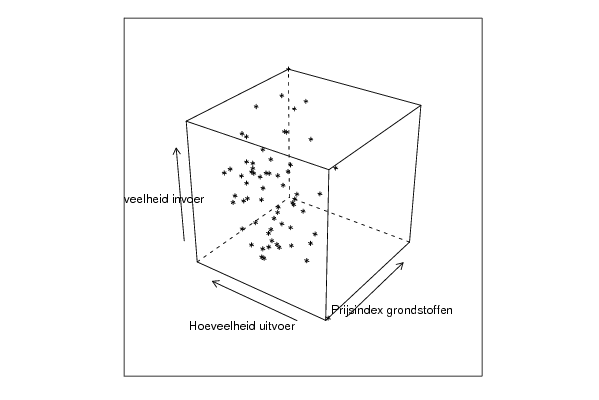
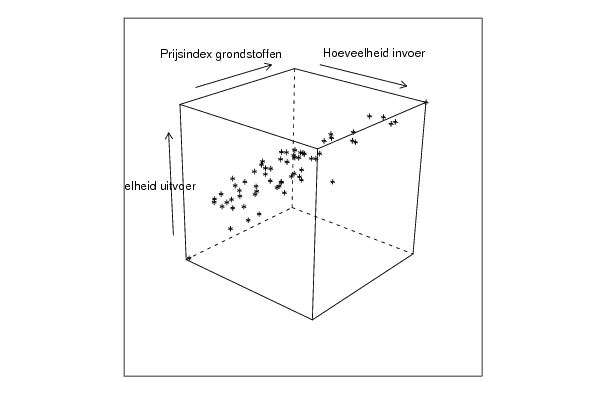
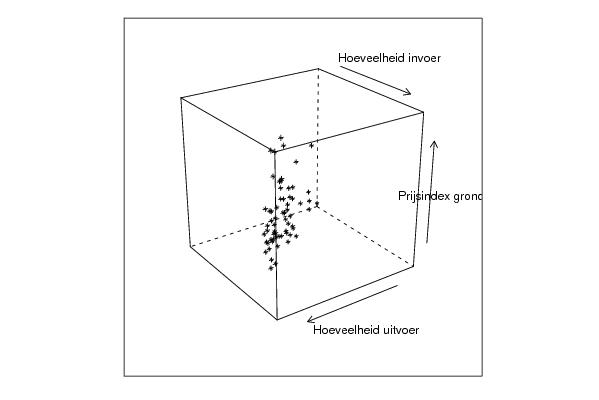
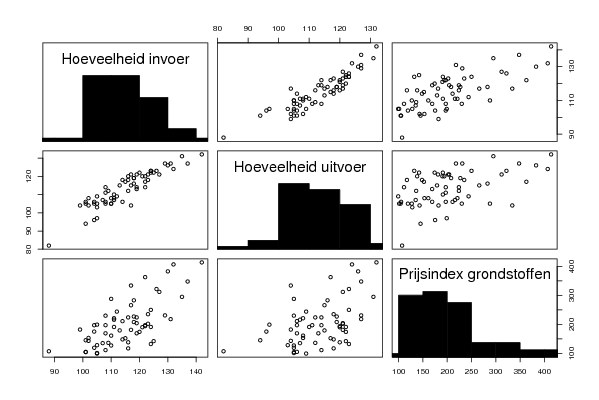
In dit model vind je 3 soorten grafieken, de kubussen, een matrix en bivariate density plots.
Bij de kubussen moet echter wel opletten bij de visuele interpretatie.

Zij geven ons een verkeerd beeld, er is niet echt een duidelijk patroon te zien. Dit is logisch aangezien het een 3D figuur betreft die op een 2D scherm wordt geprojecteerd. Je kan niet zien hoe de afstand tussen de punten zich verhoudt. De punten worden meer op 1 lijn geprojecteerd (2D scherm).
In de matrix daaronder krijg je dan een projectie van de kubussen (scatterplots), deze kunnen wederom een verkeerd beeld geven aangezien je nog een dimensie moet toevoegen. Op de hoofddiagonaal staan de histogrammen.
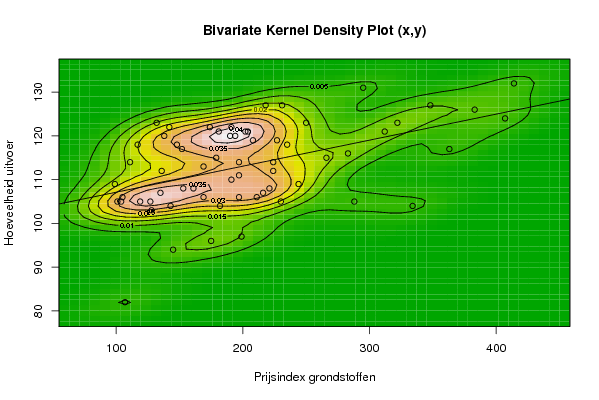
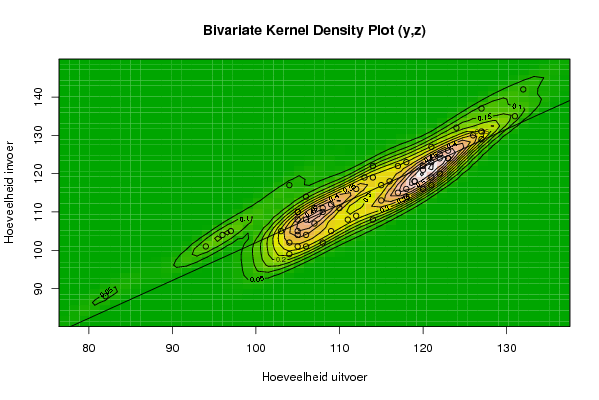
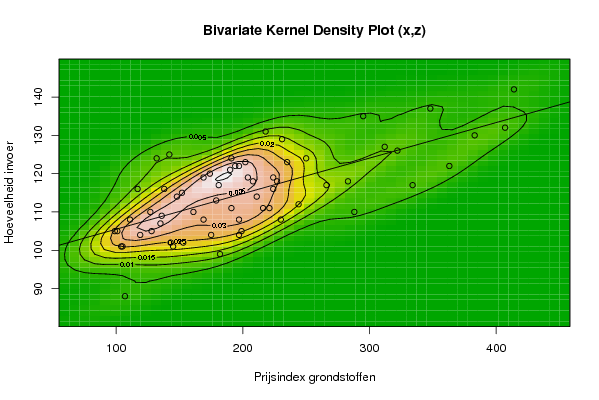
Uit de bovenstaande scatterplots wordt dan een bivariate Kernel density plot getekend.
Hier wordt wederom zoals bij Q1 gewerkt met hoogtelijnen die punten met een zelfde dichtheid gaan verbinden. Aangezien je hier duidelijk clusters kunt waarnemen, geeft dit plot meer en duidelijkere info dan een scatterplot & correlatie.

Post a new message
Dataseries X:
101
104
99
105
107
111
117
119
127
128
135
132
136
143
142
153
145
138
148
152
169
169
161
174
179
191
190
182
175
181
197
194
197
216
221
218
230
227
204
197
199
208
191
202
211
224
224
231
244
235
250
266
288
283
295
312
334
348
383
407
414
363
322
Dataseries Y:
105
105
109
106
82
114
118
105
105
103
107
123
112
104
122
108
94
120
118
117
113
106
108
122
115
110
120
104
96
121
111
120
114
107
108
127
105
119
121
106
97
119
122
121
106
114
112
127
109
118
123
115
105
116
131
121
104
127
126
124
132
117
123
Dataseries Z:
105
101
105
101
88
108
116
104
110
105
107
124
109
102
125
102
101
116
114
115
119
108
110
120
113
111
121
99
104
117
108
122
122
111
111
131
108
118
119
104
105
118
124
123
114
119
116
129
112
123
124
117
110
118
135
127
117
137
130
132
142
122
126


Summary of computational transaction
Raw Inputview raw input (R code)
Raw Outputview raw output of R engine
Computing time3 seconds
R Server'Gwilym Jenkins' @ 72.249.127.135

\begin{tabular}{lllllllll}
\hline
Summary of computational transaction \tabularnewline
Raw Input & view raw input (R code)  \tabularnewline
Raw Output & view raw output of R engine  \tabularnewline
Computing time & 3 seconds \tabularnewline
R Server & 'Gwilym Jenkins' @ 72.249.127.135 \tabularnewline
\hline
\end{tabular}
%Source: https://freestatistics.org/blog/index.php?pk=23211&T=0

[TABLE]
[ROW][C]Summary of computational transaction[/C][/ROW]
[ROW][C]Raw Input[/C][C]view raw input (R code) [/C][/ROW]
[ROW][C]Raw Output[/C][C]view raw output of R engine [/C][/ROW]
[ROW][C]Computing time[/C][C]3 seconds[/C][/ROW]
[ROW][C]R Server[/C][C]'Gwilym Jenkins' @ 72.249.127.135[/C][/ROW]
[/TABLE]
Source: https://freestatistics.org/blog/index.php?pk=23211&T=0

Globally Unique Identifier (entire table): ba.freestatistics.org/blog/index.php?pk=23211&T=0

As an alternative you can also use a QR Code:  

The GUIDs for individual cells are displayed in the table below:

Summary of computational transaction
Raw Inputview raw input (R code)
Raw Outputview raw output of R engine
Computing time3 seconds
R Server'Gwilym Jenkins' @ 72.249.127.135


Parameters (Session):
par1 = 50 ; par2 = 50 ; par3 = Y ; par4 = Y ; par5 = Prijsindex grondstoffen ; par6 = Hoeveelheid uitvoer ; par7 = Hoeveelheid invoer ;
Parameters (R input):
par1 = 50 ; par2 = 50 ; par3 = Y ; par4 = Y ; par5 = Prijsindex grondstoffen ; par6 = Hoeveelheid uitvoer ; par7 = Hoeveelheid invoer ;
R code (references can be found in the software module):
x <- array(x,dim=c(length(x),1))
colnames(x) <- par5
y <- array(y,dim=c(length(y),1))
colnames(y) <- par6
z <- array(z,dim=c(length(z),1))
colnames(z) <- par7
d <- data.frame(cbind(z,y,x))
colnames(d) <- list(par7,par6,par5)
par1 <- as.numeric(par1)
par2 <- as.numeric(par2)
if (par1>500) par1 <- 500
if (par2>500) par2 <- 500
if (par1<10) par1 <- 10
if (par2<10) par2 <- 10
library(GenKern)
library(lattice)
panel.hist <- function(x, ...)
{
usr <- par('usr'); on.exit(par(usr))
par(usr = c(usr[1:2], 0, 1.5) )
h <- hist(x, plot = FALSE)
breaks <- h$breaks; nB <- length(breaks)
y <- h$counts; y <- y/max(y)
rect(breaks[-nB], 0, breaks[-1], y, col='black', ...)
}
bitmap(file='cloud1.png')
cloud(z~x*y, screen = list(x=-45, y=45, z=35),xlab=par5,ylab=par6,zlab=par7)
dev.off()
bitmap(file='cloud2.png')
cloud(z~x*y, screen = list(x=35, y=45, z=25),xlab=par5,ylab=par6,zlab=par7)
dev.off()
bitmap(file='cloud3.png')
cloud(z~x*y, screen = list(x=35, y=-25, z=90),xlab=par5,ylab=par6,zlab=par7)
dev.off()
bitmap(file='pairs.png')
pairs(d,diag.panel=panel.hist)
dev.off()
x <- as.vector(x)
y <- as.vector(y)
z <- as.vector(z)
bitmap(file='bidensity1.png')
op <- KernSur(x,y, xgridsize=par1, ygridsize=par2, correlation=cor(x,y), xbandwidth=dpik(x), ybandwidth=dpik(y))
image(op$xords, op$yords, op$zden, col=terrain.colors(100), axes=TRUE,main='Bivariate Kernel Density Plot (x,y)',xlab=par5,ylab=par6)
if (par3=='Y') contour(op$xords, op$yords, op$zden, add=TRUE)
if (par4=='Y') points(x,y)
(r<-lm(y ~ x))
abline(r)
box()
dev.off()
bitmap(file='bidensity2.png')
op <- KernSur(y,z, xgridsize=par1, ygridsize=par2, correlation=cor(y,z), xbandwidth=dpik(y), ybandwidth=dpik(z))
op
image(op$xords, op$yords, op$zden, col=terrain.colors(100), axes=TRUE,main='Bivariate Kernel Density Plot (y,z)',xlab=par6,ylab=par7)
if (par3=='Y') contour(op$xords, op$yords, op$zden, add=TRUE)
if (par4=='Y') points(y,z)
(r<-lm(z ~ y))
abline(r)
box()
dev.off()
bitmap(file='bidensity3.png')
op <- KernSur(x,z, xgridsize=par1, ygridsize=par2, correlation=cor(x,z), xbandwidth=dpik(x), ybandwidth=dpik(z))
op
image(op$xords, op$yords, op$zden, col=terrain.colors(100), axes=TRUE,main='Bivariate Kernel Density Plot (x,z)',xlab=par5,ylab=par7)
if (par3=='Y') contour(op$xords, op$yords, op$zden, add=TRUE)
if (par4=='Y') points(x,z)
(r<-lm(z ~ x))
abline(r)
box()
dev.off()