Free Statistics

of Irreproducible Research!

Author's title

Author*Unverified author*
R Software Modulerwasp_hierarchicalclustering.wasp
Title produced by softwareHierarchical Clustering
Date of computationTue, 11 Nov 2008 07:39:45 -0700
Cite this page as followsStatistical Computations at FreeStatistics.org, Office for Research Development and Education, URL https://freestatistics.org/blog/index.php?v=date/2008/Nov/11/t1226414531k3b51gt9o2d6ktk.htm/, Retrieved Sun, 19 May 2024 04:52:00 +0000
Statistical Computations at FreeStatistics.org, Office for Research Development and Education, URL https://freestatistics.org/blog/index.php?pk=23544, Retrieved Sun, 19 May 2024 04:52:00 +0000
QR Codes:

Original text written by user:
IsPrivate?No (this computation is public)
User-defined keywords
Estimated Impact120
Family? (F = Feedback message, R = changed R code, M = changed R Module, P = changed Parameters, D = changed Data)
-       [Hierarchical Clustering] [] [2008-11-11 14:39:45] [8767719db498704e1fee27044c098ad0] [Current]
Feedback Forum

Post a new message
Dataseries X:
113.5	86.7	105.1
121.2	123.6	106.1
130.4	125.3	106.2
115.2	111.1	103.9
117.9	98.4	109.2
110.7	102.3	110.5
107.6	105	98
124.3	128.2	94.1
115.1	124.7	90.2
112.5	116.1	89.5
127.9	131.2	91.2
117.4	97.7	98.2
119.3	88.8	103.7
130.4	132.8	103.9
126	113.9	106.5
125.4	112.6	107.2
130.5	104.3	111
115.9	107.5	111.8
108.7	106	101.5
124	117.3	95.3
119.4	123.1	92.7
118.6	114.3	93.5
131.3	132	96.2
111.1	92.3	102.1
124.8	93.7	102.3
132.3	121.3	127.9
126.7	113.6	130.8
131.7	116.3	134.9
130.9	98.3	141.9
122.1	111.9	124.6
113.2	109.3	118
133.6	133.2	115.1
119.2	118	111.2
129.4	131.6	113.5
131.4	134.1	115.2
117.1	96.7	119.4
130.5	99.8	116
132.3	128.3	115.7
140.8	134.9	121.1
137.5	130.7	120.8
128.6	107.3	125.2
126.7	121.6	124
120.8	120.6	119.1
139.3	140.5	119.2
128.6	124.8	113.9
131.3	129.9	113.3
136.3	159.4	116.8
128.8	111	114.8
133.2	110.1	119.2
136.3	132.7	117.8
151.1	135	122.5
145	118.6	125.1
134.4	94	125
135.7	117.9	125.1
128.7	114.7	121.2
129.2	113.6	118.9
138.6	130.6	109.8
132.7	117.1	109.2
132.5	123.2	109
137.3	106.1	110.9
127.1	87.9	112.5


Summary of computational transaction
Raw Inputview raw input (R code)
Raw Outputview raw output of R engine
Computing time2 seconds
R Server'Sir Ronald Aylmer Fisher' @ 193.190.124.24

\begin{tabular}{lllllllll}
\hline
Summary of computational transaction \tabularnewline
Raw Input & view raw input (R code)  \tabularnewline
Raw Output & view raw output of R engine  \tabularnewline
Computing time & 2 seconds \tabularnewline
R Server & 'Sir Ronald Aylmer Fisher' @ 193.190.124.24 \tabularnewline
\hline
\end{tabular}
%Source: https://freestatistics.org/blog/index.php?pk=23544&T=0

[TABLE]
[ROW][C]Summary of computational transaction[/C][/ROW]
[ROW][C]Raw Input[/C][C]view raw input (R code) [/C][/ROW]
[ROW][C]Raw Output[/C][C]view raw output of R engine [/C][/ROW]
[ROW][C]Computing time[/C][C]2 seconds[/C][/ROW]
[ROW][C]R Server[/C][C]'Sir Ronald Aylmer Fisher' @ 193.190.124.24[/C][/ROW]
[/TABLE]
Source: https://freestatistics.org/blog/index.php?pk=23544&T=0

Globally Unique Identifier (entire table): ba.freestatistics.org/blog/index.php?pk=23544&T=0

As an alternative you can also use a QR Code:  

The GUIDs for individual cells are displayed in the table below:

Summary of computational transaction
Raw Inputview raw input (R code)
Raw Outputview raw output of R engine
Computing time2 seconds
R Server'Sir Ronald Aylmer Fisher' @ 193.190.124.24


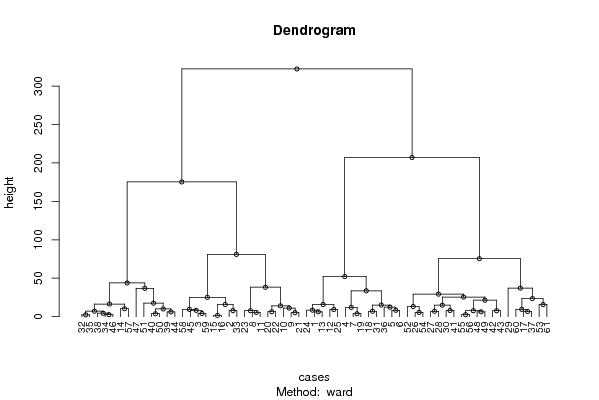
Summary of Dendrogram
LabelHeight
11.59373774505093
22.37907545067406
32.55734237050888
42.59807621135332
53.8
63.80263066836631
74.0816663263917
84.45829581190374
95.22494019104526
105.51089829338194
115.56417109729741
126.10081961706785
136.28728876384725
146.32534584034738
156.43428317685817
166.72681202353685
176.99785681476836
187.00713921654193
197.12985858732804
207.72056151345617
217.72072343062587
227.73433901506781
237.83390068867356
247.98561206170198
258.23086333139814
268.29095893126965
278.45776221595458
289.35788437628932
299.444386101224
309.5011180359823
3110.0061742748590
3210.3387620148642
3311.1573442569792
3412.0628499055602
3512.3572457285955
3613.217693603268
3714.0962442452182
3814.9474800593632
3915.1424468017548
4015.708278072405
4115.7579726898407
4215.7993345108026
4316.4272226075348
4417.5738266508734
4521.3917294064651
4623.5299040561548
4725.1470872866848
4825.5296376968808
4929.3247832914832
5033.6304876040799
5136.8822336342844
5237.1652889749875
5338.2736682570203
5443.8804750691244
5552.2488348693888
5675.5357412480829
5781.0028999603408
58175.362324679967
59207.207751472331
60322.391421966265

\begin{tabular}{lllllllll}
\hline
Summary of Dendrogram \tabularnewline
Label & Height \tabularnewline
1 & 1.59373774505093 \tabularnewline
2 & 2.37907545067406 \tabularnewline
3 & 2.55734237050888 \tabularnewline
4 & 2.59807621135332 \tabularnewline
5 & 3.8 \tabularnewline
6 & 3.80263066836631 \tabularnewline
7 & 4.0816663263917 \tabularnewline
8 & 4.45829581190374 \tabularnewline
9 & 5.22494019104526 \tabularnewline
10 & 5.51089829338194 \tabularnewline
11 & 5.56417109729741 \tabularnewline
12 & 6.10081961706785 \tabularnewline
13 & 6.28728876384725 \tabularnewline
14 & 6.32534584034738 \tabularnewline
15 & 6.43428317685817 \tabularnewline
16 & 6.72681202353685 \tabularnewline
17 & 6.99785681476836 \tabularnewline
18 & 7.00713921654193 \tabularnewline
19 & 7.12985858732804 \tabularnewline
20 & 7.72056151345617 \tabularnewline
21 & 7.72072343062587 \tabularnewline
22 & 7.73433901506781 \tabularnewline
23 & 7.83390068867356 \tabularnewline
24 & 7.98561206170198 \tabularnewline
25 & 8.23086333139814 \tabularnewline
26 & 8.29095893126965 \tabularnewline
27 & 8.45776221595458 \tabularnewline
28 & 9.35788437628932 \tabularnewline
29 & 9.444386101224 \tabularnewline
30 & 9.5011180359823 \tabularnewline
31 & 10.0061742748590 \tabularnewline
32 & 10.3387620148642 \tabularnewline
33 & 11.1573442569792 \tabularnewline
34 & 12.0628499055602 \tabularnewline
35 & 12.3572457285955 \tabularnewline
36 & 13.217693603268 \tabularnewline
37 & 14.0962442452182 \tabularnewline
38 & 14.9474800593632 \tabularnewline
39 & 15.1424468017548 \tabularnewline
40 & 15.708278072405 \tabularnewline
41 & 15.7579726898407 \tabularnewline
42 & 15.7993345108026 \tabularnewline
43 & 16.4272226075348 \tabularnewline
44 & 17.5738266508734 \tabularnewline
45 & 21.3917294064651 \tabularnewline
46 & 23.5299040561548 \tabularnewline
47 & 25.1470872866848 \tabularnewline
48 & 25.5296376968808 \tabularnewline
49 & 29.3247832914832 \tabularnewline
50 & 33.6304876040799 \tabularnewline
51 & 36.8822336342844 \tabularnewline
52 & 37.1652889749875 \tabularnewline
53 & 38.2736682570203 \tabularnewline
54 & 43.8804750691244 \tabularnewline
55 & 52.2488348693888 \tabularnewline
56 & 75.5357412480829 \tabularnewline
57 & 81.0028999603408 \tabularnewline
58 & 175.362324679967 \tabularnewline
59 & 207.207751472331 \tabularnewline
60 & 322.391421966265 \tabularnewline
\hline
\end{tabular}
%Source: https://freestatistics.org/blog/index.php?pk=23544&T=1

[TABLE]
[ROW][C]Summary of Dendrogram[/C][/ROW]
[ROW][C]Label[/C][C]Height[/C][/ROW]
[ROW][C]1[/C][C]1.59373774505093[/C][/ROW]
[ROW][C]2[/C][C]2.37907545067406[/C][/ROW]
[ROW][C]3[/C][C]2.55734237050888[/C][/ROW]
[ROW][C]4[/C][C]2.59807621135332[/C][/ROW]
[ROW][C]5[/C][C]3.8[/C][/ROW]
[ROW][C]6[/C][C]3.80263066836631[/C][/ROW]
[ROW][C]7[/C][C]4.0816663263917[/C][/ROW]
[ROW][C]8[/C][C]4.45829581190374[/C][/ROW]
[ROW][C]9[/C][C]5.22494019104526[/C][/ROW]
[ROW][C]10[/C][C]5.51089829338194[/C][/ROW]
[ROW][C]11[/C][C]5.56417109729741[/C][/ROW]
[ROW][C]12[/C][C]6.10081961706785[/C][/ROW]
[ROW][C]13[/C][C]6.28728876384725[/C][/ROW]
[ROW][C]14[/C][C]6.32534584034738[/C][/ROW]
[ROW][C]15[/C][C]6.43428317685817[/C][/ROW]
[ROW][C]16[/C][C]6.72681202353685[/C][/ROW]
[ROW][C]17[/C][C]6.99785681476836[/C][/ROW]
[ROW][C]18[/C][C]7.00713921654193[/C][/ROW]
[ROW][C]19[/C][C]7.12985858732804[/C][/ROW]
[ROW][C]20[/C][C]7.72056151345617[/C][/ROW]
[ROW][C]21[/C][C]7.72072343062587[/C][/ROW]
[ROW][C]22[/C][C]7.73433901506781[/C][/ROW]
[ROW][C]23[/C][C]7.83390068867356[/C][/ROW]
[ROW][C]24[/C][C]7.98561206170198[/C][/ROW]
[ROW][C]25[/C][C]8.23086333139814[/C][/ROW]
[ROW][C]26[/C][C]8.29095893126965[/C][/ROW]
[ROW][C]27[/C][C]8.45776221595458[/C][/ROW]
[ROW][C]28[/C][C]9.35788437628932[/C][/ROW]
[ROW][C]29[/C][C]9.444386101224[/C][/ROW]
[ROW][C]30[/C][C]9.5011180359823[/C][/ROW]
[ROW][C]31[/C][C]10.0061742748590[/C][/ROW]
[ROW][C]32[/C][C]10.3387620148642[/C][/ROW]
[ROW][C]33[/C][C]11.1573442569792[/C][/ROW]
[ROW][C]34[/C][C]12.0628499055602[/C][/ROW]
[ROW][C]35[/C][C]12.3572457285955[/C][/ROW]
[ROW][C]36[/C][C]13.217693603268[/C][/ROW]
[ROW][C]37[/C][C]14.0962442452182[/C][/ROW]
[ROW][C]38[/C][C]14.9474800593632[/C][/ROW]
[ROW][C]39[/C][C]15.1424468017548[/C][/ROW]
[ROW][C]40[/C][C]15.708278072405[/C][/ROW]
[ROW][C]41[/C][C]15.7579726898407[/C][/ROW]
[ROW][C]42[/C][C]15.7993345108026[/C][/ROW]
[ROW][C]43[/C][C]16.4272226075348[/C][/ROW]
[ROW][C]44[/C][C]17.5738266508734[/C][/ROW]
[ROW][C]45[/C][C]21.3917294064651[/C][/ROW]
[ROW][C]46[/C][C]23.5299040561548[/C][/ROW]
[ROW][C]47[/C][C]25.1470872866848[/C][/ROW]
[ROW][C]48[/C][C]25.5296376968808[/C][/ROW]
[ROW][C]49[/C][C]29.3247832914832[/C][/ROW]
[ROW][C]50[/C][C]33.6304876040799[/C][/ROW]
[ROW][C]51[/C][C]36.8822336342844[/C][/ROW]
[ROW][C]52[/C][C]37.1652889749875[/C][/ROW]
[ROW][C]53[/C][C]38.2736682570203[/C][/ROW]
[ROW][C]54[/C][C]43.8804750691244[/C][/ROW]
[ROW][C]55[/C][C]52.2488348693888[/C][/ROW]
[ROW][C]56[/C][C]75.5357412480829[/C][/ROW]
[ROW][C]57[/C][C]81.0028999603408[/C][/ROW]
[ROW][C]58[/C][C]175.362324679967[/C][/ROW]
[ROW][C]59[/C][C]207.207751472331[/C][/ROW]
[ROW][C]60[/C][C]322.391421966265[/C][/ROW]
[/TABLE]
Source: https://freestatistics.org/blog/index.php?pk=23544&T=1

Globally Unique Identifier (entire table): ba.freestatistics.org/blog/index.php?pk=23544&T=1

As an alternative you can also use a QR Code:  

The GUIDs for individual cells are displayed in the table below:

Summary of Dendrogram
LabelHeight
11.59373774505093
22.37907545067406
32.55734237050888
42.59807621135332
53.8
63.80263066836631
74.0816663263917
84.45829581190374
95.22494019104526
105.51089829338194
115.56417109729741
126.10081961706785
136.28728876384725
146.32534584034738
156.43428317685817
166.72681202353685
176.99785681476836
187.00713921654193
197.12985858732804
207.72056151345617
217.72072343062587
227.73433901506781
237.83390068867356
247.98561206170198
258.23086333139814
268.29095893126965
278.45776221595458
289.35788437628932
299.444386101224
309.5011180359823
3110.0061742748590
3210.3387620148642
3311.1573442569792
3412.0628499055602
3512.3572457285955
3613.217693603268
3714.0962442452182
3814.9474800593632
3915.1424468017548
4015.708278072405
4115.7579726898407
4215.7993345108026
4316.4272226075348
4417.5738266508734
4521.3917294064651
4623.5299040561548
4725.1470872866848
4825.5296376968808
4929.3247832914832
5033.6304876040799
5136.8822336342844
5237.1652889749875
5338.2736682570203
5443.8804750691244
5552.2488348693888
5675.5357412480829
5781.0028999603408
58175.362324679967
59207.207751472331
60322.391421966265


Parameters (Session):
par1 = ward ; par2 = ALL ; par3 = FALSE ; par4 = FALSE ;
Parameters (R input):
par1 = ward ; par2 = ALL ; par3 = FALSE ; par4 = FALSE ;
R code (references can be found in the software module):
par3 <- as.logical(par3)
par4 <- as.logical(par4)
if (par3 == 'TRUE'){
dum = xlab
xlab = ylab
ylab = dum
}
x <- t(y)
hc <- hclust(dist(x),method=par1)
d <- as.dendrogram(hc)
str(d)
mysub <- paste('Method: ',par1)
bitmap(file='test1.png')
if (par4 == 'TRUE'){
plot(d,main=main,ylab=ylab,xlab=xlab,horiz=par3, nodePar=list(pch = c(1,NA), cex=0.8, lab.cex = 0.8),type='t',center=T, sub=mysub)
} else {
plot(d,main=main,ylab=ylab,xlab=xlab,horiz=par3, nodePar=list(pch = c(1,NA), cex=0.8, lab.cex = 0.8), sub=mysub)
}
dev.off()
if (par2 != 'ALL'){
if (par3 == 'TRUE'){
ylab = 'cluster'
} else {
xlab = 'cluster'
}
par2 <- as.numeric(par2)
memb <- cutree(hc, k = par2)
cent <- NULL
for(k in 1:par2){
cent <- rbind(cent, colMeans(x[memb == k, , drop = FALSE]))
}
hc1 <- hclust(dist(cent),method=par1, members = table(memb))
de <- as.dendrogram(hc1)
bitmap(file='test2.png')
if (par4 == 'TRUE'){
plot(de,main=main,ylab=ylab,xlab=xlab,horiz=par3, nodePar=list(pch = c(1,NA), cex=0.8, lab.cex = 0.8),type='t',center=T, sub=mysub)
} else {
plot(de,main=main,ylab=ylab,xlab=xlab,horiz=par3, nodePar=list(pch = c(1,NA), cex=0.8, lab.cex = 0.8), sub=mysub)
}
dev.off()
str(de)
}
load(file='createtable')
a<-table.start()
a<-table.row.start(a)
a<-table.element(a,'Summary of Dendrogram',2,TRUE)
a<-table.row.end(a)
a<-table.row.start(a)
a<-table.element(a,'Label',header=TRUE)
a<-table.element(a,'Height',header=TRUE)
a<-table.row.end(a)
num <- length(x[,1])-1
for (i in 1:num)
{
a<-table.row.start(a)
a<-table.element(a,hc$labels[i])
a<-table.element(a,hc$height[i])
a<-table.row.end(a)
}
a<-table.end(a)
table.save(a,file='mytable1.tab')
if (par2 != 'ALL'){
a<-table.start()
a<-table.row.start(a)
a<-table.element(a,'Summary of Cut Dendrogram',2,TRUE)
a<-table.row.end(a)
a<-table.row.start(a)
a<-table.element(a,'Label',header=TRUE)
a<-table.element(a,'Height',header=TRUE)
a<-table.row.end(a)
num <- par2-1
for (i in 1:num)
{
a<-table.row.start(a)
a<-table.element(a,i)
a<-table.element(a,hc1$height[i])
a<-table.row.end(a)
}
a<-table.end(a)
table.save(a,file='mytable2.tab')
}