Free Statistics

of Irreproducible Research!

Author's title

Author*The author of this computation has been verified*
R Software Modulerwasp_hierarchicalclustering.wasp
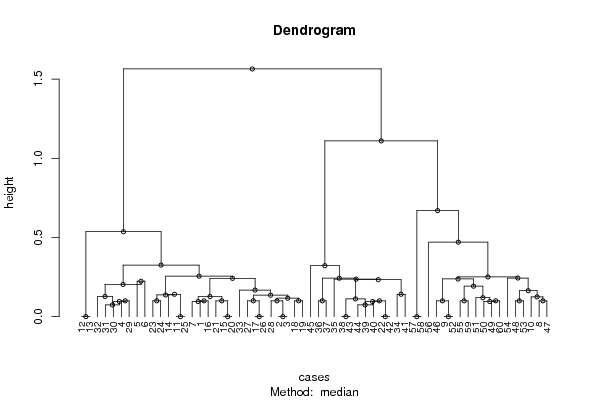
Title produced by softwareHierarchical Clustering
Date of computationTue, 11 Nov 2008 07:43:10 -0700
Cite this page as followsStatistical Computations at FreeStatistics.org, Office for Research Development and Education, URL https://freestatistics.org/blog/index.php?v=date/2008/Nov/11/t1226414653m0ykwhscq1bkkzu.htm/, Retrieved Mon, 27 May 2024 00:34:31 +0000
Statistical Computations at FreeStatistics.org, Office for Research Development and Education, URL https://freestatistics.org/blog/index.php?pk=23545, Retrieved Mon, 27 May 2024 00:34:31 +0000
QR Codes:

Original text written by user:
IsPrivate?No (this computation is public)
User-defined keywordseda
Estimated Impact123
Family? (F = Feedback message, R = changed R code, M = changed R Module, P = changed Parameters, D = changed Data)
-       [Hierarchical Clustering] [eda] [2008-11-11 14:43:10] [783db4b4a0f63b73ca8b14666b7f4329] [Current]
Feedback Forum

Post a new message
Dataseries X:
8.4	7.6
8.4	7.9
8.4	7.9
8.6	8.1
8.9	8.2
8.8	8
8.3	7.5
7.5	6.8
7.2	6.5
7.5	6.6
8.8	7.6
9.3	8
9.3	8
8.7	7.7
8.2	7.5
8.3	7.6
8.5	7.7
8.6	7.9
8.6	7.8
8.2	7.5
8.1	7.5
8	7.1
8.6	7.5
8.7	7.5
8.8	7.6
8.5	7.7
8.4	7.7
8.5	7.9
8.7	8.1
8.7	8.2
8.6	8.2
8.5	8.1
8.3	7.9
8.1	7.3
8.2	6.9
8.1	6.6
8.1	6.7
7.9	6.9
7.9	7
7.9	7.1
8	7.2
8	7.1
7.9	6.9
8	7
7.7	6.8
7.2	6.4
7.5	6.7
7.3	6.7
7	6.4
7	6.3
7	6.2
7.2	6.5
7.3	6.8
7.1	6.8
6.8	6.5
6.6	6.3
6.2	5.9
6.2	5.9
6.8	6.4
6.9	6.4


Summary of computational transaction
Raw Inputview raw input (R code)
Raw Outputview raw output of R engine
Computing time3 seconds
R Server'Herman Ole Andreas Wold' @ 193.190.124.10:1001

\begin{tabular}{lllllllll}
\hline
Summary of computational transaction \tabularnewline
Raw Input & view raw input (R code)  \tabularnewline
Raw Output & view raw output of R engine  \tabularnewline
Computing time & 3 seconds \tabularnewline
R Server & 'Herman Ole Andreas Wold' @ 193.190.124.10:1001 \tabularnewline
\hline
\end{tabular}
%Source: https://freestatistics.org/blog/index.php?pk=23545&T=0

[TABLE]
[ROW][C]Summary of computational transaction[/C][/ROW]
[ROW][C]Raw Input[/C][C]view raw input (R code) [/C][/ROW]
[ROW][C]Raw Output[/C][C]view raw output of R engine [/C][/ROW]
[ROW][C]Computing time[/C][C]3 seconds[/C][/ROW]
[ROW][C]R Server[/C][C]'Herman Ole Andreas Wold' @ 193.190.124.10:1001[/C][/ROW]
[/TABLE]
Source: https://freestatistics.org/blog/index.php?pk=23545&T=0

Globally Unique Identifier (entire table): ba.freestatistics.org/blog/index.php?pk=23545&T=0

As an alternative you can also use a QR Code:  

The GUIDs for individual cells are displayed in the table below:

Summary of computational transaction
Raw Inputview raw input (R code)
Raw Outputview raw output of R engine
Computing time3 seconds
R Server'Herman Ole Andreas Wold' @ 193.190.124.10:1001


Summary of Dendrogram
LabelHeight
10
20
30
40
50
60
70
80
90
100.0999999999999996
110.0957106781186544
120.0999999999999996
130.0999999999999996
140.0957106781186544
150.0739276695296634
160.0999999999999996
170.0999999999999996
180.0999999999999996
190.0999999999999996
200.0999999999999996
210.0957106781186544
220.0739276695296634
230.0999999999999996
240.0999999999999996
250.0999999999999996
260.0957106781186552
270.0999999999999996
280.100000000000001
290.100000000000001
300.111965775690154
310.116257038496822
320.119474029907831
330.125000000000000
340.126680170189601
350.127416625408901
360.135772147839775
370.141421356237309
380.141421356237311
390.136803398874990
400.163764076993644
410.167665681536207
420.192637566165745
430.223606797749978
440.203638574129825
450.233575236983772
460.236796551348809
470.237949732487488
480.24191805827237
490.242781447044397
500.243927899384294
510.250638161858732
520.255433915010614
530.321814428414466
540.32559044102776
550.470423569231658
560.536480732139349
570.66983059343549
581.11005241504288
591.56422665585449

\begin{tabular}{lllllllll}
\hline
Summary of Dendrogram \tabularnewline
Label & Height \tabularnewline
1 & 0 \tabularnewline
2 & 0 \tabularnewline
3 & 0 \tabularnewline
4 & 0 \tabularnewline
5 & 0 \tabularnewline
6 & 0 \tabularnewline
7 & 0 \tabularnewline
8 & 0 \tabularnewline
9 & 0 \tabularnewline
10 & 0.0999999999999996 \tabularnewline
11 & 0.0957106781186544 \tabularnewline
12 & 0.0999999999999996 \tabularnewline
13 & 0.0999999999999996 \tabularnewline
14 & 0.0957106781186544 \tabularnewline
15 & 0.0739276695296634 \tabularnewline
16 & 0.0999999999999996 \tabularnewline
17 & 0.0999999999999996 \tabularnewline
18 & 0.0999999999999996 \tabularnewline
19 & 0.0999999999999996 \tabularnewline
20 & 0.0999999999999996 \tabularnewline
21 & 0.0957106781186544 \tabularnewline
22 & 0.0739276695296634 \tabularnewline
23 & 0.0999999999999996 \tabularnewline
24 & 0.0999999999999996 \tabularnewline
25 & 0.0999999999999996 \tabularnewline
26 & 0.0957106781186552 \tabularnewline
27 & 0.0999999999999996 \tabularnewline
28 & 0.100000000000001 \tabularnewline
29 & 0.100000000000001 \tabularnewline
30 & 0.111965775690154 \tabularnewline
31 & 0.116257038496822 \tabularnewline
32 & 0.119474029907831 \tabularnewline
33 & 0.125000000000000 \tabularnewline
34 & 0.126680170189601 \tabularnewline
35 & 0.127416625408901 \tabularnewline
36 & 0.135772147839775 \tabularnewline
37 & 0.141421356237309 \tabularnewline
38 & 0.141421356237311 \tabularnewline
39 & 0.136803398874990 \tabularnewline
40 & 0.163764076993644 \tabularnewline
41 & 0.167665681536207 \tabularnewline
42 & 0.192637566165745 \tabularnewline
43 & 0.223606797749978 \tabularnewline
44 & 0.203638574129825 \tabularnewline
45 & 0.233575236983772 \tabularnewline
46 & 0.236796551348809 \tabularnewline
47 & 0.237949732487488 \tabularnewline
48 & 0.24191805827237 \tabularnewline
49 & 0.242781447044397 \tabularnewline
50 & 0.243927899384294 \tabularnewline
51 & 0.250638161858732 \tabularnewline
52 & 0.255433915010614 \tabularnewline
53 & 0.321814428414466 \tabularnewline
54 & 0.32559044102776 \tabularnewline
55 & 0.470423569231658 \tabularnewline
56 & 0.536480732139349 \tabularnewline
57 & 0.66983059343549 \tabularnewline
58 & 1.11005241504288 \tabularnewline
59 & 1.56422665585449 \tabularnewline
\hline
\end{tabular}
%Source: https://freestatistics.org/blog/index.php?pk=23545&T=1

[TABLE]
[ROW][C]Summary of Dendrogram[/C][/ROW]
[ROW][C]Label[/C][C]Height[/C][/ROW]
[ROW][C]1[/C][C]0[/C][/ROW]
[ROW][C]2[/C][C]0[/C][/ROW]
[ROW][C]3[/C][C]0[/C][/ROW]
[ROW][C]4[/C][C]0[/C][/ROW]
[ROW][C]5[/C][C]0[/C][/ROW]
[ROW][C]6[/C][C]0[/C][/ROW]
[ROW][C]7[/C][C]0[/C][/ROW]
[ROW][C]8[/C][C]0[/C][/ROW]
[ROW][C]9[/C][C]0[/C][/ROW]
[ROW][C]10[/C][C]0.0999999999999996[/C][/ROW]
[ROW][C]11[/C][C]0.0957106781186544[/C][/ROW]
[ROW][C]12[/C][C]0.0999999999999996[/C][/ROW]
[ROW][C]13[/C][C]0.0999999999999996[/C][/ROW]
[ROW][C]14[/C][C]0.0957106781186544[/C][/ROW]
[ROW][C]15[/C][C]0.0739276695296634[/C][/ROW]
[ROW][C]16[/C][C]0.0999999999999996[/C][/ROW]
[ROW][C]17[/C][C]0.0999999999999996[/C][/ROW]
[ROW][C]18[/C][C]0.0999999999999996[/C][/ROW]
[ROW][C]19[/C][C]0.0999999999999996[/C][/ROW]
[ROW][C]20[/C][C]0.0999999999999996[/C][/ROW]
[ROW][C]21[/C][C]0.0957106781186544[/C][/ROW]
[ROW][C]22[/C][C]0.0739276695296634[/C][/ROW]
[ROW][C]23[/C][C]0.0999999999999996[/C][/ROW]
[ROW][C]24[/C][C]0.0999999999999996[/C][/ROW]
[ROW][C]25[/C][C]0.0999999999999996[/C][/ROW]
[ROW][C]26[/C][C]0.0957106781186552[/C][/ROW]
[ROW][C]27[/C][C]0.0999999999999996[/C][/ROW]
[ROW][C]28[/C][C]0.100000000000001[/C][/ROW]
[ROW][C]29[/C][C]0.100000000000001[/C][/ROW]
[ROW][C]30[/C][C]0.111965775690154[/C][/ROW]
[ROW][C]31[/C][C]0.116257038496822[/C][/ROW]
[ROW][C]32[/C][C]0.119474029907831[/C][/ROW]
[ROW][C]33[/C][C]0.125000000000000[/C][/ROW]
[ROW][C]34[/C][C]0.126680170189601[/C][/ROW]
[ROW][C]35[/C][C]0.127416625408901[/C][/ROW]
[ROW][C]36[/C][C]0.135772147839775[/C][/ROW]
[ROW][C]37[/C][C]0.141421356237309[/C][/ROW]
[ROW][C]38[/C][C]0.141421356237311[/C][/ROW]
[ROW][C]39[/C][C]0.136803398874990[/C][/ROW]
[ROW][C]40[/C][C]0.163764076993644[/C][/ROW]
[ROW][C]41[/C][C]0.167665681536207[/C][/ROW]
[ROW][C]42[/C][C]0.192637566165745[/C][/ROW]
[ROW][C]43[/C][C]0.223606797749978[/C][/ROW]
[ROW][C]44[/C][C]0.203638574129825[/C][/ROW]
[ROW][C]45[/C][C]0.233575236983772[/C][/ROW]
[ROW][C]46[/C][C]0.236796551348809[/C][/ROW]
[ROW][C]47[/C][C]0.237949732487488[/C][/ROW]
[ROW][C]48[/C][C]0.24191805827237[/C][/ROW]
[ROW][C]49[/C][C]0.242781447044397[/C][/ROW]
[ROW][C]50[/C][C]0.243927899384294[/C][/ROW]
[ROW][C]51[/C][C]0.250638161858732[/C][/ROW]
[ROW][C]52[/C][C]0.255433915010614[/C][/ROW]
[ROW][C]53[/C][C]0.321814428414466[/C][/ROW]
[ROW][C]54[/C][C]0.32559044102776[/C][/ROW]
[ROW][C]55[/C][C]0.470423569231658[/C][/ROW]
[ROW][C]56[/C][C]0.536480732139349[/C][/ROW]
[ROW][C]57[/C][C]0.66983059343549[/C][/ROW]
[ROW][C]58[/C][C]1.11005241504288[/C][/ROW]
[ROW][C]59[/C][C]1.56422665585449[/C][/ROW]
[/TABLE]
Source: https://freestatistics.org/blog/index.php?pk=23545&T=1

Globally Unique Identifier (entire table): ba.freestatistics.org/blog/index.php?pk=23545&T=1

As an alternative you can also use a QR Code:  

The GUIDs for individual cells are displayed in the table below:

Summary of Dendrogram
LabelHeight
10
20
30
40
50
60
70
80
90
100.0999999999999996
110.0957106781186544
120.0999999999999996
130.0999999999999996
140.0957106781186544
150.0739276695296634
160.0999999999999996
170.0999999999999996
180.0999999999999996
190.0999999999999996
200.0999999999999996
210.0957106781186544
220.0739276695296634
230.0999999999999996
240.0999999999999996
250.0999999999999996
260.0957106781186552
270.0999999999999996
280.100000000000001
290.100000000000001
300.111965775690154
310.116257038496822
320.119474029907831
330.125000000000000
340.126680170189601
350.127416625408901
360.135772147839775
370.141421356237309
380.141421356237311
390.136803398874990
400.163764076993644
410.167665681536207
420.192637566165745
430.223606797749978
440.203638574129825
450.233575236983772
460.236796551348809
470.237949732487488
480.24191805827237
490.242781447044397
500.243927899384294
510.250638161858732
520.255433915010614
530.321814428414466
540.32559044102776
550.470423569231658
560.536480732139349
570.66983059343549
581.11005241504288
591.56422665585449


Parameters (Session):
par1 = median ; par2 = ALL ; par3 = FALSE ; par4 = FALSE ;
Parameters (R input):
par1 = median ; par2 = ALL ; par3 = FALSE ; par4 = FALSE ;
R code (references can be found in the software module):
par3 <- as.logical(par3)
par4 <- as.logical(par4)
if (par3 == 'TRUE'){
dum = xlab
xlab = ylab
ylab = dum
}
x <- t(y)
hc <- hclust(dist(x),method=par1)
d <- as.dendrogram(hc)
str(d)
mysub <- paste('Method: ',par1)
bitmap(file='test1.png')
if (par4 == 'TRUE'){
plot(d,main=main,ylab=ylab,xlab=xlab,horiz=par3, nodePar=list(pch = c(1,NA), cex=0.8, lab.cex = 0.8),type='t',center=T, sub=mysub)
} else {
plot(d,main=main,ylab=ylab,xlab=xlab,horiz=par3, nodePar=list(pch = c(1,NA), cex=0.8, lab.cex = 0.8), sub=mysub)
}
dev.off()
if (par2 != 'ALL'){
if (par3 == 'TRUE'){
ylab = 'cluster'
} else {
xlab = 'cluster'
}
par2 <- as.numeric(par2)
memb <- cutree(hc, k = par2)
cent <- NULL
for(k in 1:par2){
cent <- rbind(cent, colMeans(x[memb == k, , drop = FALSE]))
}
hc1 <- hclust(dist(cent),method=par1, members = table(memb))
de <- as.dendrogram(hc1)
bitmap(file='test2.png')
if (par4 == 'TRUE'){
plot(de,main=main,ylab=ylab,xlab=xlab,horiz=par3, nodePar=list(pch = c(1,NA), cex=0.8, lab.cex = 0.8),type='t',center=T, sub=mysub)
} else {
plot(de,main=main,ylab=ylab,xlab=xlab,horiz=par3, nodePar=list(pch = c(1,NA), cex=0.8, lab.cex = 0.8), sub=mysub)
}
dev.off()
str(de)
}
load(file='createtable')
a<-table.start()
a<-table.row.start(a)
a<-table.element(a,'Summary of Dendrogram',2,TRUE)
a<-table.row.end(a)
a<-table.row.start(a)
a<-table.element(a,'Label',header=TRUE)
a<-table.element(a,'Height',header=TRUE)
a<-table.row.end(a)
num <- length(x[,1])-1
for (i in 1:num)
{
a<-table.row.start(a)
a<-table.element(a,hc$labels[i])
a<-table.element(a,hc$height[i])
a<-table.row.end(a)
}
a<-table.end(a)
table.save(a,file='mytable1.tab')
if (par2 != 'ALL'){
a<-table.start()
a<-table.row.start(a)
a<-table.element(a,'Summary of Cut Dendrogram',2,TRUE)
a<-table.row.end(a)
a<-table.row.start(a)
a<-table.element(a,'Label',header=TRUE)
a<-table.element(a,'Height',header=TRUE)
a<-table.row.end(a)
num <- par2-1
for (i in 1:num)
{
a<-table.row.start(a)
a<-table.element(a,i)
a<-table.element(a,hc1$height[i])
a<-table.row.end(a)
}
a<-table.end(a)
table.save(a,file='mytable2.tab')
}