Free Statistics

of Irreproducible Research!

Author's title

Author*The author of this computation has been verified*
R Software Modulerwasp_bidensity.wasp
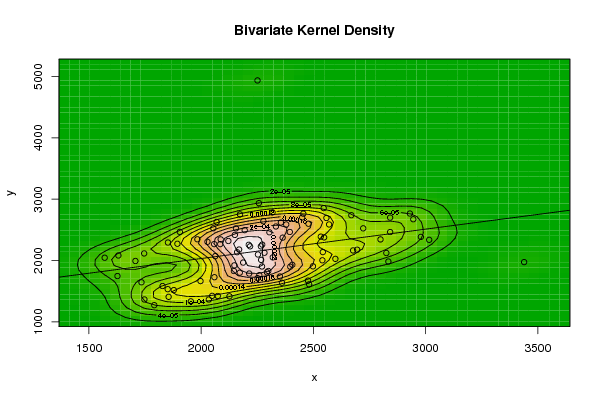
Title produced by softwareBivariate Kernel Density Estimation
Date of computationTue, 11 Nov 2008 08:55:07 -0700
Cite this page as followsStatistical Computations at FreeStatistics.org, Office for Research Development and Education, URL https://freestatistics.org/blog/index.php?v=date/2008/Nov/11/t122641896792mdhhmxvwdc4no.htm/, Retrieved Sun, 19 May 2024 04:36:07 +0000
Statistical Computations at FreeStatistics.org, Office for Research Development and Education, URL https://freestatistics.org/blog/index.php?pk=23620, Retrieved Sun, 19 May 2024 04:36:07 +0000
QR Codes:

Original text written by user:
IsPrivate?No (this computation is public)
User-defined keywords
Estimated Impact126
Family? (F = Feedback message, R = changed R code, M = changed R Module, P = changed Parameters, D = changed Data)
F       [Bivariate Kernel Density Estimation] [Bivariate Kernel ...] [2008-11-11 15:55:07] [7957bb37a64ed417bbed8444b0b0ea8a] [Current]
Feedback Forum
2008-11-20 17:01:05 [Steffi Van Isveldt] [reply
Correcte berekening, alleen uitbreekt enige uitleg bij deze stap.
Je kan hier zowel op de grafiek als de output een zeer zwakke positieve correlatie terugvinden.
2008-11-24 19:57:28 [Dries Van Gheluwe] [reply
Je kan hier een zwakke positieve correlatie zien maar er zijn toch enkele zeer interessante zaken aan dit bivariate density plot. De punten van gelijke dichtheid liggen dicht bij elkaar, dit wil zeggen dat de gegevens zeer geconcentreerd zijn op één punt.Je kan bijna geen outliers vinden op het plot dus is dit een tijdreeks met een zeer nauwe samenhang.

Post a new message
Dataseries X:
2173
2363
2126
1905
2121
1983
1734
2074
2049
2406
2558
2251
2059
2397
1747
1707
2319
1631
1627
1791
2034
1997
2169
2028
2253
2218
1855
2187
1852
1570
1851
1954
1828
2251
2277
2085
2282
2266
1878
2267
2069
1746
2299
2360
2214
2825
2355
2333
3016
2155
2172
2150
2533
2058
2160
2259
2498
2695
2799
2945
2930
2318
2540
2570
2669
2450
2842
3439
2677
2979
2257
2842
2546
2455
2293
2379
2478
2054
2272
2351
2271
2542
2304
2194
2722
2395
2146
1894
2548
2087
2063
2481
2476
2212
2834
2148
2598
Dataseries Y:
2752
2373
1415
2466
2318
2346
1644
1421
1423
1930
2694
4938
1727
1899
1364
1992
2051
2082
1746
1271
1363
1664
2179
2305
2098
2231
1407
1966
2293
2045
1532
1333
1583
1712
2641
2267
2126
2231
1517
2010
2628
2115
1829
1636
1787
2122
2620
2555
2337
2524
1801
2417
2389
2267
2135
1760
1905
2176
2344
2673
2766
2785
2003
2588
2739
2703
2464
1974
2164
2385
2936
2700
2855
2764
1808
2588
2600
2526
2259
1738
1902
2137
2460
2495
2525
2465
1828
2273
2377
2344
2071
1611
1671
2256
1983
1921
2027


Summary of computational transaction
Raw Inputview raw input (R code)
Raw Outputview raw output of R engine
Computing time4 seconds
R Server'George Udny Yule' @ 72.249.76.132

\begin{tabular}{lllllllll}
\hline
Summary of computational transaction \tabularnewline
Raw Input & view raw input (R code)  \tabularnewline
Raw Output & view raw output of R engine  \tabularnewline
Computing time & 4 seconds \tabularnewline
R Server & 'George Udny Yule' @ 72.249.76.132 \tabularnewline
\hline
\end{tabular}
%Source: https://freestatistics.org/blog/index.php?pk=23620&T=0

[TABLE]
[ROW][C]Summary of computational transaction[/C][/ROW]
[ROW][C]Raw Input[/C][C]view raw input (R code) [/C][/ROW]
[ROW][C]Raw Output[/C][C]view raw output of R engine [/C][/ROW]
[ROW][C]Computing time[/C][C]4 seconds[/C][/ROW]
[ROW][C]R Server[/C][C]'George Udny Yule' @ 72.249.76.132[/C][/ROW]
[/TABLE]
Source: https://freestatistics.org/blog/index.php?pk=23620&T=0

Globally Unique Identifier (entire table): ba.freestatistics.org/blog/index.php?pk=23620&T=0

As an alternative you can also use a QR Code:  

The GUIDs for individual cells are displayed in the table below:

Summary of computational transaction
Raw Inputview raw input (R code)
Raw Outputview raw output of R engine
Computing time4 seconds
R Server'George Udny Yule' @ 72.249.76.132


Bandwidth
x axis120.394744876625
y axis203.716600225154
Correlation
correlation used in KDE0.329469746988351
correlation(x,y)0.329469746988351

\begin{tabular}{lllllllll}
\hline
Bandwidth \tabularnewline
x axis & 120.394744876625 \tabularnewline
y axis & 203.716600225154 \tabularnewline
Correlation \tabularnewline
correlation used in KDE & 0.329469746988351 \tabularnewline
correlation(x,y) & 0.329469746988351 \tabularnewline
\hline
\end{tabular}
%Source: https://freestatistics.org/blog/index.php?pk=23620&T=1

[TABLE]
[ROW][C]Bandwidth[/C][/ROW]
[ROW][C]x axis[/C][C]120.394744876625[/C][/ROW]
[ROW][C]y axis[/C][C]203.716600225154[/C][/ROW]
[ROW][C]Correlation[/C][/ROW]
[ROW][C]correlation used in KDE[/C][C]0.329469746988351[/C][/ROW]
[ROW][C]correlation(x,y)[/C][C]0.329469746988351[/C][/ROW]
[/TABLE]
Source: https://freestatistics.org/blog/index.php?pk=23620&T=1

Globally Unique Identifier (entire table): ba.freestatistics.org/blog/index.php?pk=23620&T=1

As an alternative you can also use a QR Code:  

The GUIDs for individual cells are displayed in the table below:

Bandwidth
x axis120.394744876625
y axis203.716600225154
Correlation
correlation used in KDE0.329469746988351
correlation(x,y)0.329469746988351


Parameters (Session):
par1 = 50 ; par2 = 50 ; par3 = 0 ; par4 = 0 ; par5 = 0 ; par6 = Y ; par7 = Y ;
Parameters (R input):
par1 = 50 ; par2 = 50 ; par3 = 0 ; par4 = 0 ; par5 = 0 ; par6 = Y ; par7 = Y ;
R code (references can be found in the software module):
par1 <- as(par1,'numeric')
par2 <- as(par2,'numeric')
par3 <- as(par3,'numeric')
par4 <- as(par4,'numeric')
par5 <- as(par5,'numeric')
library('GenKern')
if (par3==0) par3 <- dpik(x)
if (par4==0) par4 <- dpik(y)
if (par5==0) par5 <- cor(x,y)
if (par1 > 500) par1 <- 500
if (par2 > 500) par2 <- 500
bitmap(file='bidensity.png')
op <- KernSur(x,y, xgridsize=par1, ygridsize=par2, correlation=par5, xbandwidth=par3, ybandwidth=par4)
image(op$xords, op$yords, op$zden, col=terrain.colors(100), axes=TRUE,main=main,xlab=xlab,ylab=ylab)
if (par6=='Y') contour(op$xords, op$yords, op$zden, add=TRUE)
if (par7=='Y') points(x,y)
(r<-lm(y ~ x))
abline(r)
box()
dev.off()
load(file='createtable')
a<-table.start()
a<-table.row.start(a)
a<-table.element(a,'Bandwidth',2,TRUE)
a<-table.row.end(a)
a<-table.row.start(a)
a<-table.element(a,'x axis',header=TRUE)
a<-table.element(a,par3)
a<-table.row.end(a)
a<-table.row.start(a)
a<-table.element(a,'y axis',header=TRUE)
a<-table.element(a,par4)
a<-table.row.end(a)
a<-table.row.start(a)
a<-table.element(a,'Correlation',2,TRUE)
a<-table.row.end(a)
a<-table.row.start(a)
a<-table.element(a,'correlation used in KDE',header=TRUE)
a<-table.element(a,par5)
a<-table.row.end(a)
a<-table.row.start(a)
a<-table.element(a,'correlation(x,y)',header=TRUE)
a<-table.element(a,cor(x,y))
a<-table.row.end(a)
a<-table.end(a)
table.save(a,file='mytable.tab')