Free Statistics

of Irreproducible Research!

Author's title

Author*Unverified author*
R Software Modulerwasp_hierarchicalclustering.wasp
Title produced by softwareHierarchical Clustering
Date of computationTue, 11 Nov 2008 09:37:31 -0700
Cite this page as followsStatistical Computations at FreeStatistics.org, Office for Research Development and Education, URL https://freestatistics.org/blog/index.php?v=date/2008/Nov/11/t122642155185kuiq6qtqr7r68.htm/, Retrieved Sun, 19 May 2024 04:19:29 +0000
Statistical Computations at FreeStatistics.org, Office for Research Development and Education, URL https://freestatistics.org/blog/index.php?pk=23701, Retrieved Sun, 19 May 2024 04:19:29 +0000
QR Codes:

Original text written by user:
IsPrivate?No (this computation is public)
User-defined keywords
Estimated Impact148
Family? (F = Feedback message, R = changed R code, M = changed R Module, P = changed Parameters, D = changed Data)
F     [Univariate Data Series] [VMAW] [2008-10-13 16:54:40] [cbd3d88cd5aad6543e769146e7e26b0c]
F RMPD  [Bivariate Kernel Density Estimation] [Opdracht 4 Q1] [2008-11-10 09:23:45] [2bd2ad6af3eef3a703e9ec23e39bd695]
- RMPD      [Hierarchical Clustering] [sarah Q2] [2008-11-11 16:37:31] [e8ace8b3d80d7fc51f1760fb13a6fe6b] [Current]
Feedback Forum

Post a new message
Dataseries X:
10263	5953	2935	3018	3346	1622	1724	964	461	503
10310	5973	2945	3028	3358	1628	1730	979	469	510
10355	5995	2957	3038	3369	1634	1735	992	477	515
10396	6016	2967	3049	3380	1640	1740	1000	480	520
10446	6043	2980	3063	3396	1648	1748	1007	484	523
10511	6078	2997	3081	3414	1657	1757	1019	490	529
10585	6117	3017	3100	3436	1668	1768	1031	497	534
10667	6162	3040	3122	3456	1678	1778	1049	506	543


Summary of computational transaction
Raw Inputview raw input (R code)
Raw Outputview raw output of R engine
Computing time2 seconds
R Server'George Udny Yule' @ 72.249.76.132

\begin{tabular}{lllllllll}
\hline
Summary of computational transaction \tabularnewline
Raw Input & view raw input (R code)  \tabularnewline
Raw Output & view raw output of R engine  \tabularnewline
Computing time & 2 seconds \tabularnewline
R Server & 'George Udny Yule' @ 72.249.76.132 \tabularnewline
\hline
\end{tabular}
%Source: https://freestatistics.org/blog/index.php?pk=23701&T=0

[TABLE]
[ROW][C]Summary of computational transaction[/C][/ROW]
[ROW][C]Raw Input[/C][C]view raw input (R code) [/C][/ROW]
[ROW][C]Raw Output[/C][C]view raw output of R engine [/C][/ROW]
[ROW][C]Computing time[/C][C]2 seconds[/C][/ROW]
[ROW][C]R Server[/C][C]'George Udny Yule' @ 72.249.76.132[/C][/ROW]
[/TABLE]
Source: https://freestatistics.org/blog/index.php?pk=23701&T=0

Globally Unique Identifier (entire table): ba.freestatistics.org/blog/index.php?pk=23701&T=0

As an alternative you can also use a QR Code:  

The GUIDs for individual cells are displayed in the table below:

Summary of computational transaction
Raw Inputview raw input (R code)
Raw Outputview raw output of R engine
Computing time2 seconds
R Server'George Udny Yule' @ 72.249.76.132


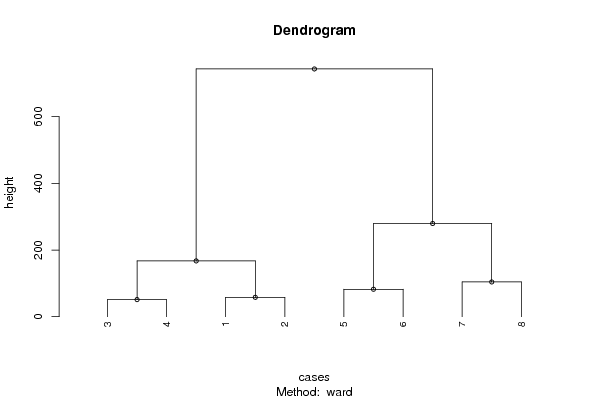
Summary of Dendrogram
LabelHeight
151.2152321092075
257.9913786695919
382.2496200599127
4104.153732530332
5167.265878436573
6279.592025013628
7743.436231908463

\begin{tabular}{lllllllll}
\hline
Summary of Dendrogram \tabularnewline
Label & Height \tabularnewline
1 & 51.2152321092075 \tabularnewline
2 & 57.9913786695919 \tabularnewline
3 & 82.2496200599127 \tabularnewline
4 & 104.153732530332 \tabularnewline
5 & 167.265878436573 \tabularnewline
6 & 279.592025013628 \tabularnewline
7 & 743.436231908463 \tabularnewline
\hline
\end{tabular}
%Source: https://freestatistics.org/blog/index.php?pk=23701&T=1

[TABLE]
[ROW][C]Summary of Dendrogram[/C][/ROW]
[ROW][C]Label[/C][C]Height[/C][/ROW]
[ROW][C]1[/C][C]51.2152321092075[/C][/ROW]
[ROW][C]2[/C][C]57.9913786695919[/C][/ROW]
[ROW][C]3[/C][C]82.2496200599127[/C][/ROW]
[ROW][C]4[/C][C]104.153732530332[/C][/ROW]
[ROW][C]5[/C][C]167.265878436573[/C][/ROW]
[ROW][C]6[/C][C]279.592025013628[/C][/ROW]
[ROW][C]7[/C][C]743.436231908463[/C][/ROW]
[/TABLE]
Source: https://freestatistics.org/blog/index.php?pk=23701&T=1

Globally Unique Identifier (entire table): ba.freestatistics.org/blog/index.php?pk=23701&T=1

As an alternative you can also use a QR Code:  

The GUIDs for individual cells are displayed in the table below:

Summary of Dendrogram
LabelHeight
151.2152321092075
257.9913786695919
382.2496200599127
4104.153732530332
5167.265878436573
6279.592025013628
7743.436231908463


Parameters (Session):
par1 = ward ; par2 = ALL ; par3 = FALSE ; par4 = FALSE ;
Parameters (R input):
par1 = ward ; par2 = ALL ; par3 = FALSE ; par4 = FALSE ;
R code (references can be found in the software module):
par3 <- as.logical(par3)
par4 <- as.logical(par4)
if (par3 == 'TRUE'){
dum = xlab
xlab = ylab
ylab = dum
}
x <- t(y)
hc <- hclust(dist(x),method=par1)
d <- as.dendrogram(hc)
str(d)
mysub <- paste('Method: ',par1)
bitmap(file='test1.png')
if (par4 == 'TRUE'){
plot(d,main=main,ylab=ylab,xlab=xlab,horiz=par3, nodePar=list(pch = c(1,NA), cex=0.8, lab.cex = 0.8),type='t',center=T, sub=mysub)
} else {
plot(d,main=main,ylab=ylab,xlab=xlab,horiz=par3, nodePar=list(pch = c(1,NA), cex=0.8, lab.cex = 0.8), sub=mysub)
}
dev.off()
if (par2 != 'ALL'){
if (par3 == 'TRUE'){
ylab = 'cluster'
} else {
xlab = 'cluster'
}
par2 <- as.numeric(par2)
memb <- cutree(hc, k = par2)
cent <- NULL
for(k in 1:par2){
cent <- rbind(cent, colMeans(x[memb == k, , drop = FALSE]))
}
hc1 <- hclust(dist(cent),method=par1, members = table(memb))
de <- as.dendrogram(hc1)
bitmap(file='test2.png')
if (par4 == 'TRUE'){
plot(de,main=main,ylab=ylab,xlab=xlab,horiz=par3, nodePar=list(pch = c(1,NA), cex=0.8, lab.cex = 0.8),type='t',center=T, sub=mysub)
} else {
plot(de,main=main,ylab=ylab,xlab=xlab,horiz=par3, nodePar=list(pch = c(1,NA), cex=0.8, lab.cex = 0.8), sub=mysub)
}
dev.off()
str(de)
}
load(file='createtable')
a<-table.start()
a<-table.row.start(a)
a<-table.element(a,'Summary of Dendrogram',2,TRUE)
a<-table.row.end(a)
a<-table.row.start(a)
a<-table.element(a,'Label',header=TRUE)
a<-table.element(a,'Height',header=TRUE)
a<-table.row.end(a)
num <- length(x[,1])-1
for (i in 1:num)
{
a<-table.row.start(a)
a<-table.element(a,hc$labels[i])
a<-table.element(a,hc$height[i])
a<-table.row.end(a)
}
a<-table.end(a)
table.save(a,file='mytable1.tab')
if (par2 != 'ALL'){
a<-table.start()
a<-table.row.start(a)
a<-table.element(a,'Summary of Cut Dendrogram',2,TRUE)
a<-table.row.end(a)
a<-table.row.start(a)
a<-table.element(a,'Label',header=TRUE)
a<-table.element(a,'Height',header=TRUE)
a<-table.row.end(a)
num <- par2-1
for (i in 1:num)
{
a<-table.row.start(a)
a<-table.element(a,i)
a<-table.element(a,hc1$height[i])
a<-table.row.end(a)
}
a<-table.end(a)
table.save(a,file='mytable2.tab')
}