Free Statistics

of Irreproducible Research!

Author's title

Author*The author of this computation has been verified*
R Software Modulerwasp_cloud.wasp
Title produced by softwareTrivariate Scatterplots
Date of computationWed, 12 Nov 2008 04:04:55 -0700
Cite this page as followsStatistical Computations at FreeStatistics.org, Office for Research Development and Education, URL https://freestatistics.org/blog/index.php?v=date/2008/Nov/12/t12264880457kvxvioc5wepfmb.htm/, Retrieved Sat, 18 May 2024 18:53:38 +0000
Statistical Computations at FreeStatistics.org, Office for Research Development and Education, URL https://freestatistics.org/blog/index.php?pk=24124, Retrieved Sat, 18 May 2024 18:53:38 +0000
QR Codes:

Original text written by user:
IsPrivate?No (this computation is public)
User-defined keywords
Estimated Impact167
Family? (F = Feedback message, R = changed R code, M = changed R Module, P = changed Parameters, D = changed Data)
F       [Trivariate Scatterplots] [W3Q1(c)] [2008-11-12 11:04:55] [434228f9e3c7eaa307f0fb12855e2147] [Current]
Feedback Forum
2008-11-22 12:29:35 [Sandra Hofmans] [reply

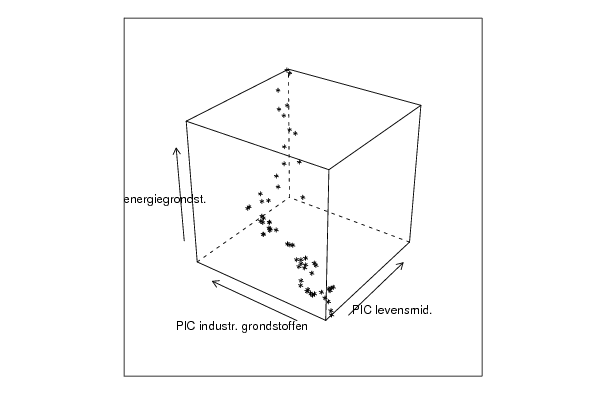
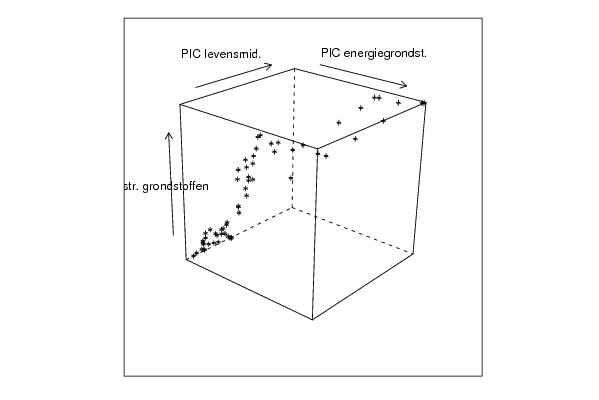
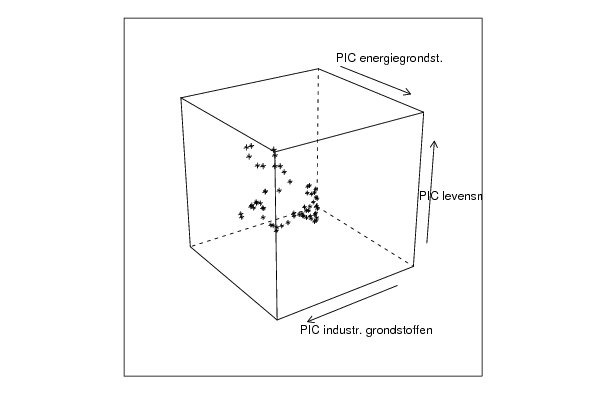
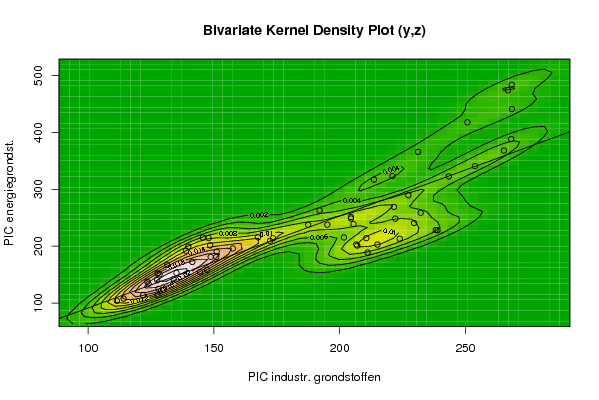
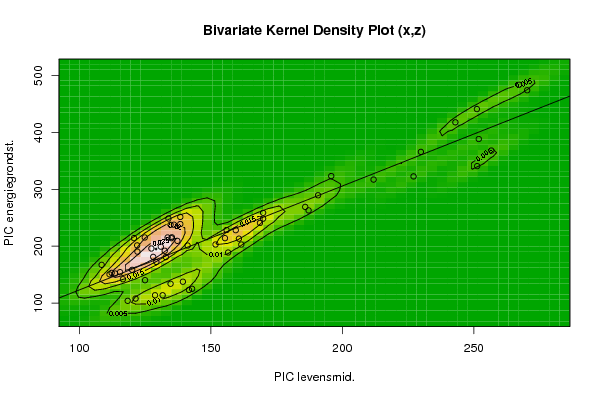
De trivariate scatterplot is een driedimensionale scatterplot met de mogelijkheid voor meer dan twee variabelen te onderzoeken. Als de scatterplot een stijgend verloop toont (zoals hier) dan vind er een positieve werking plaats tussen de variabelen. Maar deze geeft een vertekend beeld, doordat er bepaalde dimensies gereduceerd zijn, daarom is het beter te werken met bijvoorbeeld de Partial Correlation.
2008-11-23 15:56:56 [Peter Van Doninck] [reply
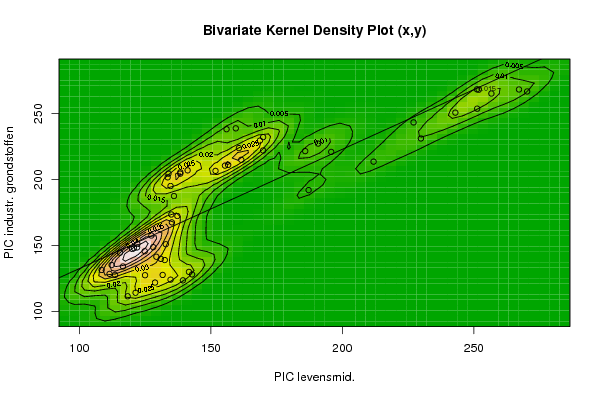
De conclusie over de trivatiate scatterplots is niet volledig correct. Door toepassing van deze scatterplots kunnen we de correlatie berekenen tussen de 3 variabelen dmv een puntenwolk. Op papier wordt deze voorstelling echter beperkt tot 2 dimensies. Hiervoor gebruiken we de bivariate kernel density plot. In alle 3 de gevallen is er een stijgende trend waar te nemen van de regressierechte. De concentraties liggen in de 3 gevallen wel niet hetzelfde! Er is nooit echt één enkele concentratie waar te nemen! We hebben echter wel steeds te maken met min of meer ellipsvormen, waardoor we kunnen besluiten dat er een verband is tussen de variabelen.

Post a new message
Dataseries X:
118,4
121,4
128,8
131,7
141,7
142,9
139,4
134,7
125,0
113,6
111,5
108,5
112,3
116,6
115,5
120,1
132,9
128,1
129,3
132,5
131,0
124,9
120,8
122,0
122,1
127,4
135,2
137,3
135,0
136,0
138,4
134,7
138,4
133,9
133,6
141,2
151,8
155,4
156,6
161,6
160,7
156,0
159,5
168,7
169,9
169,9
185,9
190,8
195,8
211,9
227,1
251,3
256,7
251,9
251,2
270,3
267,2
243,0
229,9
187,2
Dataseries Y:
111,4
114,1
121,8
127,6
129,9
128,0
123,5
124,0
127,4
127,6
128,4
131,4
135,1
134,0
144,5
147,3
150,9
148,7
141,4
138,9
139,8
145,6
147,9
148,5
151,1
157,5
167,5
172,3
173,5
187,5
205,5
195,1
204,5
204,5
201,7
207,0
206,6
210,6
211,1
215,0
223,9
238,2
238,9
229,6
232,2
222,1
221,6
227,3
221,0
213,6
243,4
253,8
265,3
268,2
268,5
266,9
268,4
250,8
231,2
192,0
Dataseries Z:
104,0
107,9
113,8
113,8
123,1
125,1
137,6
134,0
140,3
152,1
150,6
167,3
153,2
142,0
154,4
158,5
180,9
181,3
172,4
192,0
199,3
215,4
214,3
201,5
190,5
196,0
215,7
209,4
214,1
237,8
239,0
237,8
251,5
248,8
215,4
201,2
203,1
214,2
188,9
203,0
213,3
228,5
228,2
240,9
258,8
248,5
269,2
289,6
323,4
317,2
322,8
340,9
368,2
388,5
441,2
474,3
483,9
417,9
365,9
263,0


Summary of computational transaction
Raw Inputview raw input (R code)
Raw Outputview raw output of R engine
Computing time3 seconds
R Server'Gwilym Jenkins' @ 72.249.127.135

\begin{tabular}{lllllllll}
\hline
Summary of computational transaction \tabularnewline
Raw Input & view raw input (R code)  \tabularnewline
Raw Output & view raw output of R engine  \tabularnewline
Computing time & 3 seconds \tabularnewline
R Server & 'Gwilym Jenkins' @ 72.249.127.135 \tabularnewline
\hline
\end{tabular}
%Source: https://freestatistics.org/blog/index.php?pk=24124&T=0

[TABLE]
[ROW][C]Summary of computational transaction[/C][/ROW]
[ROW][C]Raw Input[/C][C]view raw input (R code) [/C][/ROW]
[ROW][C]Raw Output[/C][C]view raw output of R engine [/C][/ROW]
[ROW][C]Computing time[/C][C]3 seconds[/C][/ROW]
[ROW][C]R Server[/C][C]'Gwilym Jenkins' @ 72.249.127.135[/C][/ROW]
[/TABLE]
Source: https://freestatistics.org/blog/index.php?pk=24124&T=0

Globally Unique Identifier (entire table): ba.freestatistics.org/blog/index.php?pk=24124&T=0

As an alternative you can also use a QR Code:  

The GUIDs for individual cells are displayed in the table below:

Summary of computational transaction
Raw Inputview raw input (R code)
Raw Outputview raw output of R engine
Computing time3 seconds
R Server'Gwilym Jenkins' @ 72.249.127.135


Parameters (Session):
par1 = 50 ; par2 = 50 ; par3 = Y ; par4 = Y ; par5 = PIC levensmid. ; par6 = PIC industr. grondstoffen ; par7 = PIC energiegrondst. ;
Parameters (R input):
par1 = 50 ; par2 = 50 ; par3 = Y ; par4 = Y ; par5 = PIC levensmid. ; par6 = PIC industr. grondstoffen ; par7 = PIC energiegrondst. ;
R code (references can be found in the software module):
x <- array(x,dim=c(length(x),1))
colnames(x) <- par5
y <- array(y,dim=c(length(y),1))
colnames(y) <- par6
z <- array(z,dim=c(length(z),1))
colnames(z) <- par7
d <- data.frame(cbind(z,y,x))
colnames(d) <- list(par7,par6,par5)
par1 <- as.numeric(par1)
par2 <- as.numeric(par2)
if (par1>500) par1 <- 500
if (par2>500) par2 <- 500
if (par1<10) par1 <- 10
if (par2<10) par2 <- 10
library(GenKern)
library(lattice)
panel.hist <- function(x, ...)
{
usr <- par('usr'); on.exit(par(usr))
par(usr = c(usr[1:2], 0, 1.5) )
h <- hist(x, plot = FALSE)
breaks <- h$breaks; nB <- length(breaks)
y <- h$counts; y <- y/max(y)
rect(breaks[-nB], 0, breaks[-1], y, col='black', ...)
}
bitmap(file='cloud1.png')
cloud(z~x*y, screen = list(x=-45, y=45, z=35),xlab=par5,ylab=par6,zlab=par7)
dev.off()
bitmap(file='cloud2.png')
cloud(z~x*y, screen = list(x=35, y=45, z=25),xlab=par5,ylab=par6,zlab=par7)
dev.off()
bitmap(file='cloud3.png')
cloud(z~x*y, screen = list(x=35, y=-25, z=90),xlab=par5,ylab=par6,zlab=par7)
dev.off()
bitmap(file='pairs.png')
pairs(d,diag.panel=panel.hist)
dev.off()
x <- as.vector(x)
y <- as.vector(y)
z <- as.vector(z)
bitmap(file='bidensity1.png')
op <- KernSur(x,y, xgridsize=par1, ygridsize=par2, correlation=cor(x,y), xbandwidth=dpik(x), ybandwidth=dpik(y))
image(op$xords, op$yords, op$zden, col=terrain.colors(100), axes=TRUE,main='Bivariate Kernel Density Plot (x,y)',xlab=par5,ylab=par6)
if (par3=='Y') contour(op$xords, op$yords, op$zden, add=TRUE)
if (par4=='Y') points(x,y)
(r<-lm(y ~ x))
abline(r)
box()
dev.off()
bitmap(file='bidensity2.png')
op <- KernSur(y,z, xgridsize=par1, ygridsize=par2, correlation=cor(y,z), xbandwidth=dpik(y), ybandwidth=dpik(z))
op
image(op$xords, op$yords, op$zden, col=terrain.colors(100), axes=TRUE,main='Bivariate Kernel Density Plot (y,z)',xlab=par6,ylab=par7)
if (par3=='Y') contour(op$xords, op$yords, op$zden, add=TRUE)
if (par4=='Y') points(y,z)
(r<-lm(z ~ y))
abline(r)
box()
dev.off()
bitmap(file='bidensity3.png')
op <- KernSur(x,z, xgridsize=par1, ygridsize=par2, correlation=cor(x,z), xbandwidth=dpik(x), ybandwidth=dpik(z))
op
image(op$xords, op$yords, op$zden, col=terrain.colors(100), axes=TRUE,main='Bivariate Kernel Density Plot (x,z)',xlab=par5,ylab=par7)
if (par3=='Y') contour(op$xords, op$yords, op$zden, add=TRUE)
if (par4=='Y') points(x,z)
(r<-lm(z ~ x))
abline(r)
box()
dev.off()