Free Statistics

of Irreproducible Research!

Author's title

Author*The author of this computation has been verified*
R Software Modulerwasp_boxcoxlin.wasp
Title produced by softwareBox-Cox Linearity Plot
Date of computationWed, 12 Nov 2008 08:01:01 -0700
Cite this page as followsStatistical Computations at FreeStatistics.org, Office for Research Development and Education, URL https://freestatistics.org/blog/index.php?v=date/2008/Nov/12/t1226502116y815ro0r1u6cdca.htm/, Retrieved Sat, 18 May 2024 22:31:11 +0000
Statistical Computations at FreeStatistics.org, Office for Research Development and Education, URL https://freestatistics.org/blog/index.php?pk=24231, Retrieved Sat, 18 May 2024 22:31:11 +0000
QR Codes:

Original text written by user:
IsPrivate?No (this computation is public)
User-defined keywords
Estimated Impact150
Family? (F = Feedback message, R = changed R code, M = changed R Module, P = changed Parameters, D = changed Data)
F     [Box-Cox Linearity Plot] [Various EDA topic...] [2008-11-09 16:56:36] [3548296885df7a66ea8efc200c4aca50]
F   PD    [Box-Cox Linearity Plot] [Various EDA topic...] [2008-11-12 15:01:01] [ff1f39dba9ec26bf89aa666d9dcb6cc1] [Current]
Feedback Forum
2008-11-14 16:04:55 [Annemiek Hoofman] [reply
Zoals ik kan zien in je berekening, heb je precies andere datasets gebruikt dan in Q1 (of zie ik het verkeerd?). Om te vergelijken of de transformatie nut heeft, moet je eerst de correlatie tussen 2 variabelen zoeken en nadien zien of deze correlatie verbeterd is na de transformatie.
2008-11-24 17:39:27 [5faab2fc6fb120339944528a32d48a04] [reply
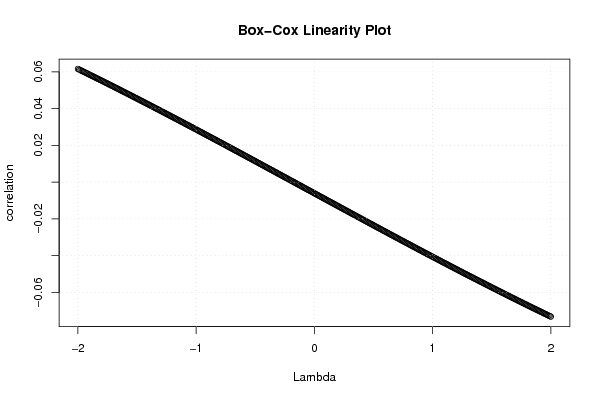
Deze plot voert een transformatie door om de variabelen meer lineair te maken. Hiervoor wordt de functie aan de hand van de Box-Cox formule, om zo het optimale verband te vinden. De lambda-waarde, die schommelt tussen -2 en 2, die de hoogste correlatiecoëfficiënt voor de functie oplevert, wordt gebruikt om de grafiek te transformeren. De transformatie wordt doorgevoerd op de X-variabelen.
In het voorbeeld van de student bekomen we een recht lijn naar beneden. Dit is vaak het geval. We hadden gehoopt op een parabool om daar het maximum uit te kunnen aflezen en deze als optimale waarde te gebruiken. Hier is echter geen optimale waarde en zal de transformatie dus niet veel zin hebben.
2008-11-24 20:37:29 [Kevin Vermeiren] [reply
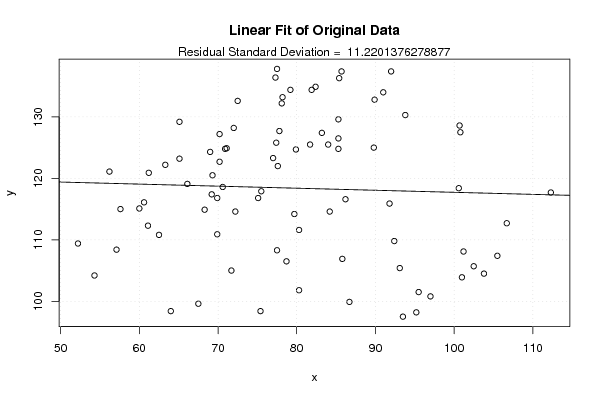
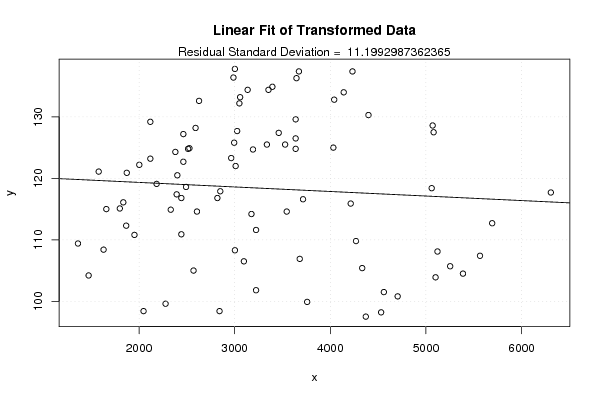
De student geeft ook hier een zeer beperkt antwoord. De box-cox linearity plot ( niet in het worddocument opgenomen) ,gebruikt om na te gaan welke lambda de beste waarde geeft voor de efficiëntste transformatie., geeft een dalend verloop weer. Op de Y-as staat de correlatie weergegeven. Hoger op de y-as hoe groter het verband. De werking van de plot wordt ook niet uitgelegd. In deze berekening laten we de lambda verschillende waarden aannemen en alle mogelijke transformaties uitproberen. Als gevolg hiervan krijgen we een stijgend of dalend verloop van de curve (hopelijk met maximum). In het maximum van deze plot vinden we het punt waar we de beste transformatie bereiken. Dit punt vertegenwoordigt de optimale lambda waarde. In dit voorbeeld is deze waarde duidelijk niet gelegen tussen -2 en 2. Vervolgens gaan we dan de linear fit van de original data met deze van de transformed data bekijken. Deze fits worden bekomen door de box-cox transformatie toe te passen. Dit is nodig om na te gaan of de transformatie de lineair fit beter – meer lineair- maakt. Uit dit onderzoek blijkt dat de spreiding van de puntenwolk inderdaad zo goed als niet veranderd is. De conclusie is bijgevolg terecht, namelijk dat de transformatie de lineair fit niet beter, niet meer lineair maakt. Met andere woorden de transformatie is niet nuttig.

Post a new message
Dataseries X:
75,4
105,5
112,3
102,5
93,5
86,7
95,2
103,8
97,0
95,5
101,0
67,5
64,0
106,7
100,6
101,2
93,1
84,2
85,8
91,8
92,4
80,3
79,7
62,5
57,1
100,8
100,7
86,2
83,2
71,7
77,5
89,8
80,3
78,7
93,8
57,6
60,6
91,0
85,3
77,4
77,3
68,3
69,9
81,7
75,1
69,9
84,0
54,3
60,0
89,9
77,0
85,3
77,6
69,2
75,5
85,7
72,2
79,9
85,3
52,2
61,2
82,4
85,4
78,2
70,2
70,2
69,3
77,5
66,1
69,0
79,2
56,2
63,3
77,8
92,0
78,1
65,1
71,1
70,9
72,0
81,9
70,6
72,5
65,1
61,1
Dataseries Y:
98,4
107,4
117,7
105,7
97,5
99,9
98,2
104,5
100,8
101,5
103,9
99,6
98,4
112,7
118,4
108,1
105,4
114,6
106,9
115,9
109,8
101,8
114,2
110,8
108,4
127,5
128,6
116,6
127,4
105,0
108,3
125,0
111,6
106,5
130,3
115,0
116,1
134,0
126,5
125,8
136,4
114,9
110,9
125,5
116,8
116,8
125,5
104,2
115,1
132,8
123,3
124,8
122,0
117,4
117,9
137,4
114,6
124,7
129,6
109,4
120,9
134,9
136,3
133,2
127,2
122,7
120,5
137,8
119,1
124,3
134,4
121,1
122,2
127,7
137,4
132,2
129,2
124,9
124,8
128,2
134,4
118,6
132,6
123,2
112,3


Summary of computational transaction
Raw Inputview raw input (R code)
Raw Outputview raw output of R engine
Computing time3 seconds
R Server'Sir Ronald Aylmer Fisher' @ 193.190.124.24

\begin{tabular}{lllllllll}
\hline
Summary of computational transaction \tabularnewline
Raw Input & view raw input (R code)  \tabularnewline
Raw Output & view raw output of R engine  \tabularnewline
Computing time & 3 seconds \tabularnewline
R Server & 'Sir Ronald Aylmer Fisher' @ 193.190.124.24 \tabularnewline
\hline
\end{tabular}
%Source: https://freestatistics.org/blog/index.php?pk=24231&T=0

[TABLE]
[ROW][C]Summary of computational transaction[/C][/ROW]
[ROW][C]Raw Input[/C][C]view raw input (R code) [/C][/ROW]
[ROW][C]Raw Output[/C][C]view raw output of R engine [/C][/ROW]
[ROW][C]Computing time[/C][C]3 seconds[/C][/ROW]
[ROW][C]R Server[/C][C]'Sir Ronald Aylmer Fisher' @ 193.190.124.24[/C][/ROW]
[/TABLE]
Source: https://freestatistics.org/blog/index.php?pk=24231&T=0

Globally Unique Identifier (entire table): ba.freestatistics.org/blog/index.php?pk=24231&T=0

As an alternative you can also use a QR Code:  

The GUIDs for individual cells are displayed in the table below:

Summary of computational transaction
Raw Inputview raw input (R code)
Raw Outputview raw output of R engine
Computing time3 seconds
R Server'Sir Ronald Aylmer Fisher' @ 193.190.124.24


Box-Cox Linearity Plot
# observations x85
maximum correlation0.0731713370460407
optimal lambda(x)2
Residual SD (orginial)11.2201376278877
Residual SD (transformed)11.1992987362365

\begin{tabular}{lllllllll}
\hline
Box-Cox Linearity Plot \tabularnewline
# observations x & 85 \tabularnewline
maximum correlation & 0.0731713370460407 \tabularnewline
optimal lambda(x) & 2 \tabularnewline
Residual SD (orginial) & 11.2201376278877 \tabularnewline
Residual SD (transformed) & 11.1992987362365 \tabularnewline
\hline
\end{tabular}
%Source: https://freestatistics.org/blog/index.php?pk=24231&T=1

[TABLE]
[ROW][C]Box-Cox Linearity Plot[/C][/ROW]
[ROW][C]# observations x[/C][C]85[/C][/ROW]
[ROW][C]maximum correlation[/C][C]0.0731713370460407[/C][/ROW]
[ROW][C]optimal lambda(x)[/C][C]2[/C][/ROW]
[ROW][C]Residual SD (orginial)[/C][C]11.2201376278877[/C][/ROW]
[ROW][C]Residual SD (transformed)[/C][C]11.1992987362365[/C][/ROW]
[/TABLE]
Source: https://freestatistics.org/blog/index.php?pk=24231&T=1

Globally Unique Identifier (entire table): ba.freestatistics.org/blog/index.php?pk=24231&T=1

As an alternative you can also use a QR Code:  

The GUIDs for individual cells are displayed in the table below:

Box-Cox Linearity Plot
# observations x85
maximum correlation0.0731713370460407
optimal lambda(x)2
Residual SD (orginial)11.2201376278877
Residual SD (transformed)11.1992987362365


Parameters (Session):
Parameters (R input):
R code (references can be found in the software module):
n <- length(x)
c <- array(NA,dim=c(401))
l <- array(NA,dim=c(401))
mx <- 0
mxli <- -999
for (i in 1:401)
{
l[i] <- (i-201)/100
if (l[i] != 0)
{
x1 <- (x^l[i] - 1) / l[i]
} else {
x1 <- log(x)
}
c[i] <- cor(x1,y)
if (mx < abs(c[i]))
{
mx <- abs(c[i])
mxli <- l[i]
}
}
c
mx
mxli
if (mxli != 0)
{
x1 <- (x^mxli - 1) / mxli
} else {
x1 <- log(x)
}
r<-lm(y~x)
se <- sqrt(var(r$residuals))
r1 <- lm(y~x1)
se1 <- sqrt(var(r1$residuals))
bitmap(file='test1.png')
plot(l,c,main='Box-Cox Linearity Plot',xlab='Lambda',ylab='correlation')
grid()
dev.off()
bitmap(file='test2.png')
plot(x,y,main='Linear Fit of Original Data',xlab='x',ylab='y')
abline(r)
grid()
mtext(paste('Residual Standard Deviation = ',se))
dev.off()
bitmap(file='test3.png')
plot(x1,y,main='Linear Fit of Transformed Data',xlab='x',ylab='y')
abline(r1)
grid()
mtext(paste('Residual Standard Deviation = ',se1))
dev.off()
load(file='createtable')
a<-table.start()
a<-table.row.start(a)
a<-table.element(a,'Box-Cox Linearity Plot',2,TRUE)
a<-table.row.end(a)
a<-table.row.start(a)
a<-table.element(a,'# observations x',header=TRUE)
a<-table.element(a,n)
a<-table.row.end(a)
a<-table.row.start(a)
a<-table.element(a,'maximum correlation',header=TRUE)
a<-table.element(a,mx)
a<-table.row.end(a)
a<-table.row.start(a)
a<-table.element(a,'optimal lambda(x)',header=TRUE)
a<-table.element(a,mxli)
a<-table.row.end(a)
a<-table.row.start(a)
a<-table.element(a,'Residual SD (orginial)',header=TRUE)
a<-table.element(a,se)
a<-table.row.end(a)
a<-table.row.start(a)
a<-table.element(a,'Residual SD (transformed)',header=TRUE)
a<-table.element(a,se1)
a<-table.row.end(a)
a<-table.end(a)
table.save(a,file='mytable.tab')