Free Statistics

of Irreproducible Research!

Author's title

Author*Unverified author*
R Software Modulerwasp_boxcoxlin.wasp
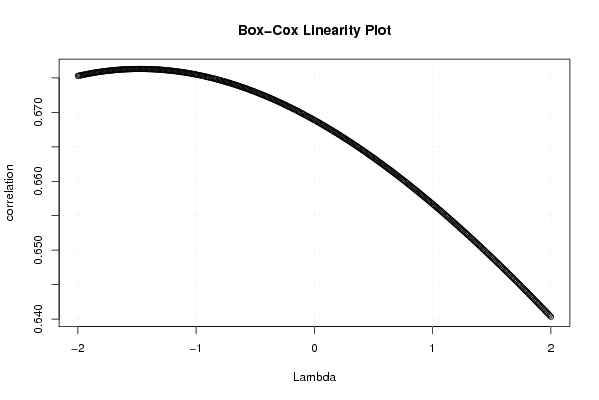
Title produced by softwareBox-Cox Linearity Plot
Date of computationWed, 12 Nov 2008 11:18:20 -0700
Cite this page as followsStatistical Computations at FreeStatistics.org, Office for Research Development and Education, URL https://freestatistics.org/blog/index.php?v=date/2008/Nov/12/t12265147485h82par4le139ea.htm/, Retrieved Sat, 18 May 2024 22:31:19 +0000
Statistical Computations at FreeStatistics.org, Office for Research Development and Education, URL https://freestatistics.org/blog/index.php?pk=24357, Retrieved Sat, 18 May 2024 22:31:19 +0000
QR Codes:

Original text written by user:
IsPrivate?No (this computation is public)
User-defined keywords
Estimated Impact143
Family? (F = Feedback message, R = changed R code, M = changed R Module, P = changed Parameters, D = changed Data)
F       [Box-Cox Linearity Plot] [various eda topic...] [2008-11-12 18:18:20] [b09437381d488816ab9f5cf07e347c02] [Current]
Feedback Forum
2008-11-18 11:33:40 [Loïque Verhasselt] [reply
De student gebruikt hier de juiste methode om de vraag te beantwoorden. We vinden ook de toegepaste formule uitgeschreven in de vorm van een stukje theorie die de student dan omzet in een antwoord naar de gevonden resultaten. Variabelen transformeren voor ze zo meer lineair te krijgen. Elke lambda uitproberen van -2 tot 2, en dan zien welke de beste correlatie heeft. Lamba is de graad van transformatie.
2008-11-19 16:10:14 [Ken Wright] [reply
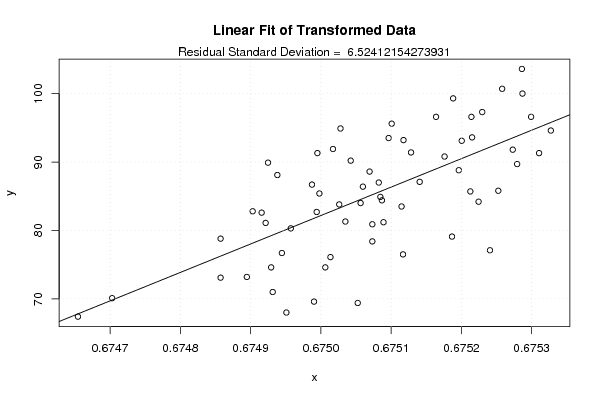
mijn besluit was hier gedeeltelijk fout, de beste waarde zou zich rond de -1.5 bevinden, maar inderdaad heeft de transformatie hier weinig effect gehad. De standaardafwijking is hier maar lichtjes veranderd.
2008-11-23 17:44:25 [Jasmine Hendrikx] [reply
Evaluatie Q3:
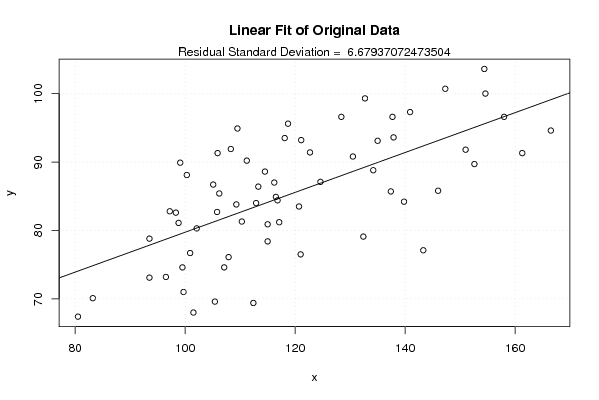
De methode die gebruikt moest worden, is goed uitgevoerd. Er is ook goed uitgelegd wat een box-cox linearity plot juist doet. Men gaat hier dus proberen om een transformatie uit te voeren op de variabele X zodat het verband tussen de twee variabelen groter wordt, dus zodanig dat de scatterplot tussen X en Y zo dicht mogelijk op de rechte ligt. Hier zou nog bij vermeld kunnen worden dat men het verband dus meer lineair probeert te maken zodat het beter door een rechte benaderd kan worden. Hiervoor gaat men de transformatieparameter λ laten schommelen tussen -2 en 2. Er wordt door de student geconcludeerd dat de lambda 0 bedraagt, maar dit is niet correct als we naar de grafiek kijken. De optimale lambda bedraagt -1.48, aangezien de correlatiecoëfficiënt dan zijn hoogste punt bereikt (67.63%). De correlatie heeft hier dus betrekking op de scatterplot. Als we echter deze transformatie uitvoeren met λ gelijk aan -1.48, zien we op de grafieken dat het lineaire verband van de originele data en de transformed data hetzelfde blijft. De x-data zijn wel serieus veranderd, maar dit komt natuurlijk door de transformatie. Er is zoals vermeld geen verbetering opgetreden bij het verband tussen de twee variabelen. Er wordt ook correct opgemerkt dat we een kleine daling in de standaardafwijking kunnen waarnemen, maar deze is wel miniem.

Post a new message
Dataseries X:
83,2
105,1
113,3
99,1
100,3
93,5
98,8
106,2
98,3
102,1
117,1
101,5
80,5
105,9
109,5
97,2
114,5
93,5
100,9
121,1
116,5
109,3
118,1
108,3
105,4
116,2
111,2
105,8
122,7
99,5
107,9
124,6
115
110,3
132,7
99,7
96,5
118,7
112,9
130,5
137,9
115
116,8
140,9
120,7
134,2
147,3
112,4
107,1
128,4
137,7
135
151
137,4
132,4
161,3
139,8
146
166,5
143,3
121
152,6
154,4
154,6
158
Dataseries Y:
70,1
86,7
86,4
89,9
88,1
78,8
81,1
85,4
82,6
80,3
81,2
68
67,4
91,3
94,9
82,8
88,6
73,1
76,7
93,2
84,9
83,8
93,5
91,9
69,6
87
90,2
82,7
91,4
74,6
76,1
87,1
78,4
81,3
99,3
71
73,2
95,6
84
90,8
93,6
80,9
84,4
97,3
83,5
88,8
100,7
69,4
74,6
96,6
96,6
93,1
91,8
85,7
79,1
91,3
84,2
85,8
94,6
77,1
76,5
89,7
103,6
100
96,6


Summary of computational transaction
Raw Inputview raw input (R code)
Raw Outputview raw output of R engine
Computing time1 seconds
R Server'Gwilym Jenkins' @ 72.249.127.135

\begin{tabular}{lllllllll}
\hline
Summary of computational transaction \tabularnewline
Raw Input & view raw input (R code)  \tabularnewline
Raw Output & view raw output of R engine  \tabularnewline
Computing time & 1 seconds \tabularnewline
R Server & 'Gwilym Jenkins' @ 72.249.127.135 \tabularnewline
\hline
\end{tabular}
%Source: https://freestatistics.org/blog/index.php?pk=24357&T=0

[TABLE]
[ROW][C]Summary of computational transaction[/C][/ROW]
[ROW][C]Raw Input[/C][C]view raw input (R code) [/C][/ROW]
[ROW][C]Raw Output[/C][C]view raw output of R engine [/C][/ROW]
[ROW][C]Computing time[/C][C]1 seconds[/C][/ROW]
[ROW][C]R Server[/C][C]'Gwilym Jenkins' @ 72.249.127.135[/C][/ROW]
[/TABLE]
Source: https://freestatistics.org/blog/index.php?pk=24357&T=0

Globally Unique Identifier (entire table): ba.freestatistics.org/blog/index.php?pk=24357&T=0

As an alternative you can also use a QR Code:  

The GUIDs for individual cells are displayed in the table below:

Summary of computational transaction
Raw Inputview raw input (R code)
Raw Outputview raw output of R engine
Computing time1 seconds
R Server'Gwilym Jenkins' @ 72.249.127.135


Box-Cox Linearity Plot
# observations x65
maximum correlation0.676307549005957
optimal lambda(x)-1.48
Residual SD (orginial)6.67937072473504
Residual SD (transformed)6.52412154273931

\begin{tabular}{lllllllll}
\hline
Box-Cox Linearity Plot \tabularnewline
# observations x & 65 \tabularnewline
maximum correlation & 0.676307549005957 \tabularnewline
optimal lambda(x) & -1.48 \tabularnewline
Residual SD (orginial) & 6.67937072473504 \tabularnewline
Residual SD (transformed) & 6.52412154273931 \tabularnewline
\hline
\end{tabular}
%Source: https://freestatistics.org/blog/index.php?pk=24357&T=1

[TABLE]
[ROW][C]Box-Cox Linearity Plot[/C][/ROW]
[ROW][C]# observations x[/C][C]65[/C][/ROW]
[ROW][C]maximum correlation[/C][C]0.676307549005957[/C][/ROW]
[ROW][C]optimal lambda(x)[/C][C]-1.48[/C][/ROW]
[ROW][C]Residual SD (orginial)[/C][C]6.67937072473504[/C][/ROW]
[ROW][C]Residual SD (transformed)[/C][C]6.52412154273931[/C][/ROW]
[/TABLE]
Source: https://freestatistics.org/blog/index.php?pk=24357&T=1

Globally Unique Identifier (entire table): ba.freestatistics.org/blog/index.php?pk=24357&T=1

As an alternative you can also use a QR Code:  

The GUIDs for individual cells are displayed in the table below:

Box-Cox Linearity Plot
# observations x65
maximum correlation0.676307549005957
optimal lambda(x)-1.48
Residual SD (orginial)6.67937072473504
Residual SD (transformed)6.52412154273931


Parameters (Session):
Parameters (R input):
R code (references can be found in the software module):
n <- length(x)
c <- array(NA,dim=c(401))
l <- array(NA,dim=c(401))
mx <- 0
mxli <- -999
for (i in 1:401)
{
l[i] <- (i-201)/100
if (l[i] != 0)
{
x1 <- (x^l[i] - 1) / l[i]
} else {
x1 <- log(x)
}
c[i] <- cor(x1,y)
if (mx < abs(c[i]))
{
mx <- abs(c[i])
mxli <- l[i]
}
}
c
mx
mxli
if (mxli != 0)
{
x1 <- (x^mxli - 1) / mxli
} else {
x1 <- log(x)
}
r<-lm(y~x)
se <- sqrt(var(r$residuals))
r1 <- lm(y~x1)
se1 <- sqrt(var(r1$residuals))
bitmap(file='test1.png')
plot(l,c,main='Box-Cox Linearity Plot',xlab='Lambda',ylab='correlation')
grid()
dev.off()
bitmap(file='test2.png')
plot(x,y,main='Linear Fit of Original Data',xlab='x',ylab='y')
abline(r)
grid()
mtext(paste('Residual Standard Deviation = ',se))
dev.off()
bitmap(file='test3.png')
plot(x1,y,main='Linear Fit of Transformed Data',xlab='x',ylab='y')
abline(r1)
grid()
mtext(paste('Residual Standard Deviation = ',se1))
dev.off()
load(file='createtable')
a<-table.start()
a<-table.row.start(a)
a<-table.element(a,'Box-Cox Linearity Plot',2,TRUE)
a<-table.row.end(a)
a<-table.row.start(a)
a<-table.element(a,'# observations x',header=TRUE)
a<-table.element(a,n)
a<-table.row.end(a)
a<-table.row.start(a)
a<-table.element(a,'maximum correlation',header=TRUE)
a<-table.element(a,mx)
a<-table.row.end(a)
a<-table.row.start(a)
a<-table.element(a,'optimal lambda(x)',header=TRUE)
a<-table.element(a,mxli)
a<-table.row.end(a)
a<-table.row.start(a)
a<-table.element(a,'Residual SD (orginial)',header=TRUE)
a<-table.element(a,se)
a<-table.row.end(a)
a<-table.row.start(a)
a<-table.element(a,'Residual SD (transformed)',header=TRUE)
a<-table.element(a,se1)
a<-table.row.end(a)
a<-table.end(a)
table.save(a,file='mytable.tab')