Free Statistics
of Irreproducible Research!
Description of Statistical Computation | |||||||||||||||||||||||||||||||||||||||||
|---|---|---|---|---|---|---|---|---|---|---|---|---|---|---|---|---|---|---|---|---|---|---|---|---|---|---|---|---|---|---|---|---|---|---|---|---|---|---|---|---|---|
| Author's title | |||||||||||||||||||||||||||||||||||||||||
| Author | *Unverified author* | ||||||||||||||||||||||||||||||||||||||||
| R Software Module | rwasp_univariatedataseries.wasp | ||||||||||||||||||||||||||||||||||||||||
| Title produced by software | Univariate Data Series | ||||||||||||||||||||||||||||||||||||||||
| Date of computation | Mon, 13 Oct 2008 01:49:48 -0600 | ||||||||||||||||||||||||||||||||||||||||
| Cite this page as follows | Statistical Computations at FreeStatistics.org, Office for Research Development and Education, URL https://freestatistics.org/blog/index.php?v=date/2008/Oct/13/t1223884285p21lldq06cs57em.htm/, Retrieved Sat, 18 May 2024 15:40:40 +0000 | ||||||||||||||||||||||||||||||||||||||||
| Statistical Computations at FreeStatistics.org, Office for Research Development and Education, URL https://freestatistics.org/blog/index.php?pk=15563, Retrieved Sat, 18 May 2024 15:40:40 +0000 | |||||||||||||||||||||||||||||||||||||||||
| QR Codes: | |||||||||||||||||||||||||||||||||||||||||
|
| |||||||||||||||||||||||||||||||||||||||||
| Original text written by user: | |||||||||||||||||||||||||||||||||||||||||
| IsPrivate? | No (this computation is public) | ||||||||||||||||||||||||||||||||||||||||
| User-defined keywords | |||||||||||||||||||||||||||||||||||||||||
| Estimated Impact | 318 | ||||||||||||||||||||||||||||||||||||||||
Tree of Dependent Computations | |||||||||||||||||||||||||||||||||||||||||
| Family? (F = Feedback message, R = changed R code, M = changed R Module, P = changed Parameters, D = changed Data) | |||||||||||||||||||||||||||||||||||||||||
| F [Univariate Data Series] [Indicator van het...] [2008-10-13 07:49:48] [e7b118d7688fea522247297d6fc6c452] [Current] - PD [Univariate Data Series] [Prijsindexcijfers...] [2008-10-14 18:50:27] [46c5a5fbda57fdfa1d4ef48658f82a0c] - PD [Univariate Data Series] [Prijsindexcijfers...] [2008-10-14 18:54:33] [46c5a5fbda57fdfa1d4ef48658f82a0c] - PD [Univariate Data Series] [Prijsindexcijfers...] [2008-10-14 18:58:10] [46c5a5fbda57fdfa1d4ef48658f82a0c] - PD [Univariate Data Series] [Prijsindexcijfers...] [2008-10-14 19:04:41] [46c5a5fbda57fdfa1d4ef48658f82a0c] - PD [Univariate Data Series] [Bouwvergunningen ...] [2008-10-15 14:27:43] [46c5a5fbda57fdfa1d4ef48658f82a0c] - PD [Univariate Data Series] [Bouwvergunningen ...] [2008-10-15 14:34:35] [46c5a5fbda57fdfa1d4ef48658f82a0c] - PD [Univariate Data Series] [Bouwvergunningen ...] [2008-10-15 14:36:43] [46c5a5fbda57fdfa1d4ef48658f82a0c] - PD [Univariate Data Series] [Bouwvergunningen ...] [2008-10-15 14:38:51] [46c5a5fbda57fdfa1d4ef48658f82a0c] - PD [Univariate Data Series] [Indicator van het...] [2008-10-20 07:10:04] [b5373f20234c18c6452d5f98d8abf0fe] | |||||||||||||||||||||||||||||||||||||||||
| Feedback Forum | |||||||||||||||||||||||||||||||||||||||||
Post a new message | |||||||||||||||||||||||||||||||||||||||||
Dataset | |||||||||||||||||||||||||||||||||||||||||
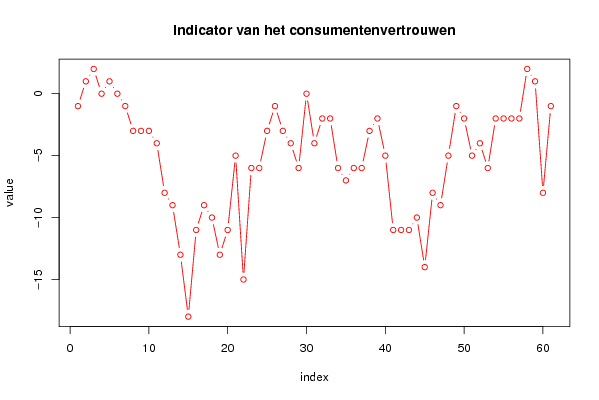
| Dataseries X: | |||||||||||||||||||||||||||||||||||||||||
-1 1 2 0 1 0 -1 -3 -3 -3 -4 -8 -9 -13 -18 -11 -9 -10 -13 -11 -5 -15 -6 -6 -3 -1 -3 -4 -6 0 -4 -2 -2 -6 -7 -6 -6 -3 -2 -5 -11 -11 -11 -10 -14 -8 -9 -5 -1 -2 -5 -4 -6 -2 -2 -2 -2 2 1 -8 -1 | |||||||||||||||||||||||||||||||||||||||||
Tables (Output of Computation) | |||||||||||||||||||||||||||||||||||||||||
| |||||||||||||||||||||||||||||||||||||||||
Figures (Output of Computation) | |||||||||||||||||||||||||||||||||||||||||
Input Parameters & R Code | |||||||||||||||||||||||||||||||||||||||||
| Parameters (Session): | |||||||||||||||||||||||||||||||||||||||||
| par1 = Indicator van het consumentenvertrouwen ; par2 = http://www.nbb.be/belgostat/PublicatieSelectieLinker?LinkID=227000010|910000082&Lang=N ; | |||||||||||||||||||||||||||||||||||||||||
| Parameters (R input): | |||||||||||||||||||||||||||||||||||||||||
| par1 = Indicator van het consumentenvertrouwen ; par2 = http://www.nbb.be/belgostat/PublicatieSelectieLinker?LinkID=227000010|910000082&Lang=N ; par3 = ; | |||||||||||||||||||||||||||||||||||||||||
| R code (references can be found in the software module): | |||||||||||||||||||||||||||||||||||||||||
bitmap(file='test1.png') | |||||||||||||||||||||||||||||||||||||||||