Free Statistics
of Irreproducible Research!
Description of Statistical Computation | |||||||||||||||||||||||||||||||||||||||||
|---|---|---|---|---|---|---|---|---|---|---|---|---|---|---|---|---|---|---|---|---|---|---|---|---|---|---|---|---|---|---|---|---|---|---|---|---|---|---|---|---|---|
| Author's title | |||||||||||||||||||||||||||||||||||||||||
| Author | *The author of this computation has been verified* | ||||||||||||||||||||||||||||||||||||||||
| R Software Module | rwasp_univariatedataseries.wasp | ||||||||||||||||||||||||||||||||||||||||
| Title produced by software | Univariate Data Series | ||||||||||||||||||||||||||||||||||||||||
| Date of computation | Mon, 13 Oct 2008 16:15:57 -0600 | ||||||||||||||||||||||||||||||||||||||||
| Cite this page as follows | Statistical Computations at FreeStatistics.org, Office for Research Development and Education, URL https://freestatistics.org/blog/index.php?v=date/2008/Oct/14/t1223936211qukvsx8dm2y9xds.htm/, Retrieved Sat, 18 May 2024 13:39:26 +0000 | ||||||||||||||||||||||||||||||||||||||||
| Statistical Computations at FreeStatistics.org, Office for Research Development and Education, URL https://freestatistics.org/blog/index.php?pk=16126, Retrieved Sat, 18 May 2024 13:39:26 +0000 | |||||||||||||||||||||||||||||||||||||||||
| QR Codes: | |||||||||||||||||||||||||||||||||||||||||
|
| |||||||||||||||||||||||||||||||||||||||||
| Original text written by user: | |||||||||||||||||||||||||||||||||||||||||
| IsPrivate? | No (this computation is public) | ||||||||||||||||||||||||||||||||||||||||
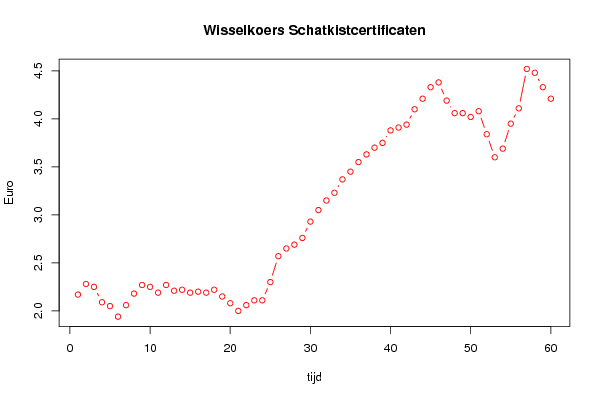
| User-defined keywords | Wisselkoers Schatkistcertificaten | ||||||||||||||||||||||||||||||||||||||||
| Estimated Impact | 169 | ||||||||||||||||||||||||||||||||||||||||
Tree of Dependent Computations | |||||||||||||||||||||||||||||||||||||||||
| Family? (F = Feedback message, R = changed R code, M = changed R Module, P = changed Parameters, D = changed Data) | |||||||||||||||||||||||||||||||||||||||||
| F [Univariate Data Series] [Wisselkoers Schat...] [2008-10-13 22:15:57] [c33ddd06d9ea3933c8ac89c0e74c9b3a] [Current] - PD [Univariate Data Series] [Rentevoet schatki...] [2008-10-20 20:04:02] [82970caad4b026be9dd352fdec547fe4] - RMP [Univariate Explorative Data Analysis] [Investigating Dis...] [2008-10-26 20:33:58] [82970caad4b026be9dd352fdec547fe4] | |||||||||||||||||||||||||||||||||||||||||
| Feedback Forum | |||||||||||||||||||||||||||||||||||||||||
Post a new message | |||||||||||||||||||||||||||||||||||||||||
Dataset | |||||||||||||||||||||||||||||||||||||||||
| Dataseries X: | |||||||||||||||||||||||||||||||||||||||||
2,17 2,28 2,25 2,09 2,05 1,94 2,06 2,18 2,27 2,25 2,19 2,27 2,21 2,22 2,19 2,2 2,19 2,22 2,15 2,08 2 2,06 2,11 2,11 2,3 2,57 2,65 2,69 2,76 2,93 3,05 3,15 3,23 3,37 3,45 3,55 3,63 3,7 3,75 3,88 3,91 3,94 4,1 4,21 4,33 4,38 4,19 4,06 4,06 4,02 4,08 3,84 3,6 3,69 3,95 4,11 4,52 4,48 4,33 4,21 | |||||||||||||||||||||||||||||||||||||||||
Tables (Output of Computation) | |||||||||||||||||||||||||||||||||||||||||
| |||||||||||||||||||||||||||||||||||||||||
Figures (Output of Computation) | |||||||||||||||||||||||||||||||||||||||||
Input Parameters & R Code | |||||||||||||||||||||||||||||||||||||||||
| Parameters (Session): | |||||||||||||||||||||||||||||||||||||||||
| par1 = Rentevoet Schatkistcertificaten ; par2 = Belgostat ; par3 = Wisselkoers Schatkistcertificaten ; | |||||||||||||||||||||||||||||||||||||||||
| Parameters (R input): | |||||||||||||||||||||||||||||||||||||||||
| par1 = Rentevoet Schatkistcertificaten ; par2 = Belgostat ; par3 = Wisselkoers Schatkistcertificaten ; | |||||||||||||||||||||||||||||||||||||||||
| R code (references can be found in the software module): | |||||||||||||||||||||||||||||||||||||||||
bitmap(file='test1.png') | |||||||||||||||||||||||||||||||||||||||||