Free Statistics
of Irreproducible Research!
Description of Statistical Computation | |||||||||||||||||||||||||||||||||||||||||
|---|---|---|---|---|---|---|---|---|---|---|---|---|---|---|---|---|---|---|---|---|---|---|---|---|---|---|---|---|---|---|---|---|---|---|---|---|---|---|---|---|---|
| Author's title | |||||||||||||||||||||||||||||||||||||||||
| Author | *Unverified author* | ||||||||||||||||||||||||||||||||||||||||
| R Software Module | rwasp_univariatedataseries.wasp | ||||||||||||||||||||||||||||||||||||||||
| Title produced by software | Univariate Data Series | ||||||||||||||||||||||||||||||||||||||||
| Date of computation | Sat, 18 Oct 2008 12:11:13 -0600 | ||||||||||||||||||||||||||||||||||||||||
| Cite this page as follows | Statistical Computations at FreeStatistics.org, Office for Research Development and Education, URL https://freestatistics.org/blog/index.php?v=date/2008/Oct/18/t1224353671yw1p4keyiwlehzk.htm/, Retrieved Sat, 18 May 2024 11:02:02 +0000 | ||||||||||||||||||||||||||||||||||||||||
| Statistical Computations at FreeStatistics.org, Office for Research Development and Education, URL https://freestatistics.org/blog/index.php?pk=16688, Retrieved Sat, 18 May 2024 11:02:02 +0000 | |||||||||||||||||||||||||||||||||||||||||
| QR Codes: | |||||||||||||||||||||||||||||||||||||||||
|
| |||||||||||||||||||||||||||||||||||||||||
| Original text written by user: | |||||||||||||||||||||||||||||||||||||||||
| IsPrivate? | No (this computation is public) | ||||||||||||||||||||||||||||||||||||||||
| User-defined keywords | |||||||||||||||||||||||||||||||||||||||||
| Estimated Impact | 127 | ||||||||||||||||||||||||||||||||||||||||
Tree of Dependent Computations | |||||||||||||||||||||||||||||||||||||||||
| Family? (F = Feedback message, R = changed R code, M = changed R Module, P = changed Parameters, D = changed Data) | |||||||||||||||||||||||||||||||||||||||||
| - [Univariate Data Series] [Nick Follens MAR ...] [2008-10-18 18:11:13] [ba18944569328e96e17470d191849aa8] [Current] - RMP [Histogram] [] [2008-10-18 18:40:35] [7b3d5b215418629d194620f174e04f44] - RMP [Kernel Density Estimation] [] [2008-10-18 18:43:03] [7b3d5b215418629d194620f174e04f44] - RMPD [Notched Boxplots] [] [2008-10-18 18:49:20] [7b3d5b215418629d194620f174e04f44] - RMP [Notched Boxplots] [Nick Follens MAR203A] [2008-10-18 18:56:34] [7b3d5b215418629d194620f174e04f44] - RMPD [Harrell-Davis Quantiles] [Nick Follens MAR ...] [2008-10-18 19:13:18] [7b3d5b215418629d194620f174e04f44] | |||||||||||||||||||||||||||||||||||||||||
| Feedback Forum | |||||||||||||||||||||||||||||||||||||||||
Post a new message | |||||||||||||||||||||||||||||||||||||||||
Dataset | |||||||||||||||||||||||||||||||||||||||||
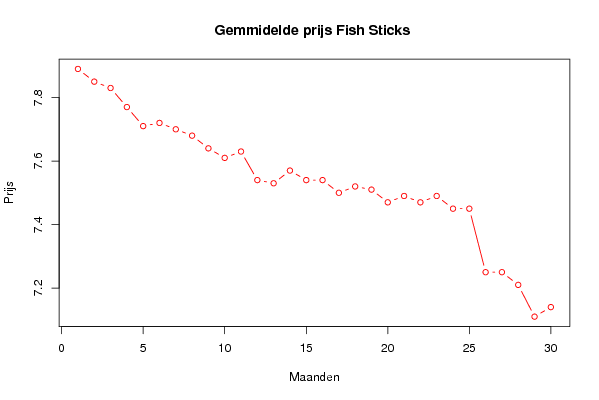
| Dataseries X: | |||||||||||||||||||||||||||||||||||||||||
7.89 7.85 7.83 7.77 7.71 7.72 7.7 7.68 7.64 7.61 7.63 7.54 7.53 7.57 7.54 7.54 7.5 7.52 7.51 7.47 7.49 7.47 7.49 7.45 7.45 7.25 7.25 7.21 7.11 7.14 | |||||||||||||||||||||||||||||||||||||||||
Tables (Output of Computation) | |||||||||||||||||||||||||||||||||||||||||
| |||||||||||||||||||||||||||||||||||||||||
Figures (Output of Computation) | |||||||||||||||||||||||||||||||||||||||||
Input Parameters & R Code | |||||||||||||||||||||||||||||||||||||||||
| Parameters (Session): | |||||||||||||||||||||||||||||||||||||||||
| par1 = Prijs Fish Stick ; par2 = www.nbb.be ; par3 = Prijs Fish Stick ; | |||||||||||||||||||||||||||||||||||||||||
| Parameters (R input): | |||||||||||||||||||||||||||||||||||||||||
| par1 = Prijs Fish Stick ; par2 = www.nbb.be ; par3 = Prijs Fish Stick ; | |||||||||||||||||||||||||||||||||||||||||
| R code (references can be found in the software module): | |||||||||||||||||||||||||||||||||||||||||
bitmap(file='test1.png') | |||||||||||||||||||||||||||||||||||||||||