Free Statistics

of Irreproducible Research!

Author's title

Author*The author of this computation has been verified*
R Software Modulerwasp_autocorrelation.wasp
Title produced by software(Partial) Autocorrelation Function
Date of computationThu, 23 Oct 2008 04:50:20 -0600
Cite this page as followsStatistical Computations at FreeStatistics.org, Office for Research Development and Education, URL https://freestatistics.org/blog/index.php?v=date/2008/Oct/23/t1224759094ndzabi07nm64x3h.htm/, Retrieved Sat, 18 May 2024 13:39:30 +0000
Statistical Computations at FreeStatistics.org, Office for Research Development and Education, URL https://freestatistics.org/blog/index.php?pk=18456, Retrieved Sat, 18 May 2024 13:39:30 +0000
QR Codes:

Original text written by user:
IsPrivate?No (this computation is public)
User-defined keywords
Estimated Impact257
Family? (F = Feedback message, R = changed R code, M = changed R Module, P = changed Parameters, D = changed Data)
F     [Univariate Explorative Data Analysis] [Investigation Dis...] [2007-10-21 17:06:37] [b9964c45117f7aac638ab9056d451faa]
F RMPD    [(Partial) Autocorrelation Function] [Q4] [2008-10-23 10:50:20] [75a00449045803b2332dacf227dc78d5] [Current]
F           [(Partial) Autocorrelation Function] [] [2008-10-27 17:28:52] [af90f76a5211a482a7c35f2c76d2fd61]
F           [(Partial) Autocorrelation Function] [Investigation Dis...] [2008-10-27 19:03:35] [79c17183721a40a589db5f9f561947d8]
F RMPD      [Harrell-Davis Quantiles] [Investigation Dis...] [2008-10-27 19:19:14] [79c17183721a40a589db5f9f561947d8]
-   P       [(Partial) Autocorrelation Function] [Reproductie] [2008-11-02 18:42:18] [5e74953d94072114d25d7276793b561e]
Feedback Forum
2008-10-29 13:15:51 [Ken Van den Heuvel] [reply
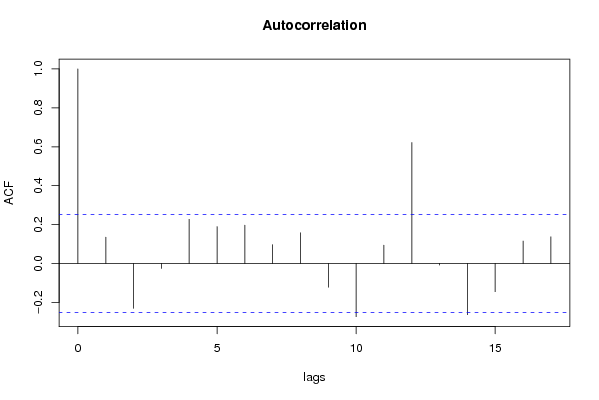
Je stelt: Als men kijkt naar de tabel van de autocorrelatie fixed die de volgende periode met de vorige periode vergelijkt, dan zien we geen terugkomende series. Wel zien we één outliner die laat vermoeden dat er wel seizoensgebondenheid is.

Seizoensgebondenheid = terugkomende series (in principe)... hoe je tot deze conclusie bent gekomen is me dus niet meteen duidelijk.

Trouwens, kijk naar de Run Sequence Plot en je ziet hier telkens afwisselend 2 dunne pieken en 1 dikke piek.

http://www.freestatistics.org/blog/index.php?v=date/2008/Oct/27/t1225139585s9u6azvjfyri7k5.htm
2008-10-29 14:05:04 [Tom Ardies] [reply
Er is seizoensgebondenheid want als je in de lagplot kijkt naar de lags 12 en 24 dan zie je dat er autocorrelatie is. Dit betekent seizonaliteit.

Link voor de lags: http://www.freestatistics.org/blog/index.php?v=date/2008/Oct/29/t12252874301t29xy3nalko90s.htm
2008-11-01 12:36:29 [Matthieu Blondeau] [reply
Ik zou ook eerder naar de run sequence plot kijken. Daar kan men inderdaad 2 dunne en 1 dikke piek zien die terugkomt. Dit wijst op seizoenaliteit.
2008-11-01 19:58:25 [Steffi Van Isveldt] [reply
Men kan hier inderdaad wel van een positieve seizonale autocorrelatie spreken. Ik vind dit het gemakkelijkst na te gaan door de lag plots op maximaal te zetten (36).
http://www.freestatistics.org/blog/date/2008/Nov/01/t12255515665j9whbwaj66jspq.htm
2008-11-02 12:47:05 [Ciska Tanghe] [reply
Om deze vraag op te lossen, moet je op de grafiek Run Sequence Plot kijken. In de tweede helft van de grafiek zie je telkens een dikkere piek gevolgd door twee kleinere pieken. We stellen dus vast dat er een kleine seizoenaliteit is.
2008-11-02 18:47:42 [Annelies Michiels] [reply
Als we de lag plots vergroten naar bv. 36 lags:
http://www.freestatistics.org/blog/index.php?v=date/2008/Nov/02/t1225651479kxi9vvnqvrkkqey.htm
Zien we dat er wel correlatie is.

Als we kijken naar maand 12 en naar maand 24 kunnen we zien dat deze piek zich dus herhaalt.
We kunnen dus spreken van seizoenaliteit.

We kunnnen dus concluderen dat er wel autocorrelatie is waardoor de tijdreeks niet random is.
2008-11-03 08:57:07 [Jeroen Michel] [reply
Er is inderdaad sprake van seizoenaliteit. Hou er wel rekening mee dat het verstandigste is om te kijken naar de 'Run Sequence Plot'. Op onderstaande link is dit inderdaad waar te nemen.

http://www.freestatistics.org/blog/index.php?v=date/2008/Oct/26/t1225019641e25eju4oa46tzqb.htm/
2008-11-03 09:32:11 [Dorien Peeters] [reply
Ik zou eerder naar de run sequence plot kijken. Hier zie je een dalende trend, die toch belangrijk genoeg is om als seizoenseffect te beschouwen.
2008-11-03 09:56:17 [Dorien Peeters] [reply
Seizoenaliteit is hier NIET belangrijk voor de analyse. Auto-correlatie kan ons helpen, maar ook andere methode, namelijk: mean plot (=> nauwkeuriger antwoorden op de vragen)
2008-11-03 19:26:37 [Joris Deboel] [reply
Als je naar de run sequence plot kijkt zie je twee pieken terugkomen. We stellen dus vast dat er seizoenaliteit is.
2008-11-03 21:39:20 [Bart Haemels] [reply
JE spreekt je eigen een beetje tegen door te zeggen dat er geen terugkomende series zijn, maar dat er wel een piek is die seizoenaliteit doet vermoeden?
Zet je lagin het vervolg op 24 of 36 Dan kan je snel en duidelijk zien dat er seizoenaliteit is. Of zoals de andere zeggen bestudeer je Run Sequence plot iets grondiger.
2008-11-03 21:40:38 [Bart Haemels] [reply
http://www.freestatistics.org/blog/index.php?v=date/2008/Nov/03/t1225746268a2noilqvx6lvskc.htm Op deze link kan je de seizoenaliteit zien op de autocorrelation fucntie.

Post a new message
Dataseries X:
109.20
88.60
94.30
98.30
86.40
80.60
104.10
108.20
93.40
71.90
94.10
94.90
96.40
91.10
84.40
86.40
88.00
75.10
109.70
103.00
82.10
68.00
96.40
94.30
90.00
88.00
76.10
82.50
81.40
66.50
97.20
94.10
80.70
70.50
87.80
89.50
99.60
84.20
75.10
92.00
80.80
73.10
99.80
90.00
83.10
72.40
78.80
87.30
91.00
80.10
73.60
86.40
74.50
71.20
92.40
81.50
85.30
69.90
84.20
90.70
100.30


Summary of computational transaction
Raw Inputview raw input (R code)
Raw Outputview raw output of R engine
Computing time2 seconds
R Server'Gwilym Jenkins' @ 72.249.127.135

\begin{tabular}{lllllllll}
\hline
Summary of computational transaction \tabularnewline
Raw Input & view raw input (R code)  \tabularnewline
Raw Output & view raw output of R engine  \tabularnewline
Computing time & 2 seconds \tabularnewline
R Server & 'Gwilym Jenkins' @ 72.249.127.135 \tabularnewline
\hline
\end{tabular}
%Source: https://freestatistics.org/blog/index.php?pk=18456&T=0

[TABLE]
[ROW][C]Summary of computational transaction[/C][/ROW]
[ROW][C]Raw Input[/C][C]view raw input (R code) [/C][/ROW]
[ROW][C]Raw Output[/C][C]view raw output of R engine [/C][/ROW]
[ROW][C]Computing time[/C][C]2 seconds[/C][/ROW]
[ROW][C]R Server[/C][C]'Gwilym Jenkins' @ 72.249.127.135[/C][/ROW]
[/TABLE]
Source: https://freestatistics.org/blog/index.php?pk=18456&T=0

Globally Unique Identifier (entire table): ba.freestatistics.org/blog/index.php?pk=18456&T=0

As an alternative you can also use a QR Code:  

The GUIDs for individual cells are displayed in the table below:

Summary of computational transaction
Raw Inputview raw input (R code)
Raw Outputview raw output of R engine
Computing time2 seconds
R Server'Gwilym Jenkins' @ 72.249.127.135


Autocorrelation Function
Time lag kACF(k)T-STATP-value
10.1348681.05340.148167
2-0.230388-1.79940.038452
3-0.025856-0.20190.420317
40.2268231.77150.040733
50.1893471.47880.072164
60.1969711.53840.064562
70.0967310.75550.226431
80.1573531.2290.111903
9-0.121757-0.9510.172691
10-0.273532-2.13640.018336
110.0938150.73270.233269
120.6218644.85694e-06
13-0.008279-0.06470.474327
14-0.26372-2.05970.02185
15-0.145361-1.13530.130345
160.1151760.89960.185948
170.1370871.07070.144266

\begin{tabular}{lllllllll}
\hline
Autocorrelation Function \tabularnewline
Time lag k & ACF(k) & T-STAT & P-value \tabularnewline
1 & 0.134868 & 1.0534 & 0.148167 \tabularnewline
2 & -0.230388 & -1.7994 & 0.038452 \tabularnewline
3 & -0.025856 & -0.2019 & 0.420317 \tabularnewline
4 & 0.226823 & 1.7715 & 0.040733 \tabularnewline
5 & 0.189347 & 1.4788 & 0.072164 \tabularnewline
6 & 0.196971 & 1.5384 & 0.064562 \tabularnewline
7 & 0.096731 & 0.7555 & 0.226431 \tabularnewline
8 & 0.157353 & 1.229 & 0.111903 \tabularnewline
9 & -0.121757 & -0.951 & 0.172691 \tabularnewline
10 & -0.273532 & -2.1364 & 0.018336 \tabularnewline
11 & 0.093815 & 0.7327 & 0.233269 \tabularnewline
12 & 0.621864 & 4.8569 & 4e-06 \tabularnewline
13 & -0.008279 & -0.0647 & 0.474327 \tabularnewline
14 & -0.26372 & -2.0597 & 0.02185 \tabularnewline
15 & -0.145361 & -1.1353 & 0.130345 \tabularnewline
16 & 0.115176 & 0.8996 & 0.185948 \tabularnewline
17 & 0.137087 & 1.0707 & 0.144266 \tabularnewline
\hline
\end{tabular}
%Source: https://freestatistics.org/blog/index.php?pk=18456&T=1

[TABLE]
[ROW][C]Autocorrelation Function[/C][/ROW]
[ROW][C]Time lag k[/C][C]ACF(k)[/C][C]T-STAT[/C][C]P-value[/C][/ROW]
[ROW][C]1[/C][C]0.134868[/C][C]1.0534[/C][C]0.148167[/C][/ROW]
[ROW][C]2[/C][C]-0.230388[/C][C]-1.7994[/C][C]0.038452[/C][/ROW]
[ROW][C]3[/C][C]-0.025856[/C][C]-0.2019[/C][C]0.420317[/C][/ROW]
[ROW][C]4[/C][C]0.226823[/C][C]1.7715[/C][C]0.040733[/C][/ROW]
[ROW][C]5[/C][C]0.189347[/C][C]1.4788[/C][C]0.072164[/C][/ROW]
[ROW][C]6[/C][C]0.196971[/C][C]1.5384[/C][C]0.064562[/C][/ROW]
[ROW][C]7[/C][C]0.096731[/C][C]0.7555[/C][C]0.226431[/C][/ROW]
[ROW][C]8[/C][C]0.157353[/C][C]1.229[/C][C]0.111903[/C][/ROW]
[ROW][C]9[/C][C]-0.121757[/C][C]-0.951[/C][C]0.172691[/C][/ROW]
[ROW][C]10[/C][C]-0.273532[/C][C]-2.1364[/C][C]0.018336[/C][/ROW]
[ROW][C]11[/C][C]0.093815[/C][C]0.7327[/C][C]0.233269[/C][/ROW]
[ROW][C]12[/C][C]0.621864[/C][C]4.8569[/C][C]4e-06[/C][/ROW]
[ROW][C]13[/C][C]-0.008279[/C][C]-0.0647[/C][C]0.474327[/C][/ROW]
[ROW][C]14[/C][C]-0.26372[/C][C]-2.0597[/C][C]0.02185[/C][/ROW]
[ROW][C]15[/C][C]-0.145361[/C][C]-1.1353[/C][C]0.130345[/C][/ROW]
[ROW][C]16[/C][C]0.115176[/C][C]0.8996[/C][C]0.185948[/C][/ROW]
[ROW][C]17[/C][C]0.137087[/C][C]1.0707[/C][C]0.144266[/C][/ROW]
[/TABLE]
Source: https://freestatistics.org/blog/index.php?pk=18456&T=1

Globally Unique Identifier (entire table): ba.freestatistics.org/blog/index.php?pk=18456&T=1

As an alternative you can also use a QR Code:  

The GUIDs for individual cells are displayed in the table below:

Autocorrelation Function
Time lag kACF(k)T-STATP-value
10.1348681.05340.148167
2-0.230388-1.79940.038452
3-0.025856-0.20190.420317
40.2268231.77150.040733
50.1893471.47880.072164
60.1969711.53840.064562
70.0967310.75550.226431
80.1573531.2290.111903
9-0.121757-0.9510.172691
10-0.273532-2.13640.018336
110.0938150.73270.233269
120.6218644.85694e-06
13-0.008279-0.06470.474327
14-0.26372-2.05970.02185
15-0.145361-1.13530.130345
160.1151760.89960.185948
170.1370871.07070.144266


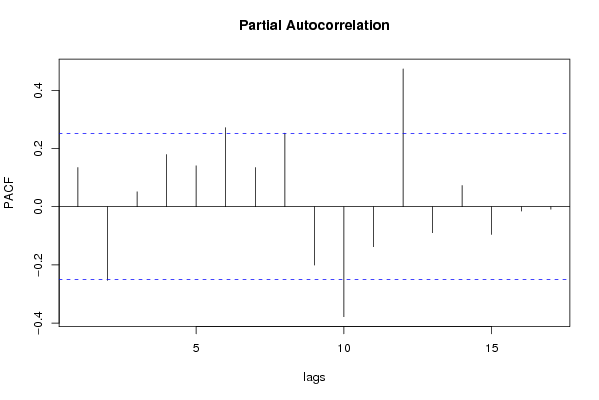
Partial Autocorrelation Function
Time lag kPACF(k)T-STATP-value
10.1348681.05340.148167
2-0.253183-1.97740.026259
30.0513990.40140.344751
40.1792421.39990.083301
50.1406331.09840.138178
60.2718562.12330.018899
70.1344911.05040.148838
80.2529031.97520.026385
9-0.200811-1.56840.060983
10-0.378002-2.95230.002236
11-0.137616-1.07480.143345
120.4737473.70010.000232
13-0.089353-0.69790.243955
140.0727080.56790.286104
15-0.09552-0.7460.229255
16-0.014972-0.11690.453649
17-0.008653-0.06760.473169

\begin{tabular}{lllllllll}
\hline
Partial Autocorrelation Function \tabularnewline
Time lag k & PACF(k) & T-STAT & P-value \tabularnewline
1 & 0.134868 & 1.0534 & 0.148167 \tabularnewline
2 & -0.253183 & -1.9774 & 0.026259 \tabularnewline
3 & 0.051399 & 0.4014 & 0.344751 \tabularnewline
4 & 0.179242 & 1.3999 & 0.083301 \tabularnewline
5 & 0.140633 & 1.0984 & 0.138178 \tabularnewline
6 & 0.271856 & 2.1233 & 0.018899 \tabularnewline
7 & 0.134491 & 1.0504 & 0.148838 \tabularnewline
8 & 0.252903 & 1.9752 & 0.026385 \tabularnewline
9 & -0.200811 & -1.5684 & 0.060983 \tabularnewline
10 & -0.378002 & -2.9523 & 0.002236 \tabularnewline
11 & -0.137616 & -1.0748 & 0.143345 \tabularnewline
12 & 0.473747 & 3.7001 & 0.000232 \tabularnewline
13 & -0.089353 & -0.6979 & 0.243955 \tabularnewline
14 & 0.072708 & 0.5679 & 0.286104 \tabularnewline
15 & -0.09552 & -0.746 & 0.229255 \tabularnewline
16 & -0.014972 & -0.1169 & 0.453649 \tabularnewline
17 & -0.008653 & -0.0676 & 0.473169 \tabularnewline
\hline
\end{tabular}
%Source: https://freestatistics.org/blog/index.php?pk=18456&T=2

[TABLE]
[ROW][C]Partial Autocorrelation Function[/C][/ROW]
[ROW][C]Time lag k[/C][C]PACF(k)[/C][C]T-STAT[/C][C]P-value[/C][/ROW]
[ROW][C]1[/C][C]0.134868[/C][C]1.0534[/C][C]0.148167[/C][/ROW]
[ROW][C]2[/C][C]-0.253183[/C][C]-1.9774[/C][C]0.026259[/C][/ROW]
[ROW][C]3[/C][C]0.051399[/C][C]0.4014[/C][C]0.344751[/C][/ROW]
[ROW][C]4[/C][C]0.179242[/C][C]1.3999[/C][C]0.083301[/C][/ROW]
[ROW][C]5[/C][C]0.140633[/C][C]1.0984[/C][C]0.138178[/C][/ROW]
[ROW][C]6[/C][C]0.271856[/C][C]2.1233[/C][C]0.018899[/C][/ROW]
[ROW][C]7[/C][C]0.134491[/C][C]1.0504[/C][C]0.148838[/C][/ROW]
[ROW][C]8[/C][C]0.252903[/C][C]1.9752[/C][C]0.026385[/C][/ROW]
[ROW][C]9[/C][C]-0.200811[/C][C]-1.5684[/C][C]0.060983[/C][/ROW]
[ROW][C]10[/C][C]-0.378002[/C][C]-2.9523[/C][C]0.002236[/C][/ROW]
[ROW][C]11[/C][C]-0.137616[/C][C]-1.0748[/C][C]0.143345[/C][/ROW]
[ROW][C]12[/C][C]0.473747[/C][C]3.7001[/C][C]0.000232[/C][/ROW]
[ROW][C]13[/C][C]-0.089353[/C][C]-0.6979[/C][C]0.243955[/C][/ROW]
[ROW][C]14[/C][C]0.072708[/C][C]0.5679[/C][C]0.286104[/C][/ROW]
[ROW][C]15[/C][C]-0.09552[/C][C]-0.746[/C][C]0.229255[/C][/ROW]
[ROW][C]16[/C][C]-0.014972[/C][C]-0.1169[/C][C]0.453649[/C][/ROW]
[ROW][C]17[/C][C]-0.008653[/C][C]-0.0676[/C][C]0.473169[/C][/ROW]
[/TABLE]
Source: https://freestatistics.org/blog/index.php?pk=18456&T=2

Globally Unique Identifier (entire table): ba.freestatistics.org/blog/index.php?pk=18456&T=2

As an alternative you can also use a QR Code:  

The GUIDs for individual cells are displayed in the table below:

Partial Autocorrelation Function
Time lag kPACF(k)T-STATP-value
10.1348681.05340.148167
2-0.253183-1.97740.026259
30.0513990.40140.344751
40.1792421.39990.083301
50.1406331.09840.138178
60.2718562.12330.018899
70.1344911.05040.148838
80.2529031.97520.026385
9-0.200811-1.56840.060983
10-0.378002-2.95230.002236
11-0.137616-1.07480.143345
120.4737473.70010.000232
13-0.089353-0.69790.243955
140.0727080.56790.286104
15-0.09552-0.7460.229255
16-0.014972-0.11690.453649
17-0.008653-0.06760.473169


Parameters (Session):
par1 = Default ; par2 = 1 ; par3 = 0 ; par4 = 0 ; par5 = 12 ;
Parameters (R input):
par1 = Default ; par2 = 1 ; par3 = 0 ; par4 = 0 ; par5 = 12 ;
R code (references can be found in the software module):
if (par1 == 'Default') {
par1 = 10*log10(length(x))
} else {
par1 <- as.numeric(par1)
}
par2 <- as.numeric(par2)
par3 <- as.numeric(par3)
par4 <- as.numeric(par4)
par5 <- as.numeric(par5)
if (par2 == 0) {
x <- log(x)
} else {
x <- (x ^ par2 - 1) / par2
}
if (par3 > 0) x <- diff(x,lag=1,difference=par3)
if (par4 > 0) x <- diff(x,lag=par5,difference=par4)
bitmap(file='pic1.png')
racf <- acf(x,par1,main='Autocorrelation',xlab='lags',ylab='ACF')
dev.off()
bitmap(file='pic2.png')
rpacf <- pacf(x,par1,main='Partial Autocorrelation',xlab='lags',ylab='PACF')
dev.off()
(myacf <- c(racf$acf))
(mypacf <- c(rpacf$acf))
lengthx <- length(x)
sqrtn <- sqrt(lengthx)
load(file='createtable')
a<-table.start()
a<-table.row.start(a)
a<-table.element(a,'Autocorrelation Function',4,TRUE)
a<-table.row.end(a)
a<-table.row.start(a)
a<-table.element(a,'Time lag k',header=TRUE)
a<-table.element(a,hyperlink('basics.htm','ACF(k)','click here for more information about the Autocorrelation Function'),header=TRUE)
a<-table.element(a,'T-STAT',header=TRUE)
a<-table.element(a,'P-value',header=TRUE)
a<-table.row.end(a)
for (i in 2:(par1+1)) {
a<-table.row.start(a)
a<-table.element(a,i-1,header=TRUE)
a<-table.element(a,round(myacf[i],6))
mytstat <- myacf[i]*sqrtn
a<-table.element(a,round(mytstat,4))
a<-table.element(a,round(1-pt(abs(mytstat),lengthx),6))
a<-table.row.end(a)
}
a<-table.end(a)
table.save(a,file='mytable.tab')
a<-table.start()
a<-table.row.start(a)
a<-table.element(a,'Partial Autocorrelation Function',4,TRUE)
a<-table.row.end(a)
a<-table.row.start(a)
a<-table.element(a,'Time lag k',header=TRUE)
a<-table.element(a,hyperlink('basics.htm','PACF(k)','click here for more information about the Partial Autocorrelation Function'),header=TRUE)
a<-table.element(a,'T-STAT',header=TRUE)
a<-table.element(a,'P-value',header=TRUE)
a<-table.row.end(a)
for (i in 1:par1) {
a<-table.row.start(a)
a<-table.element(a,i,header=TRUE)
a<-table.element(a,round(mypacf[i],6))
mytstat <- mypacf[i]*sqrtn
a<-table.element(a,round(mytstat,4))
a<-table.element(a,round(1-pt(abs(mytstat),lengthx),6))
a<-table.row.end(a)
}
a<-table.end(a)
table.save(a,file='mytable1.tab')