Free Statistics

of Irreproducible Research!

Author's title

Author*The author of this computation has been verified*
R Software Modulerwasp_tukeylambda.wasp
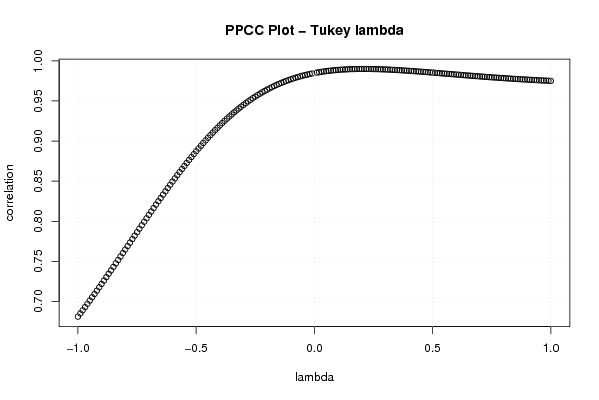
Title produced by softwareTukey lambda PPCC Plot
Date of computationMon, 27 Oct 2008 13:03:07 -0600
Cite this page as followsStatistical Computations at FreeStatistics.org, Office for Research Development and Education, URL https://freestatistics.org/blog/index.php?v=date/2008/Oct/27/t12251342806j48k3wu7jojsbj.htm/, Retrieved Sun, 19 May 2024 03:09:21 +0000
Statistical Computations at FreeStatistics.org, Office for Research Development and Education, URL https://freestatistics.org/blog/index.php?pk=19416, Retrieved Sun, 19 May 2024 03:09:21 +0000
QR Codes:

Original text written by user:
IsPrivate?No (this computation is public)
User-defined keywords
Estimated Impact143
Family? (F = Feedback message, R = changed R code, M = changed R Module, P = changed Parameters, D = changed Data)
F     [Tukey lambda PPCC Plot] [Investigating Dis...] [2007-10-21 16:01:20] [b9964c45117f7aac638ab9056d451faa]
F    D    [Tukey lambda PPCC Plot] [Investigating Dis...] [2008-10-27 19:03:07] [e08fee3874f3333d6b7a377a061b860d] [Current]
Feedback Forum
2008-10-29 14:48:49 [Siem Van Opstal] [reply
Juist antwoord
2008-11-02 10:43:21 [Kevin Neelen] [reply
  2008-11-02 10:43:58 [Kevin Neelen] [reply
Ik heeb hier gebruikt gemaakt van de juiste methode om deze vraag te kunnen oplossen, namelijk het Tukey lambda PPCC Plot. Hier kan men zien dat de hoogste correlatiewaarde zich inderdaad rond een Lambda-waarde van 0,14 bevindt, wat op een normaalverdeling van de gegevens wijst.
2008-11-02 12:50:24 [Michaël De Kuyer] [reply
De analyse is inderdaad correct.

Een toch wel belangrijke opmerking: ik moet het werk van Michael Van Spaendonk beoordelen en kom terecht bij Kevin Neelen. In het college is meermaals gezegd geweest dat je mag samenwerken, maar de computations zelf moet doen.
2008-11-02 13:41:49 [Stijn Van de Velde] [reply
Deze uitleg en analyse is perfect, hier valt niets aan toe te voegen.
2008-11-02 16:41:36 [Evelyn Ongena] [reply
Er is een juiste conclusie getrokken, deze reproductie is echter niet echt noodzakelijk, aangezien de gegevens dezelfde blijven en dus steeds hetzelfde resultaat zal bekomen worden,maar het is uiteraard niet foutief.
2008-11-02 19:02:20 [Yara Van Overstraeten] [reply
Hier is inderdaad een zeer uitgebreide en juiste analyse gemaakt.
2008-11-04 08:25:10 [Michael Van Spaandonck] [reply
Naar mijn mening is de juiste methode gebruikt. De maximale correlatiewaarde ligt bij een Lambda-waarde van 0,14, wat wijst op een normaalverdeling van de gegevens.

Post a new message
Dataseries X:
110.40
96.40
101.90
106.20
81.00
94.70
101.00
109.40
102.30
90.70
96.20
96.10
106.00
103.10
102.00
104.70
86.00
92.10
106.90
112.60
101.70
92.00
97.40
97.00
105.40
102.70
98.10
104.50
87.40
89.90
109.80
111.70
98.60
96.90
95.10
97.00
112.70
102.90
97.40
111.40
87.40
96.80
114.10
110.30
103.90
101.60
94.60
95.90
104.70
102.80
98.10
113.90
80.90
95.70
113.20
105.90
108.80
102.30
99.00
100.70
115.50


Summary of computational transaction
Raw Inputview raw input (R code)
Raw Outputview raw output of R engine
Computing time2 seconds
R Server'Sir Ronald Aylmer Fisher' @ 193.190.124.24

\begin{tabular}{lllllllll}
\hline
Summary of computational transaction \tabularnewline
Raw Input & view raw input (R code)  \tabularnewline
Raw Output & view raw output of R engine  \tabularnewline
Computing time & 2 seconds \tabularnewline
R Server & 'Sir Ronald Aylmer Fisher' @ 193.190.124.24 \tabularnewline
\hline
\end{tabular}
%Source: https://freestatistics.org/blog/index.php?pk=19416&T=0

[TABLE]
[ROW][C]Summary of computational transaction[/C][/ROW]
[ROW][C]Raw Input[/C][C]view raw input (R code) [/C][/ROW]
[ROW][C]Raw Output[/C][C]view raw output of R engine [/C][/ROW]
[ROW][C]Computing time[/C][C]2 seconds[/C][/ROW]
[ROW][C]R Server[/C][C]'Sir Ronald Aylmer Fisher' @ 193.190.124.24[/C][/ROW]
[/TABLE]
Source: https://freestatistics.org/blog/index.php?pk=19416&T=0

Globally Unique Identifier (entire table): ba.freestatistics.org/blog/index.php?pk=19416&T=0

As an alternative you can also use a QR Code:  

The GUIDs for individual cells are displayed in the table below:

Summary of computational transaction
Raw Inputview raw input (R code)
Raw Outputview raw output of R engine
Computing time2 seconds
R Server'Sir Ronald Aylmer Fisher' @ 193.190.124.24


Tukey Lambda - Key Values
Distribution (lambda)Correlation
Approx. Cauchy (lambda=-1)0.681034394717584
Exact Logistic (lambda=0)0.984820721672163
Approx. Normal (lambda=0.14)0.989505916159088
U-shaped (lambda=0.5)0.985385537255734
Exactly Uniform (lambda=1)0.97511352322751

\begin{tabular}{lllllllll}
\hline
Tukey Lambda - Key Values \tabularnewline
Distribution (lambda) & Correlation \tabularnewline
Approx. Cauchy (lambda=-1) & 0.681034394717584 \tabularnewline
Exact Logistic (lambda=0) & 0.984820721672163 \tabularnewline
Approx. Normal (lambda=0.14) & 0.989505916159088 \tabularnewline
U-shaped (lambda=0.5) & 0.985385537255734 \tabularnewline
Exactly Uniform (lambda=1) & 0.97511352322751 \tabularnewline
\hline
\end{tabular}
%Source: https://freestatistics.org/blog/index.php?pk=19416&T=1

[TABLE]
[ROW][C]Tukey Lambda - Key Values[/C][/ROW]
[ROW][C]Distribution (lambda)[/C][C]Correlation[/C][/ROW]
[ROW][C]Approx. Cauchy (lambda=-1)[/C][C]0.681034394717584[/C][/ROW]
[ROW][C]Exact Logistic (lambda=0)[/C][C]0.984820721672163[/C][/ROW]
[ROW][C]Approx. Normal (lambda=0.14)[/C][C]0.989505916159088[/C][/ROW]
[ROW][C]U-shaped (lambda=0.5)[/C][C]0.985385537255734[/C][/ROW]
[ROW][C]Exactly Uniform (lambda=1)[/C][C]0.97511352322751[/C][/ROW]
[/TABLE]
Source: https://freestatistics.org/blog/index.php?pk=19416&T=1

Globally Unique Identifier (entire table): ba.freestatistics.org/blog/index.php?pk=19416&T=1

As an alternative you can also use a QR Code:  

The GUIDs for individual cells are displayed in the table below:

Tukey Lambda - Key Values
Distribution (lambda)Correlation
Approx. Cauchy (lambda=-1)0.681034394717584
Exact Logistic (lambda=0)0.984820721672163
Approx. Normal (lambda=0.14)0.989505916159088
U-shaped (lambda=0.5)0.985385537255734
Exactly Uniform (lambda=1)0.97511352322751


Parameters (Session):
Parameters (R input):
R code (references can be found in the software module):
gp <- function(lambda, p)
{
(p^lambda-(1-p)^lambda)/lambda
}
sortx <- sort(x)
c <- array(NA,dim=c(201))
for (i in 1:201)
{
if (i != 101) c[i] <- cor(gp(ppoints(x), lambda=(i-101)/100),sortx)
}
bitmap(file='test1.png')
plot((-100:100)/100,c[1:201],xlab='lambda',ylab='correlation',main='PPCC Plot - Tukey lambda')
grid()
dev.off()
load(file='createtable')
a<-table.start()
a<-table.row.start(a)
a<-table.element(a,'Tukey Lambda - Key Values',2,TRUE)
a<-table.row.end(a)
a<-table.row.start(a)
a<-table.element(a,'Distribution (lambda)',1,TRUE)
a<-table.element(a,'Correlation',1,TRUE)
a<-table.row.end(a)
a<-table.row.start(a)
a<-table.element(a,'Approx. Cauchy (lambda=-1)',header=TRUE)
a<-table.element(a,c[1])
a<-table.row.end(a)
a<-table.row.start(a)
a<-table.element(a,'Exact Logistic (lambda=0)',header=TRUE)
a<-table.element(a,(c[100]+c[102])/2)
a<-table.row.end(a)
a<-table.row.start(a)
a<-table.element(a,'Approx. Normal (lambda=0.14)',header=TRUE)
a<-table.element(a,c[115])
a<-table.row.end(a)
a<-table.row.start(a)
a<-table.element(a,'U-shaped (lambda=0.5)',header=TRUE)
a<-table.element(a,c[151])
a<-table.row.end(a)
a<-table.row.start(a)
a<-table.element(a,'Exactly Uniform (lambda=1)',header=TRUE)
a<-table.element(a,c[201])
a<-table.row.end(a)
a<-table.end(a)
table.save(a,file='mytable.tab')