Free Statistics
of Irreproducible Research!
Description of Statistical Computation | |
|---|---|
| Author's title | |
| Author | *The author of this computation has been verified* |
| R Software Module | Rscript (source code is shown below) |
| Title produced by software | R console |
| Date of computation | Wed, 03 Sep 2008 08:34:30 -0600 |
| Cite this page as follows | Statistical Computations at FreeStatistics.org, Office for Research Development and Education, URL https://freestatistics.org/blog/index.php?v=date/2008/Sep/03/t1220452471zxshmmb34rhc015.htm/, Retrieved Fri, 17 May 2024 04:18:01 +0000 |
| Statistical Computations at FreeStatistics.org, Office for Research Development and Education, URL https://freestatistics.org/blog/index.php?pk=14319, Retrieved Fri, 17 May 2024 04:18:01 +0000 | |
| QR Codes: | |
|
| |
| Original text written by user: | no comments |
| IsPrivate? | No (this computation is public) |
| User-defined keywords | key1,key2 |
| Estimated Impact | 292 |
Tree of Dependent Computations | |
| Family? (F = Feedback message, R = changed R code, M = changed R Module, P = changed Parameters, D = changed Data) | |
| - [R console] [test w/o bloguid] [2008-09-03 14:34:30] [9871d3a2c554b27151cacf1422eec048] [Current] | |
| Feedback Forum | |
Post a new message | |
Dataset | |
| Dataseries X: | |
1.41892750226651 1.54543899298254 0.591624558991754 -1.74576422473763 0.229262257412654 -1.18834585046649 -2.40608162453887 1.62183867079856 -0.898719642319671 -0.59449330616851 0.902594572500901 -1.10005879321768 0.904571079229874 0.181860311443919 0.145658948951022 -0.552528180976819 -1.30713752759707 -1.15442126459426 -0.297078359209658 1.64015480032560 -1.10149294212978 1.08762157232616 0.843034571091406 1.23401928759431 0.253790772373287 0.936141133623252 1.30958442895381 -0.492192206234964 1.13845077307884 0.00274856143693057 -0.830056285519378 -1.32422846413979 0.649348259684217 -0.277313977290764 -0.75361294861034 -0.181746997517083 -1.11038188735262 0.380892153944836 0.863468552933662 -0.839829950982667 -0.0364219076209935 1.06238849744143 0.0651748507087307 -1.58796242789370 -0.629473540679446 0.280847384011108 1.13891833350592 0.402823405703386 0.535077552237269 -0.379230528056363 -0.0337572775633225 -0.157395527692957 0.274592348459720 -1.98090598404544 1.25705070426557 -0.00695471109278643 0.313393498984273 -1.0528659254986 -0.668398239839138 -0.88973314527057 -0.981091500531926 0.125061367131308 -0.159440301742771 -0.744212634164514 0.270920919007712 -0.794645048325264 -0.0433623339222747 -0.644489012325216 -1.53109529827836 -1.49752665045227 0.307529336926964 1.23529399093031 -0.626537654854447 1.20643050180716 -0.0704048336189183 -0.377411216501518 0.8066180738924 -1.63373574784827 -1.29160968142465 -0.633194762857642 -1.20635627806320 -0.399554488609473 -1.88336045827445 1.90001333734246 -1.08880428892806 -0.816769722259723 0.442165938405878 1.51802443338371 -0.304102327616476 0.50768499386623 -1.17325163543747 0.295223545985601 2.36243036169810 -0.46913596631342 0.389775627629069 -0.123957264563073 -0.200625076881924 -1.55210636856672 -1.06787822122857 0.537321686442488 | |
Tables (Output of Computation) | |
> first_number = 5
> second_number = 7
> strpar = 'hello'
> {
+ myfun <- function(x, y) {
+ x + y
+ }
+
+ print(myfun(first_number, second_number))
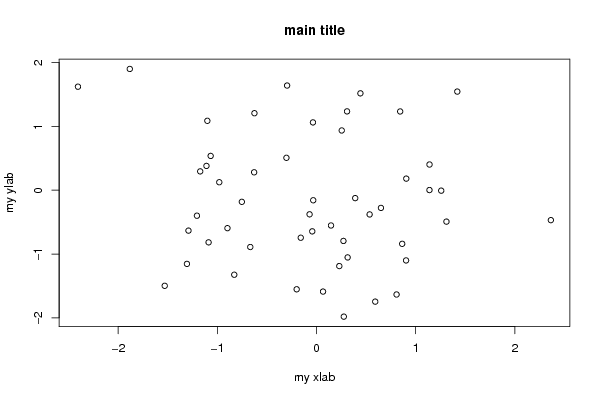
+ plot(RCx, main = 'main ti ...' ... [TRUNCATED]
[1] 12
| |
Figures (Output of Computation) | |
Input Parameters & R Code | |
| Parameters (Session): | |
| par1 = 5 ; par2 = 7 ; par3 = hello ; | |
| Parameters (R input): | |
| R code (body of R function): | |
{ | |