Free Statistics

of Irreproducible Research!

Author's title

Author*The author of this computation has been verified*
R Software Modulerwasp_autocorrelation.wasp
Title produced by software(Partial) Autocorrelation Function
Date of computationMon, 21 Dec 2009 06:57:27 -0700
Cite this page as followsStatistical Computations at FreeStatistics.org, Office for Research Development and Education, URL https://freestatistics.org/blog/index.php?v=date/2009/Dec/21/t1261403916kc2d00tz079qssc.htm/, Retrieved Wed, 22 May 2024 17:09:31 +0000
Statistical Computations at FreeStatistics.org, Office for Research Development and Education, URL https://freestatistics.org/blog/index.php?pk=70166, Retrieved Wed, 22 May 2024 17:09:31 +0000
QR Codes:

Original text written by user:
IsPrivate?No (this computation is public)
User-defined keywords
Estimated Impact117
Family? (F = Feedback message, R = changed R code, M = changed R Module, P = changed Parameters, D = changed Data)
-     [Univariate Explorative Data Analysis] [Run Sequence gebo...] [2008-12-12 13:32:37] [76963dc1903f0f612b6153510a3818cf]
- R  D  [Univariate Explorative Data Analysis] [Run Sequence gebo...] [2008-12-17 12:14:40] [76963dc1903f0f612b6153510a3818cf]
-         [Univariate Explorative Data Analysis] [Run Sequence Plot...] [2008-12-22 18:19:51] [1ce0d16c8f4225c977b42c8fa93bc163]
- RMP       [(Partial) Autocorrelation Function] [Identifying Integ...] [2009-11-22 12:19:56] [b98453cac15ba1066b407e146608df68]
-   PD          [(Partial) Autocorrelation Function] [Autocorrelation f...] [2009-12-21 13:57:27] [0744dbfa8cdb263e2e292d0a5ee9dc89] [Current]
Feedback Forum

Post a new message
Dataseries X:
114.1
110.3
103.9
101.6
94.6
95.9
104.7
102.8
98.1
113.9
80.9
95.7
113.2
105.9
108.8
102.3
99
100.7
115.5
100.7
109.9
114.6
85.4
100.5
114.8
116.5
112.9
102
106
105.3
118.8
106.1
109.3
117.2
92.5
104.2
112.5
122.4
113.3
100
110.7
112.8
109.8
117.3
109.1
115.9
96
99.8
116.8
115.7
99.4
94.3
91
93.2
103.1
94.1
91.8
102.7
82.6
89.1
104.5


Summary of computational transaction
Raw Inputview raw input (R code)
Raw Outputview raw output of R engine
Computing time1 seconds
R Server'Gwilym Jenkins' @ 72.249.127.135

\begin{tabular}{lllllllll}
\hline
Summary of computational transaction \tabularnewline
Raw Input & view raw input (R code)  \tabularnewline
Raw Output & view raw output of R engine  \tabularnewline
Computing time & 1 seconds \tabularnewline
R Server & 'Gwilym Jenkins' @ 72.249.127.135 \tabularnewline
\hline
\end{tabular}
%Source: https://freestatistics.org/blog/index.php?pk=70166&T=0

[TABLE]
[ROW][C]Summary of computational transaction[/C][/ROW]
[ROW][C]Raw Input[/C][C]view raw input (R code) [/C][/ROW]
[ROW][C]Raw Output[/C][C]view raw output of R engine [/C][/ROW]
[ROW][C]Computing time[/C][C]1 seconds[/C][/ROW]
[ROW][C]R Server[/C][C]'Gwilym Jenkins' @ 72.249.127.135[/C][/ROW]
[/TABLE]
Source: https://freestatistics.org/blog/index.php?pk=70166&T=0

Globally Unique Identifier (entire table): ba.freestatistics.org/blog/index.php?pk=70166&T=0

As an alternative you can also use a QR Code:  

The GUIDs for individual cells are displayed in the table below:

Summary of computational transaction
Raw Inputview raw input (R code)
Raw Outputview raw output of R engine
Computing time1 seconds
R Server'Gwilym Jenkins' @ 72.249.127.135


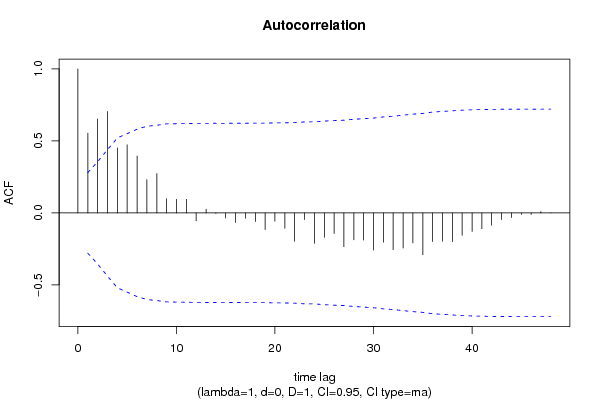
Autocorrelation Function
Time lag kACF(k)T-STATP-value
10.5536523.87560.000158
20.6523474.56641.7e-05
30.7049844.93495e-06
40.4511343.15790.00136
50.4728423.30990.000878
60.3952.7650.004001
70.2305831.61410.056466
80.2734561.91420.030723
90.0987310.69110.246377
100.0946260.66240.255415
110.0943850.66070.25595
12-0.054996-0.3850.350962
130.0254860.17840.429572
14-0.003505-0.02450.490263
15-0.036148-0.2530.400651
16-0.067196-0.47040.320087
17-0.037242-0.26070.39771
18-0.060405-0.42280.337132
19-0.116011-0.81210.210337
20-0.057267-0.40090.345129
21-0.106853-0.7480.229025
22-0.196229-1.37360.087909
23-0.046697-0.32690.372575
24-0.211323-1.47930.072735
25-0.169625-1.18740.120401
26-0.14313-1.00190.160654
27-0.234746-1.64320.05337
28-0.186702-1.30690.098671
29-0.18871-1.3210.096324
30-0.257934-1.80550.038568
31-0.203882-1.42720.079936
32-0.255736-1.79020.039804
33-0.244603-1.71220.046589
34-0.208977-1.46280.074948
35-0.290897-2.03630.023573
36-0.19897-1.39280.084986
37-0.196661-1.37660.087443
38-0.200365-1.40260.083527
39-0.155655-1.08960.140612
40-0.128833-0.90180.185779
41-0.109559-0.76690.223407
42-0.085784-0.60050.275475
43-0.046545-0.32580.372975
44-0.032826-0.22980.409608
45-0.011349-0.07940.468502
46-0.010833-0.07580.469931
470.009670.06770.473155
48-0.000697-0.00490.498064
49NANANA
50NANANA
51NANANA
52NANANA
53NANANA
54NANANA
55NANANA
56NANANA
57NANANA
58NANANA
59NANANA
60NANANA

\begin{tabular}{lllllllll}
\hline
Autocorrelation Function \tabularnewline
Time lag k & ACF(k) & T-STAT & P-value \tabularnewline
1 & 0.553652 & 3.8756 & 0.000158 \tabularnewline
2 & 0.652347 & 4.5664 & 1.7e-05 \tabularnewline
3 & 0.704984 & 4.9349 & 5e-06 \tabularnewline
4 & 0.451134 & 3.1579 & 0.00136 \tabularnewline
5 & 0.472842 & 3.3099 & 0.000878 \tabularnewline
6 & 0.395 & 2.765 & 0.004001 \tabularnewline
7 & 0.230583 & 1.6141 & 0.056466 \tabularnewline
8 & 0.273456 & 1.9142 & 0.030723 \tabularnewline
9 & 0.098731 & 0.6911 & 0.246377 \tabularnewline
10 & 0.094626 & 0.6624 & 0.255415 \tabularnewline
11 & 0.094385 & 0.6607 & 0.25595 \tabularnewline
12 & -0.054996 & -0.385 & 0.350962 \tabularnewline
13 & 0.025486 & 0.1784 & 0.429572 \tabularnewline
14 & -0.003505 & -0.0245 & 0.490263 \tabularnewline
15 & -0.036148 & -0.253 & 0.400651 \tabularnewline
16 & -0.067196 & -0.4704 & 0.320087 \tabularnewline
17 & -0.037242 & -0.2607 & 0.39771 \tabularnewline
18 & -0.060405 & -0.4228 & 0.337132 \tabularnewline
19 & -0.116011 & -0.8121 & 0.210337 \tabularnewline
20 & -0.057267 & -0.4009 & 0.345129 \tabularnewline
21 & -0.106853 & -0.748 & 0.229025 \tabularnewline
22 & -0.196229 & -1.3736 & 0.087909 \tabularnewline
23 & -0.046697 & -0.3269 & 0.372575 \tabularnewline
24 & -0.211323 & -1.4793 & 0.072735 \tabularnewline
25 & -0.169625 & -1.1874 & 0.120401 \tabularnewline
26 & -0.14313 & -1.0019 & 0.160654 \tabularnewline
27 & -0.234746 & -1.6432 & 0.05337 \tabularnewline
28 & -0.186702 & -1.3069 & 0.098671 \tabularnewline
29 & -0.18871 & -1.321 & 0.096324 \tabularnewline
30 & -0.257934 & -1.8055 & 0.038568 \tabularnewline
31 & -0.203882 & -1.4272 & 0.079936 \tabularnewline
32 & -0.255736 & -1.7902 & 0.039804 \tabularnewline
33 & -0.244603 & -1.7122 & 0.046589 \tabularnewline
34 & -0.208977 & -1.4628 & 0.074948 \tabularnewline
35 & -0.290897 & -2.0363 & 0.023573 \tabularnewline
36 & -0.19897 & -1.3928 & 0.084986 \tabularnewline
37 & -0.196661 & -1.3766 & 0.087443 \tabularnewline
38 & -0.200365 & -1.4026 & 0.083527 \tabularnewline
39 & -0.155655 & -1.0896 & 0.140612 \tabularnewline
40 & -0.128833 & -0.9018 & 0.185779 \tabularnewline
41 & -0.109559 & -0.7669 & 0.223407 \tabularnewline
42 & -0.085784 & -0.6005 & 0.275475 \tabularnewline
43 & -0.046545 & -0.3258 & 0.372975 \tabularnewline
44 & -0.032826 & -0.2298 & 0.409608 \tabularnewline
45 & -0.011349 & -0.0794 & 0.468502 \tabularnewline
46 & -0.010833 & -0.0758 & 0.469931 \tabularnewline
47 & 0.00967 & 0.0677 & 0.473155 \tabularnewline
48 & -0.000697 & -0.0049 & 0.498064 \tabularnewline
49 & NA & NA & NA \tabularnewline
50 & NA & NA & NA \tabularnewline
51 & NA & NA & NA \tabularnewline
52 & NA & NA & NA \tabularnewline
53 & NA & NA & NA \tabularnewline
54 & NA & NA & NA \tabularnewline
55 & NA & NA & NA \tabularnewline
56 & NA & NA & NA \tabularnewline
57 & NA & NA & NA \tabularnewline
58 & NA & NA & NA \tabularnewline
59 & NA & NA & NA \tabularnewline
60 & NA & NA & NA \tabularnewline
\hline
\end{tabular}
%Source: https://freestatistics.org/blog/index.php?pk=70166&T=1

[TABLE]
[ROW][C]Autocorrelation Function[/C][/ROW]
[ROW][C]Time lag k[/C][C]ACF(k)[/C][C]T-STAT[/C][C]P-value[/C][/ROW]
[ROW][C]1[/C][C]0.553652[/C][C]3.8756[/C][C]0.000158[/C][/ROW]
[ROW][C]2[/C][C]0.652347[/C][C]4.5664[/C][C]1.7e-05[/C][/ROW]
[ROW][C]3[/C][C]0.704984[/C][C]4.9349[/C][C]5e-06[/C][/ROW]
[ROW][C]4[/C][C]0.451134[/C][C]3.1579[/C][C]0.00136[/C][/ROW]
[ROW][C]5[/C][C]0.472842[/C][C]3.3099[/C][C]0.000878[/C][/ROW]
[ROW][C]6[/C][C]0.395[/C][C]2.765[/C][C]0.004001[/C][/ROW]
[ROW][C]7[/C][C]0.230583[/C][C]1.6141[/C][C]0.056466[/C][/ROW]
[ROW][C]8[/C][C]0.273456[/C][C]1.9142[/C][C]0.030723[/C][/ROW]
[ROW][C]9[/C][C]0.098731[/C][C]0.6911[/C][C]0.246377[/C][/ROW]
[ROW][C]10[/C][C]0.094626[/C][C]0.6624[/C][C]0.255415[/C][/ROW]
[ROW][C]11[/C][C]0.094385[/C][C]0.6607[/C][C]0.25595[/C][/ROW]
[ROW][C]12[/C][C]-0.054996[/C][C]-0.385[/C][C]0.350962[/C][/ROW]
[ROW][C]13[/C][C]0.025486[/C][C]0.1784[/C][C]0.429572[/C][/ROW]
[ROW][C]14[/C][C]-0.003505[/C][C]-0.0245[/C][C]0.490263[/C][/ROW]
[ROW][C]15[/C][C]-0.036148[/C][C]-0.253[/C][C]0.400651[/C][/ROW]
[ROW][C]16[/C][C]-0.067196[/C][C]-0.4704[/C][C]0.320087[/C][/ROW]
[ROW][C]17[/C][C]-0.037242[/C][C]-0.2607[/C][C]0.39771[/C][/ROW]
[ROW][C]18[/C][C]-0.060405[/C][C]-0.4228[/C][C]0.337132[/C][/ROW]
[ROW][C]19[/C][C]-0.116011[/C][C]-0.8121[/C][C]0.210337[/C][/ROW]
[ROW][C]20[/C][C]-0.057267[/C][C]-0.4009[/C][C]0.345129[/C][/ROW]
[ROW][C]21[/C][C]-0.106853[/C][C]-0.748[/C][C]0.229025[/C][/ROW]
[ROW][C]22[/C][C]-0.196229[/C][C]-1.3736[/C][C]0.087909[/C][/ROW]
[ROW][C]23[/C][C]-0.046697[/C][C]-0.3269[/C][C]0.372575[/C][/ROW]
[ROW][C]24[/C][C]-0.211323[/C][C]-1.4793[/C][C]0.072735[/C][/ROW]
[ROW][C]25[/C][C]-0.169625[/C][C]-1.1874[/C][C]0.120401[/C][/ROW]
[ROW][C]26[/C][C]-0.14313[/C][C]-1.0019[/C][C]0.160654[/C][/ROW]
[ROW][C]27[/C][C]-0.234746[/C][C]-1.6432[/C][C]0.05337[/C][/ROW]
[ROW][C]28[/C][C]-0.186702[/C][C]-1.3069[/C][C]0.098671[/C][/ROW]
[ROW][C]29[/C][C]-0.18871[/C][C]-1.321[/C][C]0.096324[/C][/ROW]
[ROW][C]30[/C][C]-0.257934[/C][C]-1.8055[/C][C]0.038568[/C][/ROW]
[ROW][C]31[/C][C]-0.203882[/C][C]-1.4272[/C][C]0.079936[/C][/ROW]
[ROW][C]32[/C][C]-0.255736[/C][C]-1.7902[/C][C]0.039804[/C][/ROW]
[ROW][C]33[/C][C]-0.244603[/C][C]-1.7122[/C][C]0.046589[/C][/ROW]
[ROW][C]34[/C][C]-0.208977[/C][C]-1.4628[/C][C]0.074948[/C][/ROW]
[ROW][C]35[/C][C]-0.290897[/C][C]-2.0363[/C][C]0.023573[/C][/ROW]
[ROW][C]36[/C][C]-0.19897[/C][C]-1.3928[/C][C]0.084986[/C][/ROW]
[ROW][C]37[/C][C]-0.196661[/C][C]-1.3766[/C][C]0.087443[/C][/ROW]
[ROW][C]38[/C][C]-0.200365[/C][C]-1.4026[/C][C]0.083527[/C][/ROW]
[ROW][C]39[/C][C]-0.155655[/C][C]-1.0896[/C][C]0.140612[/C][/ROW]
[ROW][C]40[/C][C]-0.128833[/C][C]-0.9018[/C][C]0.185779[/C][/ROW]
[ROW][C]41[/C][C]-0.109559[/C][C]-0.7669[/C][C]0.223407[/C][/ROW]
[ROW][C]42[/C][C]-0.085784[/C][C]-0.6005[/C][C]0.275475[/C][/ROW]
[ROW][C]43[/C][C]-0.046545[/C][C]-0.3258[/C][C]0.372975[/C][/ROW]
[ROW][C]44[/C][C]-0.032826[/C][C]-0.2298[/C][C]0.409608[/C][/ROW]
[ROW][C]45[/C][C]-0.011349[/C][C]-0.0794[/C][C]0.468502[/C][/ROW]
[ROW][C]46[/C][C]-0.010833[/C][C]-0.0758[/C][C]0.469931[/C][/ROW]
[ROW][C]47[/C][C]0.00967[/C][C]0.0677[/C][C]0.473155[/C][/ROW]
[ROW][C]48[/C][C]-0.000697[/C][C]-0.0049[/C][C]0.498064[/C][/ROW]
[ROW][C]49[/C][C]NA[/C][C]NA[/C][C]NA[/C][/ROW]
[ROW][C]50[/C][C]NA[/C][C]NA[/C][C]NA[/C][/ROW]
[ROW][C]51[/C][C]NA[/C][C]NA[/C][C]NA[/C][/ROW]
[ROW][C]52[/C][C]NA[/C][C]NA[/C][C]NA[/C][/ROW]
[ROW][C]53[/C][C]NA[/C][C]NA[/C][C]NA[/C][/ROW]
[ROW][C]54[/C][C]NA[/C][C]NA[/C][C]NA[/C][/ROW]
[ROW][C]55[/C][C]NA[/C][C]NA[/C][C]NA[/C][/ROW]
[ROW][C]56[/C][C]NA[/C][C]NA[/C][C]NA[/C][/ROW]
[ROW][C]57[/C][C]NA[/C][C]NA[/C][C]NA[/C][/ROW]
[ROW][C]58[/C][C]NA[/C][C]NA[/C][C]NA[/C][/ROW]
[ROW][C]59[/C][C]NA[/C][C]NA[/C][C]NA[/C][/ROW]
[ROW][C]60[/C][C]NA[/C][C]NA[/C][C]NA[/C][/ROW]
[/TABLE]
Source: https://freestatistics.org/blog/index.php?pk=70166&T=1

Globally Unique Identifier (entire table): ba.freestatistics.org/blog/index.php?pk=70166&T=1

As an alternative you can also use a QR Code:  

The GUIDs for individual cells are displayed in the table below:

Autocorrelation Function
Time lag kACF(k)T-STATP-value
10.5536523.87560.000158
20.6523474.56641.7e-05
30.7049844.93495e-06
40.4511343.15790.00136
50.4728423.30990.000878
60.3952.7650.004001
70.2305831.61410.056466
80.2734561.91420.030723
90.0987310.69110.246377
100.0946260.66240.255415
110.0943850.66070.25595
12-0.054996-0.3850.350962
130.0254860.17840.429572
14-0.003505-0.02450.490263
15-0.036148-0.2530.400651
16-0.067196-0.47040.320087
17-0.037242-0.26070.39771
18-0.060405-0.42280.337132
19-0.116011-0.81210.210337
20-0.057267-0.40090.345129
21-0.106853-0.7480.229025
22-0.196229-1.37360.087909
23-0.046697-0.32690.372575
24-0.211323-1.47930.072735
25-0.169625-1.18740.120401
26-0.14313-1.00190.160654
27-0.234746-1.64320.05337
28-0.186702-1.30690.098671
29-0.18871-1.3210.096324
30-0.257934-1.80550.038568
31-0.203882-1.42720.079936
32-0.255736-1.79020.039804
33-0.244603-1.71220.046589
34-0.208977-1.46280.074948
35-0.290897-2.03630.023573
36-0.19897-1.39280.084986
37-0.196661-1.37660.087443
38-0.200365-1.40260.083527
39-0.155655-1.08960.140612
40-0.128833-0.90180.185779
41-0.109559-0.76690.223407
42-0.085784-0.60050.275475
43-0.046545-0.32580.372975
44-0.032826-0.22980.409608
45-0.011349-0.07940.468502
46-0.010833-0.07580.469931
470.009670.06770.473155
48-0.000697-0.00490.498064
49NANANA
50NANANA
51NANANA
52NANANA
53NANANA
54NANANA
55NANANA
56NANANA
57NANANA
58NANANA
59NANANA
60NANANA


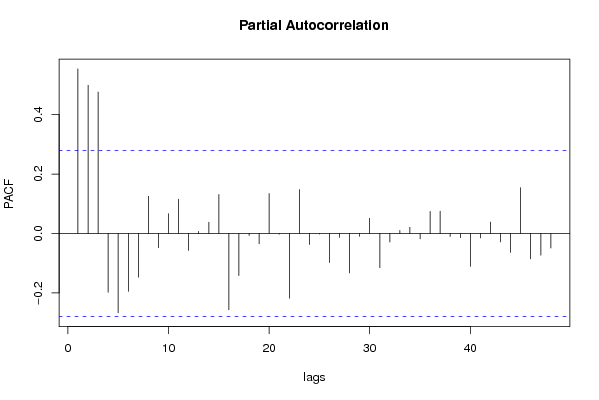
Partial Autocorrelation Function
Time lag kPACF(k)T-STATP-value
10.5536523.87560.000158
20.4986753.49070.000515
30.4756583.32960.000829
4-0.198076-1.38650.085931
5-0.266955-1.86870.033825
6-0.194907-1.36430.089346
7-0.147382-1.03170.153645
80.125260.87680.192432
9-0.047876-0.33510.369479
100.0666420.46650.321466
110.1153180.80720.211719
12-0.057149-0.40.345433
130.0066820.04680.481442
140.0379050.26530.395932
150.1309310.91650.181942
16-0.25703-1.79920.039072
17-0.141842-0.99290.16282
18-0.006539-0.04580.48184
19-0.035004-0.2450.403729
200.1343780.94060.17575
21-0.002258-0.01580.493727
22-0.217688-1.52380.066992
230.1477241.03410.153091
24-0.037258-0.26080.397667
25-0.001855-0.0130.494845
26-0.097803-0.68460.248404
27-0.013347-0.09340.462972
28-0.133022-0.93120.178169
29-0.009529-0.06670.473544
300.0509340.35650.361484
31-0.115286-0.8070.211783
32-0.028823-0.20180.420469
330.0100810.07060.472016
340.0207660.14540.442512
35-0.018068-0.12650.449937
360.0741350.51890.303067
370.0750370.52530.300887
38-0.010101-0.07070.471959
39-0.014103-0.09870.46088
40-0.110771-0.77540.220916
41-0.015306-0.10710.457556
420.0384110.26890.394576
43-0.028429-0.1990.421542
44-0.063913-0.44740.328283
450.1541081.07880.14299
46-0.085203-0.59640.276821
47-0.073104-0.51170.305571
48-0.049358-0.34550.365597
49NANANA
50NANANA
51NANANA
52NANANA
53NANANA
54NANANA
55NANANA
56NANANA
57NANANA
58NANANA
59NANANA
60NANANA

\begin{tabular}{lllllllll}
\hline
Partial Autocorrelation Function \tabularnewline
Time lag k & PACF(k) & T-STAT & P-value \tabularnewline
1 & 0.553652 & 3.8756 & 0.000158 \tabularnewline
2 & 0.498675 & 3.4907 & 0.000515 \tabularnewline
3 & 0.475658 & 3.3296 & 0.000829 \tabularnewline
4 & -0.198076 & -1.3865 & 0.085931 \tabularnewline
5 & -0.266955 & -1.8687 & 0.033825 \tabularnewline
6 & -0.194907 & -1.3643 & 0.089346 \tabularnewline
7 & -0.147382 & -1.0317 & 0.153645 \tabularnewline
8 & 0.12526 & 0.8768 & 0.192432 \tabularnewline
9 & -0.047876 & -0.3351 & 0.369479 \tabularnewline
10 & 0.066642 & 0.4665 & 0.321466 \tabularnewline
11 & 0.115318 & 0.8072 & 0.211719 \tabularnewline
12 & -0.057149 & -0.4 & 0.345433 \tabularnewline
13 & 0.006682 & 0.0468 & 0.481442 \tabularnewline
14 & 0.037905 & 0.2653 & 0.395932 \tabularnewline
15 & 0.130931 & 0.9165 & 0.181942 \tabularnewline
16 & -0.25703 & -1.7992 & 0.039072 \tabularnewline
17 & -0.141842 & -0.9929 & 0.16282 \tabularnewline
18 & -0.006539 & -0.0458 & 0.48184 \tabularnewline
19 & -0.035004 & -0.245 & 0.403729 \tabularnewline
20 & 0.134378 & 0.9406 & 0.17575 \tabularnewline
21 & -0.002258 & -0.0158 & 0.493727 \tabularnewline
22 & -0.217688 & -1.5238 & 0.066992 \tabularnewline
23 & 0.147724 & 1.0341 & 0.153091 \tabularnewline
24 & -0.037258 & -0.2608 & 0.397667 \tabularnewline
25 & -0.001855 & -0.013 & 0.494845 \tabularnewline
26 & -0.097803 & -0.6846 & 0.248404 \tabularnewline
27 & -0.013347 & -0.0934 & 0.462972 \tabularnewline
28 & -0.133022 & -0.9312 & 0.178169 \tabularnewline
29 & -0.009529 & -0.0667 & 0.473544 \tabularnewline
30 & 0.050934 & 0.3565 & 0.361484 \tabularnewline
31 & -0.115286 & -0.807 & 0.211783 \tabularnewline
32 & -0.028823 & -0.2018 & 0.420469 \tabularnewline
33 & 0.010081 & 0.0706 & 0.472016 \tabularnewline
34 & 0.020766 & 0.1454 & 0.442512 \tabularnewline
35 & -0.018068 & -0.1265 & 0.449937 \tabularnewline
36 & 0.074135 & 0.5189 & 0.303067 \tabularnewline
37 & 0.075037 & 0.5253 & 0.300887 \tabularnewline
38 & -0.010101 & -0.0707 & 0.471959 \tabularnewline
39 & -0.014103 & -0.0987 & 0.46088 \tabularnewline
40 & -0.110771 & -0.7754 & 0.220916 \tabularnewline
41 & -0.015306 & -0.1071 & 0.457556 \tabularnewline
42 & 0.038411 & 0.2689 & 0.394576 \tabularnewline
43 & -0.028429 & -0.199 & 0.421542 \tabularnewline
44 & -0.063913 & -0.4474 & 0.328283 \tabularnewline
45 & 0.154108 & 1.0788 & 0.14299 \tabularnewline
46 & -0.085203 & -0.5964 & 0.276821 \tabularnewline
47 & -0.073104 & -0.5117 & 0.305571 \tabularnewline
48 & -0.049358 & -0.3455 & 0.365597 \tabularnewline
49 & NA & NA & NA \tabularnewline
50 & NA & NA & NA \tabularnewline
51 & NA & NA & NA \tabularnewline
52 & NA & NA & NA \tabularnewline
53 & NA & NA & NA \tabularnewline
54 & NA & NA & NA \tabularnewline
55 & NA & NA & NA \tabularnewline
56 & NA & NA & NA \tabularnewline
57 & NA & NA & NA \tabularnewline
58 & NA & NA & NA \tabularnewline
59 & NA & NA & NA \tabularnewline
60 & NA & NA & NA \tabularnewline
\hline
\end{tabular}
%Source: https://freestatistics.org/blog/index.php?pk=70166&T=2

[TABLE]
[ROW][C]Partial Autocorrelation Function[/C][/ROW]
[ROW][C]Time lag k[/C][C]PACF(k)[/C][C]T-STAT[/C][C]P-value[/C][/ROW]
[ROW][C]1[/C][C]0.553652[/C][C]3.8756[/C][C]0.000158[/C][/ROW]
[ROW][C]2[/C][C]0.498675[/C][C]3.4907[/C][C]0.000515[/C][/ROW]
[ROW][C]3[/C][C]0.475658[/C][C]3.3296[/C][C]0.000829[/C][/ROW]
[ROW][C]4[/C][C]-0.198076[/C][C]-1.3865[/C][C]0.085931[/C][/ROW]
[ROW][C]5[/C][C]-0.266955[/C][C]-1.8687[/C][C]0.033825[/C][/ROW]
[ROW][C]6[/C][C]-0.194907[/C][C]-1.3643[/C][C]0.089346[/C][/ROW]
[ROW][C]7[/C][C]-0.147382[/C][C]-1.0317[/C][C]0.153645[/C][/ROW]
[ROW][C]8[/C][C]0.12526[/C][C]0.8768[/C][C]0.192432[/C][/ROW]
[ROW][C]9[/C][C]-0.047876[/C][C]-0.3351[/C][C]0.369479[/C][/ROW]
[ROW][C]10[/C][C]0.066642[/C][C]0.4665[/C][C]0.321466[/C][/ROW]
[ROW][C]11[/C][C]0.115318[/C][C]0.8072[/C][C]0.211719[/C][/ROW]
[ROW][C]12[/C][C]-0.057149[/C][C]-0.4[/C][C]0.345433[/C][/ROW]
[ROW][C]13[/C][C]0.006682[/C][C]0.0468[/C][C]0.481442[/C][/ROW]
[ROW][C]14[/C][C]0.037905[/C][C]0.2653[/C][C]0.395932[/C][/ROW]
[ROW][C]15[/C][C]0.130931[/C][C]0.9165[/C][C]0.181942[/C][/ROW]
[ROW][C]16[/C][C]-0.25703[/C][C]-1.7992[/C][C]0.039072[/C][/ROW]
[ROW][C]17[/C][C]-0.141842[/C][C]-0.9929[/C][C]0.16282[/C][/ROW]
[ROW][C]18[/C][C]-0.006539[/C][C]-0.0458[/C][C]0.48184[/C][/ROW]
[ROW][C]19[/C][C]-0.035004[/C][C]-0.245[/C][C]0.403729[/C][/ROW]
[ROW][C]20[/C][C]0.134378[/C][C]0.9406[/C][C]0.17575[/C][/ROW]
[ROW][C]21[/C][C]-0.002258[/C][C]-0.0158[/C][C]0.493727[/C][/ROW]
[ROW][C]22[/C][C]-0.217688[/C][C]-1.5238[/C][C]0.066992[/C][/ROW]
[ROW][C]23[/C][C]0.147724[/C][C]1.0341[/C][C]0.153091[/C][/ROW]
[ROW][C]24[/C][C]-0.037258[/C][C]-0.2608[/C][C]0.397667[/C][/ROW]
[ROW][C]25[/C][C]-0.001855[/C][C]-0.013[/C][C]0.494845[/C][/ROW]
[ROW][C]26[/C][C]-0.097803[/C][C]-0.6846[/C][C]0.248404[/C][/ROW]
[ROW][C]27[/C][C]-0.013347[/C][C]-0.0934[/C][C]0.462972[/C][/ROW]
[ROW][C]28[/C][C]-0.133022[/C][C]-0.9312[/C][C]0.178169[/C][/ROW]
[ROW][C]29[/C][C]-0.009529[/C][C]-0.0667[/C][C]0.473544[/C][/ROW]
[ROW][C]30[/C][C]0.050934[/C][C]0.3565[/C][C]0.361484[/C][/ROW]
[ROW][C]31[/C][C]-0.115286[/C][C]-0.807[/C][C]0.211783[/C][/ROW]
[ROW][C]32[/C][C]-0.028823[/C][C]-0.2018[/C][C]0.420469[/C][/ROW]
[ROW][C]33[/C][C]0.010081[/C][C]0.0706[/C][C]0.472016[/C][/ROW]
[ROW][C]34[/C][C]0.020766[/C][C]0.1454[/C][C]0.442512[/C][/ROW]
[ROW][C]35[/C][C]-0.018068[/C][C]-0.1265[/C][C]0.449937[/C][/ROW]
[ROW][C]36[/C][C]0.074135[/C][C]0.5189[/C][C]0.303067[/C][/ROW]
[ROW][C]37[/C][C]0.075037[/C][C]0.5253[/C][C]0.300887[/C][/ROW]
[ROW][C]38[/C][C]-0.010101[/C][C]-0.0707[/C][C]0.471959[/C][/ROW]
[ROW][C]39[/C][C]-0.014103[/C][C]-0.0987[/C][C]0.46088[/C][/ROW]
[ROW][C]40[/C][C]-0.110771[/C][C]-0.7754[/C][C]0.220916[/C][/ROW]
[ROW][C]41[/C][C]-0.015306[/C][C]-0.1071[/C][C]0.457556[/C][/ROW]
[ROW][C]42[/C][C]0.038411[/C][C]0.2689[/C][C]0.394576[/C][/ROW]
[ROW][C]43[/C][C]-0.028429[/C][C]-0.199[/C][C]0.421542[/C][/ROW]
[ROW][C]44[/C][C]-0.063913[/C][C]-0.4474[/C][C]0.328283[/C][/ROW]
[ROW][C]45[/C][C]0.154108[/C][C]1.0788[/C][C]0.14299[/C][/ROW]
[ROW][C]46[/C][C]-0.085203[/C][C]-0.5964[/C][C]0.276821[/C][/ROW]
[ROW][C]47[/C][C]-0.073104[/C][C]-0.5117[/C][C]0.305571[/C][/ROW]
[ROW][C]48[/C][C]-0.049358[/C][C]-0.3455[/C][C]0.365597[/C][/ROW]
[ROW][C]49[/C][C]NA[/C][C]NA[/C][C]NA[/C][/ROW]
[ROW][C]50[/C][C]NA[/C][C]NA[/C][C]NA[/C][/ROW]
[ROW][C]51[/C][C]NA[/C][C]NA[/C][C]NA[/C][/ROW]
[ROW][C]52[/C][C]NA[/C][C]NA[/C][C]NA[/C][/ROW]
[ROW][C]53[/C][C]NA[/C][C]NA[/C][C]NA[/C][/ROW]
[ROW][C]54[/C][C]NA[/C][C]NA[/C][C]NA[/C][/ROW]
[ROW][C]55[/C][C]NA[/C][C]NA[/C][C]NA[/C][/ROW]
[ROW][C]56[/C][C]NA[/C][C]NA[/C][C]NA[/C][/ROW]
[ROW][C]57[/C][C]NA[/C][C]NA[/C][C]NA[/C][/ROW]
[ROW][C]58[/C][C]NA[/C][C]NA[/C][C]NA[/C][/ROW]
[ROW][C]59[/C][C]NA[/C][C]NA[/C][C]NA[/C][/ROW]
[ROW][C]60[/C][C]NA[/C][C]NA[/C][C]NA[/C][/ROW]
[/TABLE]
Source: https://freestatistics.org/blog/index.php?pk=70166&T=2

Globally Unique Identifier (entire table): ba.freestatistics.org/blog/index.php?pk=70166&T=2

As an alternative you can also use a QR Code:  

The GUIDs for individual cells are displayed in the table below:

Partial Autocorrelation Function
Time lag kPACF(k)T-STATP-value
10.5536523.87560.000158
20.4986753.49070.000515
30.4756583.32960.000829
4-0.198076-1.38650.085931
5-0.266955-1.86870.033825
6-0.194907-1.36430.089346
7-0.147382-1.03170.153645
80.125260.87680.192432
9-0.047876-0.33510.369479
100.0666420.46650.321466
110.1153180.80720.211719
12-0.057149-0.40.345433
130.0066820.04680.481442
140.0379050.26530.395932
150.1309310.91650.181942
16-0.25703-1.79920.039072
17-0.141842-0.99290.16282
18-0.006539-0.04580.48184
19-0.035004-0.2450.403729
200.1343780.94060.17575
21-0.002258-0.01580.493727
22-0.217688-1.52380.066992
230.1477241.03410.153091
24-0.037258-0.26080.397667
25-0.001855-0.0130.494845
26-0.097803-0.68460.248404
27-0.013347-0.09340.462972
28-0.133022-0.93120.178169
29-0.009529-0.06670.473544
300.0509340.35650.361484
31-0.115286-0.8070.211783
32-0.028823-0.20180.420469
330.0100810.07060.472016
340.0207660.14540.442512
35-0.018068-0.12650.449937
360.0741350.51890.303067
370.0750370.52530.300887
38-0.010101-0.07070.471959
39-0.014103-0.09870.46088
40-0.110771-0.77540.220916
41-0.015306-0.10710.457556
420.0384110.26890.394576
43-0.028429-0.1990.421542
44-0.063913-0.44740.328283
450.1541081.07880.14299
46-0.085203-0.59640.276821
47-0.073104-0.51170.305571
48-0.049358-0.34550.365597
49NANANA
50NANANA
51NANANA
52NANANA
53NANANA
54NANANA
55NANANA
56NANANA
57NANANA
58NANANA
59NANANA
60NANANA


Parameters (Session):
par1 = 60 ; par2 = 1 ; par3 = 0 ; par4 = 1 ; par5 = 12 ; par6 = White Noise ; par7 = 0.95 ;
Parameters (R input):
par1 = 60 ; par2 = 1 ; par3 = 0 ; par4 = 1 ; par5 = 12 ; par6 = MA ; par7 = 0.95 ;
R code (references can be found in the software module):
if (par1 == 'Default') {
par1 = 10*log10(length(x))
} else {
par1 <- as.numeric(par1)
}
par2 <- as.numeric(par2)
par3 <- as.numeric(par3)
par4 <- as.numeric(par4)
par5 <- as.numeric(par5)
if (par6 == 'White Noise') par6 <- 'white' else par6 <- 'ma'
par7 <- as.numeric(par7)
if (par2 == 0) {
x <- log(x)
} else {
x <- (x ^ par2 - 1) / par2
}
if (par3 > 0) x <- diff(x,lag=1,difference=par3)
if (par4 > 0) x <- diff(x,lag=par5,difference=par4)
bitmap(file='pic1.png')
racf <- acf(x, par1, main='Autocorrelation', xlab='time lag', ylab='ACF', ci.type=par6, ci=par7, sub=paste('(lambda=',par2,', d=',par3,', D=',par4,', CI=', par7, ', CI type=',par6,')',sep=''))
dev.off()
bitmap(file='pic2.png')
rpacf <- pacf(x,par1,main='Partial Autocorrelation',xlab='lags',ylab='PACF')
dev.off()
(myacf <- c(racf$acf))
(mypacf <- c(rpacf$acf))
lengthx <- length(x)
sqrtn <- sqrt(lengthx)
load(file='createtable')
a<-table.start()
a<-table.row.start(a)
a<-table.element(a,'Autocorrelation Function',4,TRUE)
a<-table.row.end(a)
a<-table.row.start(a)
a<-table.element(a,'Time lag k',header=TRUE)
a<-table.element(a,hyperlink('basics.htm','ACF(k)','click here for more information about the Autocorrelation Function'),header=TRUE)
a<-table.element(a,'T-STAT',header=TRUE)
a<-table.element(a,'P-value',header=TRUE)
a<-table.row.end(a)
for (i in 2:(par1+1)) {
a<-table.row.start(a)
a<-table.element(a,i-1,header=TRUE)
a<-table.element(a,round(myacf[i],6))
mytstat <- myacf[i]*sqrtn
a<-table.element(a,round(mytstat,4))
a<-table.element(a,round(1-pt(abs(mytstat),lengthx),6))
a<-table.row.end(a)
}
a<-table.end(a)
table.save(a,file='mytable.tab')
a<-table.start()
a<-table.row.start(a)
a<-table.element(a,'Partial Autocorrelation Function',4,TRUE)
a<-table.row.end(a)
a<-table.row.start(a)
a<-table.element(a,'Time lag k',header=TRUE)
a<-table.element(a,hyperlink('basics.htm','PACF(k)','click here for more information about the Partial Autocorrelation Function'),header=TRUE)
a<-table.element(a,'T-STAT',header=TRUE)
a<-table.element(a,'P-value',header=TRUE)
a<-table.row.end(a)
for (i in 1:par1) {
a<-table.row.start(a)
a<-table.element(a,i,header=TRUE)
a<-table.element(a,round(mypacf[i],6))
mytstat <- mypacf[i]*sqrtn
a<-table.element(a,round(mytstat,4))
a<-table.element(a,round(1-pt(abs(mytstat),lengthx),6))
a<-table.row.end(a)
}
a<-table.end(a)
table.save(a,file='mytable1.tab')