Free Statistics
of Irreproducible Research!
Description of Statistical Computation | |||||||||||||||||||||||||||||||||||||||||
|---|---|---|---|---|---|---|---|---|---|---|---|---|---|---|---|---|---|---|---|---|---|---|---|---|---|---|---|---|---|---|---|---|---|---|---|---|---|---|---|---|---|
| Author's title | |||||||||||||||||||||||||||||||||||||||||
| Author | *Unverified author* | ||||||||||||||||||||||||||||||||||||||||
| R Software Module | rwasp_univariatedataseries.wasp | ||||||||||||||||||||||||||||||||||||||||
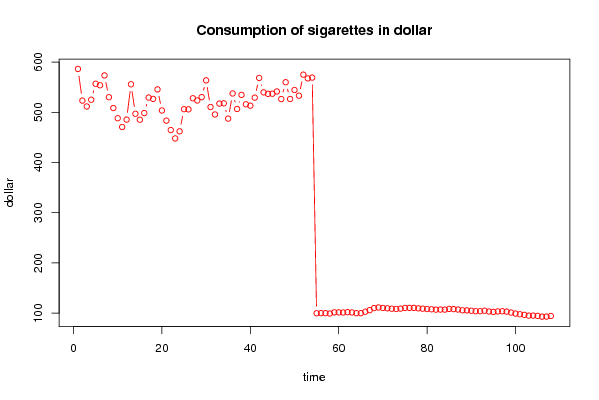
| Title produced by software | Univariate Data Series | ||||||||||||||||||||||||||||||||||||||||
| Date of computation | Tue, 03 Feb 2009 07:53:35 -0700 | ||||||||||||||||||||||||||||||||||||||||
| Cite this page as follows | Statistical Computations at FreeStatistics.org, Office for Research Development and Education, URL https://freestatistics.org/blog/index.php?v=date/2009/Feb/03/t1233672989egmcg8z29zqbbut.htm/, Retrieved Mon, 13 May 2024 10:59:43 +0000 | ||||||||||||||||||||||||||||||||||||||||
| Statistical Computations at FreeStatistics.org, Office for Research Development and Education, URL https://freestatistics.org/blog/index.php?pk=37011, Retrieved Mon, 13 May 2024 10:59:43 +0000 | |||||||||||||||||||||||||||||||||||||||||
| QR Codes: | |||||||||||||||||||||||||||||||||||||||||
|
| |||||||||||||||||||||||||||||||||||||||||
| Original text written by user: | |||||||||||||||||||||||||||||||||||||||||
| IsPrivate? | No (this computation is public) | ||||||||||||||||||||||||||||||||||||||||
| User-defined keywords | |||||||||||||||||||||||||||||||||||||||||
| Estimated Impact | 245 | ||||||||||||||||||||||||||||||||||||||||
Tree of Dependent Computations | |||||||||||||||||||||||||||||||||||||||||
| Family? (F = Feedback message, R = changed R code, M = changed R Module, P = changed Parameters, D = changed Data) | |||||||||||||||||||||||||||||||||||||||||
| - [Univariate Data Series] [] [2009-02-03 14:53:35] [d41d8cd98f00b204e9800998ecf8427e] [Current] | |||||||||||||||||||||||||||||||||||||||||
| Feedback Forum | |||||||||||||||||||||||||||||||||||||||||
Post a new message | |||||||||||||||||||||||||||||||||||||||||
Dataset | |||||||||||||||||||||||||||||||||||||||||
| Dataseries X: | |||||||||||||||||||||||||||||||||||||||||
586.202 523.136 511.540 524.915 556.756 553.725 573.282 529.892 508.306 488.091 470.617 485.309 555.666 496.990 485.102 498.366 529.230 526.534 545.496 503.524 483.295 464.569 447.858 462.065 506.091 505.810 527.868 523.437 530.101 563.465 510.430 495.608 517.241 517.753 487.342 537.400 506.545 534.554 515.823 513.105 529.079 568.315 539.594 536.638 536.822 541.323 526.262 559.748 526.401 544.358 532.919 574.865 567.433 568.984 99.86 100.05 100.05 99.31 101.64 101.59 101.36 102.03 101.43 100.00 100.04 102.89 105.96 110.16 111.37 110.37 109.72 108.85 108.31 109.04 110.42 110.52 110.56 109.63 108.93 108.20 107.73 107.01 107.15 107.07 108.54 108.08 107.23 105.81 105.56 104.80 103.90 103.91 104.86 103.32 102.53 103.48 103.86 103.09 101.21 99.23 97.87 96.68 95.15 95.20 94.65 93.08 93.18 94.43 | |||||||||||||||||||||||||||||||||||||||||
Tables (Output of Computation) | |||||||||||||||||||||||||||||||||||||||||
| |||||||||||||||||||||||||||||||||||||||||
Figures (Output of Computation) | |||||||||||||||||||||||||||||||||||||||||
Input Parameters & R Code | |||||||||||||||||||||||||||||||||||||||||
| Parameters (Session): | |||||||||||||||||||||||||||||||||||||||||
| par1 = Sigarette consumption ; par2 = http://www.robjhyndman.com/TSDL/ ; par3 = consumptie van sigaretten in dollars ; | |||||||||||||||||||||||||||||||||||||||||
| Parameters (R input): | |||||||||||||||||||||||||||||||||||||||||
| par1 = Sigarette consumption ; par2 = http://www.robjhyndman.com/TSDL/ ; par3 = consumptie van sigaretten in dollars ; | |||||||||||||||||||||||||||||||||||||||||
| R code (references can be found in the software module): | |||||||||||||||||||||||||||||||||||||||||
bitmap(file='test1.png') | |||||||||||||||||||||||||||||||||||||||||