Free Statistics
of Irreproducible Research!
Description of Statistical Computation | |||||||||||||||||||||||||||||||||||||||||
|---|---|---|---|---|---|---|---|---|---|---|---|---|---|---|---|---|---|---|---|---|---|---|---|---|---|---|---|---|---|---|---|---|---|---|---|---|---|---|---|---|---|
| Author's title | |||||||||||||||||||||||||||||||||||||||||
| Author | *Unverified author* | ||||||||||||||||||||||||||||||||||||||||
| R Software Module | rwasp_univariatedataseries.wasp | ||||||||||||||||||||||||||||||||||||||||
| Title produced by software | Univariate Data Series | ||||||||||||||||||||||||||||||||||||||||
| Date of computation | Sat, 07 Feb 2009 09:27:40 -0700 | ||||||||||||||||||||||||||||||||||||||||
| Cite this page as follows | Statistical Computations at FreeStatistics.org, Office for Research Development and Education, URL https://freestatistics.org/blog/index.php?v=date/2009/Feb/07/t12340242040wsfeidhq4dozxv.htm/, Retrieved Sat, 11 May 2024 06:50:52 +0000 | ||||||||||||||||||||||||||||||||||||||||
| Statistical Computations at FreeStatistics.org, Office for Research Development and Education, URL https://freestatistics.org/blog/index.php?pk=37061, Retrieved Sat, 11 May 2024 06:50:52 +0000 | |||||||||||||||||||||||||||||||||||||||||
| QR Codes: | |||||||||||||||||||||||||||||||||||||||||
|
| |||||||||||||||||||||||||||||||||||||||||
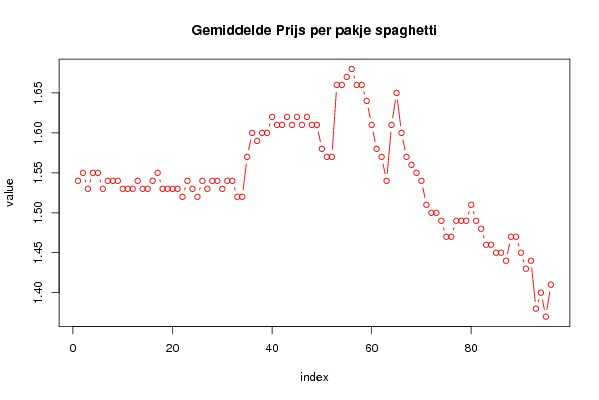
| Original text written by user: | Gemiddelde prijs per pakje spaghetti | ||||||||||||||||||||||||||||||||||||||||
| IsPrivate? | No (this computation is public) | ||||||||||||||||||||||||||||||||||||||||
| User-defined keywords | Gemiddelde prijs per pakje spaghetti | ||||||||||||||||||||||||||||||||||||||||
| Estimated Impact | 215 | ||||||||||||||||||||||||||||||||||||||||
Tree of Dependent Computations | |||||||||||||||||||||||||||||||||||||||||
| Family? (F = Feedback message, R = changed R code, M = changed R Module, P = changed Parameters, D = changed Data) | |||||||||||||||||||||||||||||||||||||||||
| - [Univariate Data Series] [Gemiddelde prijs ...] [2009-02-07 16:27:40] [d41d8cd98f00b204e9800998ecf8427e] [Current] | |||||||||||||||||||||||||||||||||||||||||
| Feedback Forum | |||||||||||||||||||||||||||||||||||||||||
Post a new message | |||||||||||||||||||||||||||||||||||||||||
Dataset | |||||||||||||||||||||||||||||||||||||||||
| Dataseries X: | |||||||||||||||||||||||||||||||||||||||||
1.54 1.55 1.53 1.55 1.55 1.53 1.54 1.54 1.54 1.53 1.53 1.53 1.54 1.53 1.53 1.54 1.55 1.53 1.53 1.53 1.53 1.52 1.54 1.53 1.52 1.54 1.53 1.54 1.54 1.53 1.54 1.54 1.52 1.52 1.57 1.6 1.59 1.6 1.6 1.62 1.61 1.61 1.62 1.61 1.62 1.61 1.62 1.61 1.61 1.58 1.57 1.57 1.66 1.66 1.67 1.68 1.66 1.66 1.64 1.61 1.58 1.57 1.54 1.61 1.65 1.6 1.57 1.56 1.55 1.54 1.51 1.5 1.5 1.49 1.47 1.47 1.49 1.49 1.49 1.51 1.49 1.48 1.46 1.46 1.45 1.45 1.44 1.47 1.47 1.45 1.43 1.44 1.38 1.4 1.37 1.41 | |||||||||||||||||||||||||||||||||||||||||
Tables (Output of Computation) | |||||||||||||||||||||||||||||||||||||||||
| |||||||||||||||||||||||||||||||||||||||||
Figures (Output of Computation) | |||||||||||||||||||||||||||||||||||||||||
Input Parameters & R Code | |||||||||||||||||||||||||||||||||||||||||
| Parameters (Session): | |||||||||||||||||||||||||||||||||||||||||
| par1 = de gemiddelde consumentenprijs per product: Spaghetti ; par2 = http://www.nbb.be/belgostat/PresentationLinker?TableId=151000085&Lang=E ; par3 = Gemiddelde uitgaven van consumenten aan spaghetti in Belgi� ; | |||||||||||||||||||||||||||||||||||||||||
| Parameters (R input): | |||||||||||||||||||||||||||||||||||||||||
| par1 = de gemiddelde consumentenprijs per product: Spaghetti ; par2 = http://www.nbb.be/belgostat/PresentationLinker?TableId=151000085&Lang=E ; par3 = Gemiddelde uitgaven van consumenten aan spaghetti in Belgi� ; | |||||||||||||||||||||||||||||||||||||||||
| R code (references can be found in the software module): | |||||||||||||||||||||||||||||||||||||||||
bitmap(file='test1.png') | |||||||||||||||||||||||||||||||||||||||||