Free Statistics
of Irreproducible Research!
Description of Statistical Computation | |||||||||||||||||||||||||||||||||||||||||
|---|---|---|---|---|---|---|---|---|---|---|---|---|---|---|---|---|---|---|---|---|---|---|---|---|---|---|---|---|---|---|---|---|---|---|---|---|---|---|---|---|---|
| Author's title | |||||||||||||||||||||||||||||||||||||||||
| Author | *Unverified author* | ||||||||||||||||||||||||||||||||||||||||
| R Software Module | rwasp_univariatedataseries.wasp | ||||||||||||||||||||||||||||||||||||||||
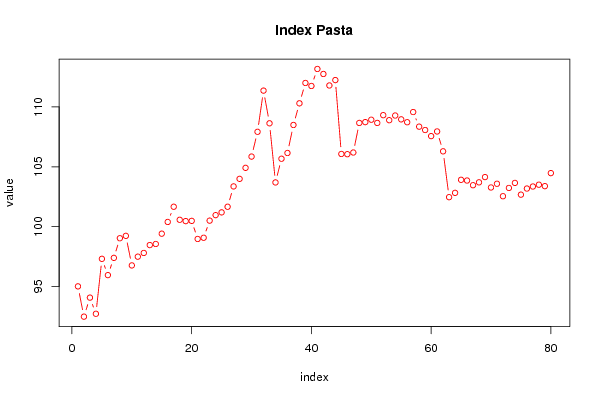
| Title produced by software | Univariate Data Series | ||||||||||||||||||||||||||||||||||||||||
| Date of computation | Thu, 12 Feb 2009 05:30:05 -0700 | ||||||||||||||||||||||||||||||||||||||||
| Cite this page as follows | Statistical Computations at FreeStatistics.org, Office for Research Development and Education, URL https://freestatistics.org/blog/index.php?v=date/2009/Feb/12/t1234442687e6qc5d3sid0bfqz.htm/, Retrieved Fri, 10 May 2024 19:46:04 +0000 | ||||||||||||||||||||||||||||||||||||||||
| Statistical Computations at FreeStatistics.org, Office for Research Development and Education, URL https://freestatistics.org/blog/index.php?pk=37358, Retrieved Fri, 10 May 2024 19:46:04 +0000 | |||||||||||||||||||||||||||||||||||||||||
| QR Codes: | |||||||||||||||||||||||||||||||||||||||||
|
| |||||||||||||||||||||||||||||||||||||||||
| Original text written by user: | |||||||||||||||||||||||||||||||||||||||||
| IsPrivate? | No (this computation is public) | ||||||||||||||||||||||||||||||||||||||||
| User-defined keywords | Deze cijferreeks stelt de index van de consumptieprijzen voor pasta voor. De gegevenreeks start op 31 mei 2005 en eindigt op 31 december 2005, met een tijdsinterval van een maand. | ||||||||||||||||||||||||||||||||||||||||
| Estimated Impact | 173 | ||||||||||||||||||||||||||||||||||||||||
Tree of Dependent Computations | |||||||||||||||||||||||||||||||||||||||||
| Family? (F = Feedback message, R = changed R code, M = changed R Module, P = changed Parameters, D = changed Data) | |||||||||||||||||||||||||||||||||||||||||
| - [Univariate Data Series] [Indexcijfer Pasta] [2009-02-12 12:30:05] [50f129a01f58c387281f6c9e8a03b51e] [Current] - RMP [Histogram] [] [2009-02-17 10:33:31] [f9aea4deea701c436bd25420190ac40b] - RMP [Kernel Density Estimation] [] [2009-02-17 10:41:38] [f9aea4deea701c436bd25420190ac40b] | |||||||||||||||||||||||||||||||||||||||||
| Feedback Forum | |||||||||||||||||||||||||||||||||||||||||
Post a new message | |||||||||||||||||||||||||||||||||||||||||
Dataset | |||||||||||||||||||||||||||||||||||||||||
| Dataseries X: | |||||||||||||||||||||||||||||||||||||||||
95.01 92.48 94.07 92.72 97.31 95.95 97.39 99.03 99.23 96.76 97.49 97.8 98.46 98.55 99.41 100.39 101.66 100.57 100.46 100.48 98.97 99.07 100.5 100.96 101.19 101.66 103.36 103.99 104.91 105.85 107.92 111.36 108.63 103.69 105.67 106.15 108.49 110.3 112 111.75 113.17 112.75 111.79 112.24 106.07 106.05 106.19 108.66 108.73 108.93 108.66 109.31 108.89 109.28 108.96 108.72 109.57 108.35 108.07 107.56 107.95 106.29 102.46 102.82 103.91 103.85 103.46 103.7 104.14 103.27 103.58 102.54 103.23 103.65 102.67 103.18 103.35 103.5 103.38 104.47 | |||||||||||||||||||||||||||||||||||||||||
Tables (Output of Computation) | |||||||||||||||||||||||||||||||||||||||||
| |||||||||||||||||||||||||||||||||||||||||
Figures (Output of Computation) | |||||||||||||||||||||||||||||||||||||||||
Input Parameters & R Code | |||||||||||||||||||||||||||||||||||||||||
| Parameters (Session): | |||||||||||||||||||||||||||||||||||||||||
| par1 = pasta ; par2 = www.nbb.be/belgostat/PublicatieSelectieLinker?LinkID=151000022%7C910000082&Lang=N ; par3 = Indexcijfer consumptieprijzen pasta ; | |||||||||||||||||||||||||||||||||||||||||
| Parameters (R input): | |||||||||||||||||||||||||||||||||||||||||
| par1 = pasta ; par2 = www.nbb.be/belgostat/PublicatieSelectieLinker?LinkID=151000022%7C910000082&Lang=N ; par3 = Indexcijfer consumptieprijzen pasta ; | |||||||||||||||||||||||||||||||||||||||||
| R code (references can be found in the software module): | |||||||||||||||||||||||||||||||||||||||||
bitmap(file='test1.png') | |||||||||||||||||||||||||||||||||||||||||