Free Statistics

of Irreproducible Research!

Author's title

Author*Unverified author*
R Software Modulerwasp_notchedbox1.wasp
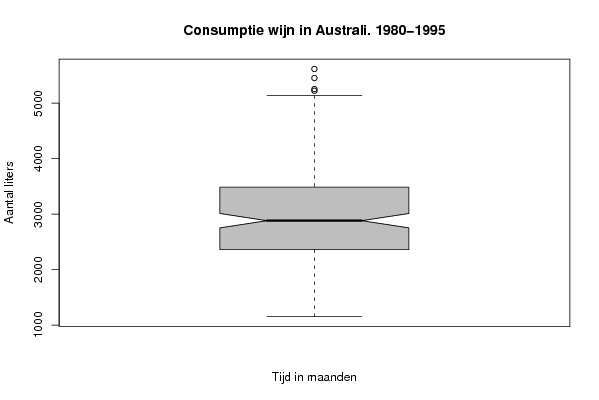
Title produced by softwareNotched Boxplots
Date of computationWed, 18 Feb 2009 10:32:12 -0700
Cite this page as followsStatistical Computations at FreeStatistics.org, Office for Research Development and Education, URL https://freestatistics.org/blog/index.php?v=date/2009/Feb/18/t1234978442xj34chajmgh1nc6.htm/, Retrieved Sat, 11 May 2024 09:52:23 +0000
Statistical Computations at FreeStatistics.org, Office for Research Development and Education, URL https://freestatistics.org/blog/index.php?pk=37950, Retrieved Sat, 11 May 2024 09:52:23 +0000
QR Codes:

Original text written by user:
IsPrivate?No (this computation is public)
User-defined keywords
Estimated Impact151
Family? (F = Feedback message, R = changed R code, M = changed R Module, P = changed Parameters, D = changed Data)
-     [Kernel Density Estimation] [] [2009-02-11 11:43:59] [74be16979710d4c4e7c6647856088456]
- RMPD    [Notched Boxplots] [Opgave 3-Box plot...] [2009-02-18 17:32:12] [866e757444a60b1c09d57e14cc8533e4] [Current]
Feedback Forum

Post a new message
Dataseries X:
1153
1154
1208
1330
1412
1482
1545
1558
1568
1610
1643
1651
1686
1725
1755
1772
1818
1914
1940
1954
1964
1965
1968
2016
2017
2018
2101
2112
2127
2132
2181
2193
2198
2214
2226
2248
2250
2262
2264
2280
2285
2294
2316
2320
2329
2349
2354
2369
2369
2380
2415
2416
2457
2458
2467
2482
2507
2511
2514
2523
2524
2526
2545
2555
2579
2585
2592
2604
2606
2612
2622
2626
2659
2660
2676
2714
2714
2724
2755
2757
2774
2777
2799
2822
2828
2834
2836
2840
2855
2856
2862
2862
2876
2883
2892
2897
2898
2898
2917
2923
2934
2954
2967
2972
2976
2985
2986
3006
3017
3056
3074
3076
3079
3111
3118
3145
3159
3163
3164
3168
3179
3210
3224
3260
3262
3263
3265
3295
3307
3310
3368
3389
3402
3420
3425
3433
3446
3446
3465
3470
3502
3508
3584
3624
3626
3629
3633
3646
3661
3717
3718
3728
3756
3758
3790
3795
3802
3816
3822
3932
3951
3990
4009
4027
4041
4042
4092
4117
4151
4198
4216
4225
4231
4239
4326
4377
4420
4426
4442
4523
4935
5054
5138
5225
5255
5454
5618


Summary of computational transaction
Raw Inputview raw input (R code)
Raw Outputview raw output of R engine
Computing time2 seconds
R Server'Sir Ronald Aylmer Fisher' @ 193.190.124.24

\begin{tabular}{lllllllll}
\hline
Summary of computational transaction \tabularnewline
Raw Input & view raw input (R code)  \tabularnewline
Raw Output & view raw output of R engine  \tabularnewline
Computing time & 2 seconds \tabularnewline
R Server & 'Sir Ronald Aylmer Fisher' @ 193.190.124.24 \tabularnewline
\hline
\end{tabular}
%Source: https://freestatistics.org/blog/index.php?pk=37950&T=0

[TABLE]
[ROW][C]Summary of computational transaction[/C][/ROW]
[ROW][C]Raw Input[/C][C]view raw input (R code) [/C][/ROW]
[ROW][C]Raw Output[/C][C]view raw output of R engine [/C][/ROW]
[ROW][C]Computing time[/C][C]2 seconds[/C][/ROW]
[ROW][C]R Server[/C][C]'Sir Ronald Aylmer Fisher' @ 193.190.124.24[/C][/ROW]
[/TABLE]
Source: https://freestatistics.org/blog/index.php?pk=37950&T=0

Globally Unique Identifier (entire table): ba.freestatistics.org/blog/index.php?pk=37950&T=0

As an alternative you can also use a QR Code:  

The GUIDs for individual cells are displayed in the table below:

Summary of computational transaction
Raw Inputview raw input (R code)
Raw Outputview raw output of R engine
Computing time2 seconds
R Server'Sir Ronald Aylmer Fisher' @ 193.190.124.24


\begin{tabular}{lllllllll}
\hline
Boxplot statistics \tabularnewline
Variable & lower whisker & lower hinge & median & upper hinge & upper whisker \tabularnewline
 & 1153 & 2361.5 & 2883 & 3486 & 5138 \tabularnewline
\hline
\end{tabular}
%Source: https://freestatistics.org/blog/index.php?pk=37950&T=1

[TABLE]
[ROW][C]Boxplot statistics[/C][/ROW]
[ROW][C]Variable[/C][C]lower whisker[/C][C]lower hinge[/C][C]median[/C][C]upper hinge[/C][C]upper whisker[/C][/ROW]
[ROW][C][/C][C]1153[/C][C]2361.5[/C][C]2883[/C][C]3486[/C][C]5138[/C][/ROW]
[/TABLE]
Source: https://freestatistics.org/blog/index.php?pk=37950&T=1

Globally Unique Identifier (entire table): ba.freestatistics.org/blog/index.php?pk=37950&T=1

As an alternative you can also use a QR Code:  

The GUIDs for individual cells are displayed in the table below:

Boxplot statistics
Variablelower whiskerlower hingemedianupper hingeupper whisker
11532361.5288334865138


Boxplot Notches
Variablelower boundmedianupper bound
2753.0740971329128833012.92590286709

\begin{tabular}{lllllllll}
\hline
Boxplot Notches \tabularnewline
Variable & lower bound & median & upper bound \tabularnewline
 & 2753.07409713291 & 2883 & 3012.92590286709 \tabularnewline
\hline
\end{tabular}
%Source: https://freestatistics.org/blog/index.php?pk=37950&T=2

[TABLE]
[ROW][C]Boxplot Notches[/C][/ROW]
[ROW][C]Variable[/C][C]lower bound[/C][C]median[/C][C]upper bound[/C][/ROW]
[ROW][C][/C][C]2753.07409713291[/C][C]2883[/C][C]3012.92590286709[/C][/ROW]
[/TABLE]
Source: https://freestatistics.org/blog/index.php?pk=37950&T=2

Globally Unique Identifier (entire table): ba.freestatistics.org/blog/index.php?pk=37950&T=2

As an alternative you can also use a QR Code:  

The GUIDs for individual cells are displayed in the table below:

Boxplot Notches
Variablelower boundmedianupper bound
2753.0740971329128833012.92590286709


Parameters (Session):
par1 = grey ;
Parameters (R input):
par1 = grey ;
R code (references can be found in the software module):
z <- as.data.frame(t(y))
bitmap(file='test1.png')
(r<-boxplot(z ,xlab=xlab,ylab=ylab,main=main,notch=TRUE,col=par1))
dev.off()
load(file='createtable')
a<-table.start()
a<-table.row.start(a)
a<-table.element(a,hyperlink('overview.htm','Boxplot statistics','Boxplot overview'),6,TRUE)
a<-table.row.end(a)
a<-table.row.start(a)
a<-table.element(a,'Variable',1,TRUE)
a<-table.element(a,hyperlink('lower_whisker.htm','lower whisker','definition of lower whisker'),1,TRUE)
a<-table.element(a,hyperlink('lower_hinge.htm','lower hinge','definition of lower hinge'),1,TRUE)
a<-table.element(a,hyperlink('central_tendency.htm','median','definitions about measures of central tendency'),1,TRUE)
a<-table.element(a,hyperlink('upper_hinge.htm','upper hinge','definition of upper hinge'),1,TRUE)
a<-table.element(a,hyperlink('upper_whisker.htm','upper whisker','definition of upper whisker'),1,TRUE)
a<-table.row.end(a)
for (i in 1:length(y[,1]))
{
a<-table.row.start(a)
a<-table.element(a,dimnames(t(x))[[2]][i],1,TRUE)
for (j in 1:5)
{
a<-table.element(a,r$stats[j,i])
}
a<-table.row.end(a)
}
a<-table.end(a)
table.save(a,file='mytable.tab')
a<-table.start()
a<-table.row.start(a)
a<-table.element(a,'Boxplot Notches',4,TRUE)
a<-table.row.end(a)
a<-table.row.start(a)
a<-table.element(a,'Variable',1,TRUE)
a<-table.element(a,'lower bound',1,TRUE)
a<-table.element(a,'median',1,TRUE)
a<-table.element(a,'upper bound',1,TRUE)
a<-table.row.end(a)
for (i in 1:length(y[,1]))
{
a<-table.row.start(a)
a<-table.element(a,dimnames(t(x))[[2]][i],1,TRUE)
a<-table.element(a,r$conf[1,i])
a<-table.element(a,r$stats[3,i])
a<-table.element(a,r$conf[2,i])
a<-table.row.end(a)
}
a<-table.end(a)
table.save(a,file='mytable1.tab')