Free Statistics

of Irreproducible Research!

Author's title

Author*The author of this computation has been verified*
R Software Modulerwasp_multipleregression.wasp
Title produced by softwareMultiple Regression
Date of computationTue, 21 Dec 2010 15:49:33 +0000
Cite this page as followsStatistical Computations at FreeStatistics.org, Office for Research Development and Education, URL https://freestatistics.org/blog/index.php?v=date/2010/Dec/21/t1292946508x1g4393nmyu2cty.htm/, Retrieved Sun, 19 May 2024 03:08:42 +0000
Statistical Computations at FreeStatistics.org, Office for Research Development and Education, URL https://freestatistics.org/blog/index.php?pk=113692, Retrieved Sun, 19 May 2024 03:08:42 +0000
QR Codes:

Original text written by user:
IsPrivate?No (this computation is public)
User-defined keywords
Estimated Impact121
Family? (F = Feedback message, R = changed R code, M = changed R Module, P = changed Parameters, D = changed Data)
-     [Multiple Regression] [HPC Retail Sales] [2008-03-08 13:40:54] [1c0f2c85e8a48e42648374b3bcceca26]
-  MPD    [Multiple Regression] [] [2010-12-21 15:49:33] [7b390cc0228d34e5578246b07143e3df] [Current]
Feedback Forum

Post a new message
Dataseries X:
3010
2910
3840
3580
3140
3550
3250
2820
2260
2060
2120
2210
2190
2180
2350
2440
2370
2440
2610
3040
3190
3120
3170
3600
3420
3650
4180
2960
2710
2950
3030
3770
4740
4450
5550
5580
5890
7480
10450
6360
6710
6200
4490
3480
2520
1920
2010
1950
2240
2370
2840
2700
2980
3290
3300
3000
2330
2190
1970
2170
2830
3190
3550
3240
3450
3570
3230
3260
2700


Summary of computational transaction
Raw Inputview raw input (R code)
Raw Outputview raw output of R engine
Computing time5 seconds
R Server'Sir Ronald Aylmer Fisher' @ 193.190.124.24

\begin{tabular}{lllllllll}
\hline
Summary of computational transaction \tabularnewline
Raw Input & view raw input (R code)  \tabularnewline
Raw Output & view raw output of R engine  \tabularnewline
Computing time & 5 seconds \tabularnewline
R Server & 'Sir Ronald Aylmer Fisher' @ 193.190.124.24 \tabularnewline
\hline
\end{tabular}
%Source: https://freestatistics.org/blog/index.php?pk=113692&T=0

[TABLE]
[ROW][C]Summary of computational transaction[/C][/ROW]
[ROW][C]Raw Input[/C][C]view raw input (R code) [/C][/ROW]
[ROW][C]Raw Output[/C][C]view raw output of R engine [/C][/ROW]
[ROW][C]Computing time[/C][C]5 seconds[/C][/ROW]
[ROW][C]R Server[/C][C]'Sir Ronald Aylmer Fisher' @ 193.190.124.24[/C][/ROW]
[/TABLE]
Source: https://freestatistics.org/blog/index.php?pk=113692&T=0

Globally Unique Identifier (entire table): ba.freestatistics.org/blog/index.php?pk=113692&T=0

As an alternative you can also use a QR Code:  

The GUIDs for individual cells are displayed in the table below:

Summary of computational transaction
Raw Inputview raw input (R code)
Raw Outputview raw output of R engine
Computing time5 seconds
R Server'Sir Ronald Aylmer Fisher' @ 193.190.124.24


Multiple Linear Regression - Estimated Regression Equation
Garnalen[t] = + 2910.56 + 187.922222222223M1[t] + 549.271111111111M2[t] + 1448.95333333333M3[t] + 455.302222222222M4[t] + 463.317777777778M5[t] + 564.666666666667M6[t] + 211.015555555556M7[t] + 115.697777777778M8[t] -161.286666666666M9[t] -343.364444444444M10[t] -132.682222222222M11[t] + 5.31777777777777t + e[t]

\begin{tabular}{lllllllll}
\hline
Multiple Linear Regression - Estimated Regression Equation \tabularnewline
Garnalen[t] =  +  2910.56 +  187.922222222223M1[t] +  549.271111111111M2[t] +  1448.95333333333M3[t] +  455.302222222222M4[t] +  463.317777777778M5[t] +  564.666666666667M6[t] +  211.015555555556M7[t] +  115.697777777778M8[t] -161.286666666666M9[t] -343.364444444444M10[t] -132.682222222222M11[t] +  5.31777777777777t  + e[t] \tabularnewline
\hline
\end{tabular}
%Source: https://freestatistics.org/blog/index.php?pk=113692&T=1

[TABLE]
[ROW][C]Multiple Linear Regression - Estimated Regression Equation[/C][/ROW]
[ROW][C]Garnalen[t] =  +  2910.56 +  187.922222222223M1[t] +  549.271111111111M2[t] +  1448.95333333333M3[t] +  455.302222222222M4[t] +  463.317777777778M5[t] +  564.666666666667M6[t] +  211.015555555556M7[t] +  115.697777777778M8[t] -161.286666666666M9[t] -343.364444444444M10[t] -132.682222222222M11[t] +  5.31777777777777t  + e[t][/C][/ROW]
[/TABLE]
Source: https://freestatistics.org/blog/index.php?pk=113692&T=1

Globally Unique Identifier (entire table): ba.freestatistics.org/blog/index.php?pk=113692&T=1

As an alternative you can also use a QR Code:  

The GUIDs for individual cells are displayed in the table below:

Multiple Linear Regression - Estimated Regression Equation
Garnalen[t] = + 2910.56 + 187.922222222223M1[t] + 549.271111111111M2[t] + 1448.95333333333M3[t] + 455.302222222222M4[t] + 463.317777777778M5[t] + 564.666666666667M6[t] + 211.015555555556M7[t] + 115.697777777778M8[t] -161.286666666666M9[t] -343.364444444444M10[t] -132.682222222222M11[t] + 5.31777777777777t + e[t]


Multiple Linear Regression - Ordinary Least Squares
VariableParameterS.D.T-STATH0: parameter = 02-tail p-value1-tail p-value
(Intercept)2910.56769.5108563.78240.000380.00019
M1187.922222222223936.8548010.20060.8417470.420874
M2549.271111111111936.4299340.58660.5598570.279929
M31448.95333333333936.0993491.54790.1272890.063644
M4455.302222222222935.8631450.48650.6285080.314254
M5463.317777777778935.7213940.49510.6224350.311218
M6564.666666666667935.6741390.60350.5486220.274311
M7211.015555555556935.7213940.22550.8224030.411201
M8115.697777777778935.8631450.12360.9020530.451027
M9-161.286666666666936.099349-0.17230.8638260.431913
M10-343.364444444444977.460726-0.35130.7266950.363347
M11-132.682222222222977.325008-0.13580.8924970.446249
t5.317777777777779.4038790.56550.5740010.287

\begin{tabular}{lllllllll}
\hline
Multiple Linear Regression - Ordinary Least Squares \tabularnewline
Variable & Parameter & S.D. & T-STATH0: parameter = 0 & 2-tail p-value & 1-tail p-value \tabularnewline
(Intercept) & 2910.56 & 769.510856 & 3.7824 & 0.00038 & 0.00019 \tabularnewline
M1 & 187.922222222223 & 936.854801 & 0.2006 & 0.841747 & 0.420874 \tabularnewline
M2 & 549.271111111111 & 936.429934 & 0.5866 & 0.559857 & 0.279929 \tabularnewline
M3 & 1448.95333333333 & 936.099349 & 1.5479 & 0.127289 & 0.063644 \tabularnewline
M4 & 455.302222222222 & 935.863145 & 0.4865 & 0.628508 & 0.314254 \tabularnewline
M5 & 463.317777777778 & 935.721394 & 0.4951 & 0.622435 & 0.311218 \tabularnewline
M6 & 564.666666666667 & 935.674139 & 0.6035 & 0.548622 & 0.274311 \tabularnewline
M7 & 211.015555555556 & 935.721394 & 0.2255 & 0.822403 & 0.411201 \tabularnewline
M8 & 115.697777777778 & 935.863145 & 0.1236 & 0.902053 & 0.451027 \tabularnewline
M9 & -161.286666666666 & 936.099349 & -0.1723 & 0.863826 & 0.431913 \tabularnewline
M10 & -343.364444444444 & 977.460726 & -0.3513 & 0.726695 & 0.363347 \tabularnewline
M11 & -132.682222222222 & 977.325008 & -0.1358 & 0.892497 & 0.446249 \tabularnewline
t & 5.31777777777777 & 9.403879 & 0.5655 & 0.574001 & 0.287 \tabularnewline
\hline
\end{tabular}
%Source: https://freestatistics.org/blog/index.php?pk=113692&T=2

[TABLE]
[ROW][C]Multiple Linear Regression - Ordinary Least Squares[/C][/ROW]
[ROW][C]Variable[/C][C]Parameter[/C][C]S.D.[/C][C]T-STATH0: parameter = 0[/C][C]2-tail p-value[/C][C]1-tail p-value[/C][/ROW]
[ROW][C](Intercept)[/C][C]2910.56[/C][C]769.510856[/C][C]3.7824[/C][C]0.00038[/C][C]0.00019[/C][/ROW]
[ROW][C]M1[/C][C]187.922222222223[/C][C]936.854801[/C][C]0.2006[/C][C]0.841747[/C][C]0.420874[/C][/ROW]
[ROW][C]M2[/C][C]549.271111111111[/C][C]936.429934[/C][C]0.5866[/C][C]0.559857[/C][C]0.279929[/C][/ROW]
[ROW][C]M3[/C][C]1448.95333333333[/C][C]936.099349[/C][C]1.5479[/C][C]0.127289[/C][C]0.063644[/C][/ROW]
[ROW][C]M4[/C][C]455.302222222222[/C][C]935.863145[/C][C]0.4865[/C][C]0.628508[/C][C]0.314254[/C][/ROW]
[ROW][C]M5[/C][C]463.317777777778[/C][C]935.721394[/C][C]0.4951[/C][C]0.622435[/C][C]0.311218[/C][/ROW]
[ROW][C]M6[/C][C]564.666666666667[/C][C]935.674139[/C][C]0.6035[/C][C]0.548622[/C][C]0.274311[/C][/ROW]
[ROW][C]M7[/C][C]211.015555555556[/C][C]935.721394[/C][C]0.2255[/C][C]0.822403[/C][C]0.411201[/C][/ROW]
[ROW][C]M8[/C][C]115.697777777778[/C][C]935.863145[/C][C]0.1236[/C][C]0.902053[/C][C]0.451027[/C][/ROW]
[ROW][C]M9[/C][C]-161.286666666666[/C][C]936.099349[/C][C]-0.1723[/C][C]0.863826[/C][C]0.431913[/C][/ROW]
[ROW][C]M10[/C][C]-343.364444444444[/C][C]977.460726[/C][C]-0.3513[/C][C]0.726695[/C][C]0.363347[/C][/ROW]
[ROW][C]M11[/C][C]-132.682222222222[/C][C]977.325008[/C][C]-0.1358[/C][C]0.892497[/C][C]0.446249[/C][/ROW]
[ROW][C]t[/C][C]5.31777777777777[/C][C]9.403879[/C][C]0.5655[/C][C]0.574001[/C][C]0.287[/C][/ROW]
[/TABLE]
Source: https://freestatistics.org/blog/index.php?pk=113692&T=2

Globally Unique Identifier (entire table): ba.freestatistics.org/blog/index.php?pk=113692&T=2

As an alternative you can also use a QR Code:  

The GUIDs for individual cells are displayed in the table below:

Multiple Linear Regression - Ordinary Least Squares
VariableParameterS.D.T-STATH0: parameter = 02-tail p-value1-tail p-value
(Intercept)2910.56769.5108563.78240.000380.00019
M1187.922222222223936.8548010.20060.8417470.420874
M2549.271111111111936.4299340.58660.5598570.279929
M31448.95333333333936.0993491.54790.1272890.063644
M4455.302222222222935.8631450.48650.6285080.314254
M5463.317777777778935.7213940.49510.6224350.311218
M6564.666666666667935.6741390.60350.5486220.274311
M7211.015555555556935.7213940.22550.8224030.411201
M8115.697777777778935.8631450.12360.9020530.451027
M9-161.286666666666936.099349-0.17230.8638260.431913
M10-343.364444444444977.460726-0.35130.7266950.363347
M11-132.682222222222977.325008-0.13580.8924970.446249
t5.317777777777779.4038790.56550.5740010.287


Multiple Linear Regression - Regression Statistics
Multiple R0.313235802042735
R-squared0.0981166676813552
Adjusted R-squared-0.0951440463869258
F-TEST (value)0.507690702450213
F-TEST (DF numerator)12
F-TEST (DF denominator)56
p-value0.901031492428415
Multiple Linear Regression - Residual Statistics
Residual Standard Deviation1545.21498427211
Sum Squared Residuals133710603.466667

\begin{tabular}{lllllllll}
\hline
Multiple Linear Regression - Regression Statistics \tabularnewline
Multiple R & 0.313235802042735 \tabularnewline
R-squared & 0.0981166676813552 \tabularnewline
Adjusted R-squared & -0.0951440463869258 \tabularnewline
F-TEST (value) & 0.507690702450213 \tabularnewline
F-TEST (DF numerator) & 12 \tabularnewline
F-TEST (DF denominator) & 56 \tabularnewline
p-value & 0.901031492428415 \tabularnewline
Multiple Linear Regression - Residual Statistics \tabularnewline
Residual Standard Deviation & 1545.21498427211 \tabularnewline
Sum Squared Residuals & 133710603.466667 \tabularnewline
\hline
\end{tabular}
%Source: https://freestatistics.org/blog/index.php?pk=113692&T=3

[TABLE]
[ROW][C]Multiple Linear Regression - Regression Statistics[/C][/ROW]
[ROW][C]Multiple R[/C][C]0.313235802042735[/C][/ROW]
[ROW][C]R-squared[/C][C]0.0981166676813552[/C][/ROW]
[ROW][C]Adjusted R-squared[/C][C]-0.0951440463869258[/C][/ROW]
[ROW][C]F-TEST (value)[/C][C]0.507690702450213[/C][/ROW]
[ROW][C]F-TEST (DF numerator)[/C][C]12[/C][/ROW]
[ROW][C]F-TEST (DF denominator)[/C][C]56[/C][/ROW]
[ROW][C]p-value[/C][C]0.901031492428415[/C][/ROW]
[ROW][C]Multiple Linear Regression - Residual Statistics[/C][/ROW]
[ROW][C]Residual Standard Deviation[/C][C]1545.21498427211[/C][/ROW]
[ROW][C]Sum Squared Residuals[/C][C]133710603.466667[/C][/ROW]
[/TABLE]
Source: https://freestatistics.org/blog/index.php?pk=113692&T=3

Globally Unique Identifier (entire table): ba.freestatistics.org/blog/index.php?pk=113692&T=3

As an alternative you can also use a QR Code:  

The GUIDs for individual cells are displayed in the table below:

Multiple Linear Regression - Regression Statistics
Multiple R0.313235802042735
R-squared0.0981166676813552
Adjusted R-squared-0.0951440463869258
F-TEST (value)0.507690702450213
F-TEST (DF numerator)12
F-TEST (DF denominator)56
p-value0.901031492428415
Multiple Linear Regression - Residual Statistics
Residual Standard Deviation1545.21498427211
Sum Squared Residuals133710603.466667


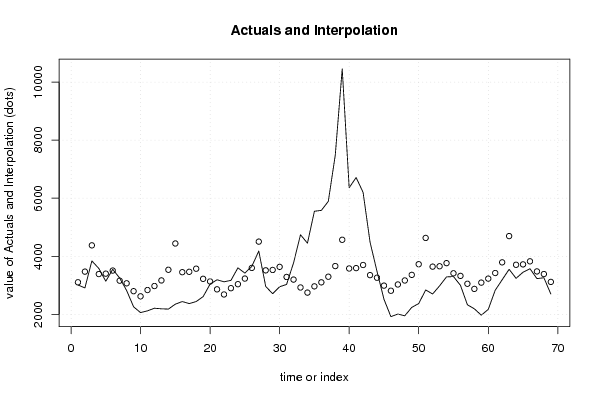
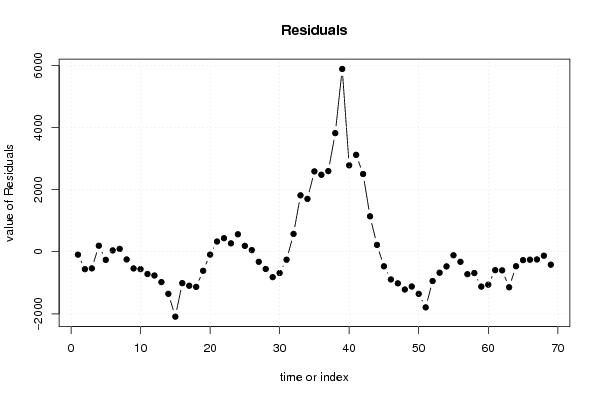
Multiple Linear Regression - Actuals, Interpolation, and Residuals
Time or IndexActualsInterpolationForecastResidualsPrediction Error
130103103.8-93.7999999999977
229103470.46666666667-560.466666666666
338404375.46666666667-535.466666666666
435803387.13333333333192.866666666667
531403400.46666666667-260.466666666667
635503507.1333333333342.8666666666662
732503158.891.1999999999998
828203068.8-248.8
922602797.13333333333-537.133333333333
1020602620.37333333333-560.373333333333
1121202836.37333333333-716.373333333333
1222102974.37333333333-764.373333333333
1321903167.61333333333-977.613333333335
1421803534.28-1354.28
1523504439.28-2089.28
1624403450.94666666667-1010.94666666667
1723703464.28-1094.28
1824403570.94666666667-1130.94666666667
1926103222.61333333333-612.613333333333
2030403132.61333333333-92.6133333333335
2131902860.94666666667329.053333333333
2231202684.18666666667435.813333333333
2331702900.18666666667269.813333333333
2436003038.18666666667561.813333333334
2534203231.42666666667188.573333333333
2636503598.0933333333351.9066666666666
2741804503.09333333333-323.093333333333
2829603514.76-554.76
2927103528.09333333333-818.093333333333
3029503634.76-684.76
3130303286.42666666667-256.426666666667
3237703196.42666666667573.573333333333
3347402924.761815.24
34445027481702
35555029642586
36558031022478
3758903295.242594.76
3874803661.906666666673818.09333333333
39104504566.906666666675883.09333333333
4063603578.573333333332781.42666666667
4167103591.906666666673118.09333333333
4262003698.573333333332501.42666666667
4344903350.241139.76
4434803260.24219.76
4525202988.57333333333-468.573333333333
4619202811.81333333333-891.813333333333
4720103027.81333333333-1017.81333333333
4819503165.81333333333-1215.81333333333
4922403359.05333333333-1119.05333333333
5023703725.72-1355.72
5128404630.72-1790.72
5227003642.38666666667-942.386666666667
5329803655.72-675.72
5432903762.38666666667-472.386666666666
5533003414.05333333333-114.053333333333
5630003324.05333333333-324.053333333333
5723303052.38666666667-722.386666666667
5821902875.62666666667-685.626666666666
5919703091.62666666667-1121.62666666667
6021703229.62666666667-1059.62666666667
6128303422.86666666667-592.866666666667
6231903789.53333333333-599.533333333333
6335504694.53333333333-1144.53333333333
6432403706.2-466.2
6534503719.53333333333-269.533333333333
6635703826.2-256.2
6732303477.86666666667-247.866666666666
6832603387.86666666667-127.866666666666
6927003116.2-416.2

\begin{tabular}{lllllllll}
\hline
Multiple Linear Regression - Actuals, Interpolation, and Residuals \tabularnewline
Time or Index & Actuals & InterpolationForecast & ResidualsPrediction Error \tabularnewline
1 & 3010 & 3103.8 & -93.7999999999977 \tabularnewline
2 & 2910 & 3470.46666666667 & -560.466666666666 \tabularnewline
3 & 3840 & 4375.46666666667 & -535.466666666666 \tabularnewline
4 & 3580 & 3387.13333333333 & 192.866666666667 \tabularnewline
5 & 3140 & 3400.46666666667 & -260.466666666667 \tabularnewline
6 & 3550 & 3507.13333333333 & 42.8666666666662 \tabularnewline
7 & 3250 & 3158.8 & 91.1999999999998 \tabularnewline
8 & 2820 & 3068.8 & -248.8 \tabularnewline
9 & 2260 & 2797.13333333333 & -537.133333333333 \tabularnewline
10 & 2060 & 2620.37333333333 & -560.373333333333 \tabularnewline
11 & 2120 & 2836.37333333333 & -716.373333333333 \tabularnewline
12 & 2210 & 2974.37333333333 & -764.373333333333 \tabularnewline
13 & 2190 & 3167.61333333333 & -977.613333333335 \tabularnewline
14 & 2180 & 3534.28 & -1354.28 \tabularnewline
15 & 2350 & 4439.28 & -2089.28 \tabularnewline
16 & 2440 & 3450.94666666667 & -1010.94666666667 \tabularnewline
17 & 2370 & 3464.28 & -1094.28 \tabularnewline
18 & 2440 & 3570.94666666667 & -1130.94666666667 \tabularnewline
19 & 2610 & 3222.61333333333 & -612.613333333333 \tabularnewline
20 & 3040 & 3132.61333333333 & -92.6133333333335 \tabularnewline
21 & 3190 & 2860.94666666667 & 329.053333333333 \tabularnewline
22 & 3120 & 2684.18666666667 & 435.813333333333 \tabularnewline
23 & 3170 & 2900.18666666667 & 269.813333333333 \tabularnewline
24 & 3600 & 3038.18666666667 & 561.813333333334 \tabularnewline
25 & 3420 & 3231.42666666667 & 188.573333333333 \tabularnewline
26 & 3650 & 3598.09333333333 & 51.9066666666666 \tabularnewline
27 & 4180 & 4503.09333333333 & -323.093333333333 \tabularnewline
28 & 2960 & 3514.76 & -554.76 \tabularnewline
29 & 2710 & 3528.09333333333 & -818.093333333333 \tabularnewline
30 & 2950 & 3634.76 & -684.76 \tabularnewline
31 & 3030 & 3286.42666666667 & -256.426666666667 \tabularnewline
32 & 3770 & 3196.42666666667 & 573.573333333333 \tabularnewline
33 & 4740 & 2924.76 & 1815.24 \tabularnewline
34 & 4450 & 2748 & 1702 \tabularnewline
35 & 5550 & 2964 & 2586 \tabularnewline
36 & 5580 & 3102 & 2478 \tabularnewline
37 & 5890 & 3295.24 & 2594.76 \tabularnewline
38 & 7480 & 3661.90666666667 & 3818.09333333333 \tabularnewline
39 & 10450 & 4566.90666666667 & 5883.09333333333 \tabularnewline
40 & 6360 & 3578.57333333333 & 2781.42666666667 \tabularnewline
41 & 6710 & 3591.90666666667 & 3118.09333333333 \tabularnewline
42 & 6200 & 3698.57333333333 & 2501.42666666667 \tabularnewline
43 & 4490 & 3350.24 & 1139.76 \tabularnewline
44 & 3480 & 3260.24 & 219.76 \tabularnewline
45 & 2520 & 2988.57333333333 & -468.573333333333 \tabularnewline
46 & 1920 & 2811.81333333333 & -891.813333333333 \tabularnewline
47 & 2010 & 3027.81333333333 & -1017.81333333333 \tabularnewline
48 & 1950 & 3165.81333333333 & -1215.81333333333 \tabularnewline
49 & 2240 & 3359.05333333333 & -1119.05333333333 \tabularnewline
50 & 2370 & 3725.72 & -1355.72 \tabularnewline
51 & 2840 & 4630.72 & -1790.72 \tabularnewline
52 & 2700 & 3642.38666666667 & -942.386666666667 \tabularnewline
53 & 2980 & 3655.72 & -675.72 \tabularnewline
54 & 3290 & 3762.38666666667 & -472.386666666666 \tabularnewline
55 & 3300 & 3414.05333333333 & -114.053333333333 \tabularnewline
56 & 3000 & 3324.05333333333 & -324.053333333333 \tabularnewline
57 & 2330 & 3052.38666666667 & -722.386666666667 \tabularnewline
58 & 2190 & 2875.62666666667 & -685.626666666666 \tabularnewline
59 & 1970 & 3091.62666666667 & -1121.62666666667 \tabularnewline
60 & 2170 & 3229.62666666667 & -1059.62666666667 \tabularnewline
61 & 2830 & 3422.86666666667 & -592.866666666667 \tabularnewline
62 & 3190 & 3789.53333333333 & -599.533333333333 \tabularnewline
63 & 3550 & 4694.53333333333 & -1144.53333333333 \tabularnewline
64 & 3240 & 3706.2 & -466.2 \tabularnewline
65 & 3450 & 3719.53333333333 & -269.533333333333 \tabularnewline
66 & 3570 & 3826.2 & -256.2 \tabularnewline
67 & 3230 & 3477.86666666667 & -247.866666666666 \tabularnewline
68 & 3260 & 3387.86666666667 & -127.866666666666 \tabularnewline
69 & 2700 & 3116.2 & -416.2 \tabularnewline
\hline
\end{tabular}
%Source: https://freestatistics.org/blog/index.php?pk=113692&T=4

[TABLE]
[ROW][C]Multiple Linear Regression - Actuals, Interpolation, and Residuals[/C][/ROW]
[ROW][C]Time or Index[/C][C]Actuals[/C][C]InterpolationForecast[/C][C]ResidualsPrediction Error[/C][/ROW]
[ROW][C]1[/C][C]3010[/C][C]3103.8[/C][C]-93.7999999999977[/C][/ROW]
[ROW][C]2[/C][C]2910[/C][C]3470.46666666667[/C][C]-560.466666666666[/C][/ROW]
[ROW][C]3[/C][C]3840[/C][C]4375.46666666667[/C][C]-535.466666666666[/C][/ROW]
[ROW][C]4[/C][C]3580[/C][C]3387.13333333333[/C][C]192.866666666667[/C][/ROW]
[ROW][C]5[/C][C]3140[/C][C]3400.46666666667[/C][C]-260.466666666667[/C][/ROW]
[ROW][C]6[/C][C]3550[/C][C]3507.13333333333[/C][C]42.8666666666662[/C][/ROW]
[ROW][C]7[/C][C]3250[/C][C]3158.8[/C][C]91.1999999999998[/C][/ROW]
[ROW][C]8[/C][C]2820[/C][C]3068.8[/C][C]-248.8[/C][/ROW]
[ROW][C]9[/C][C]2260[/C][C]2797.13333333333[/C][C]-537.133333333333[/C][/ROW]
[ROW][C]10[/C][C]2060[/C][C]2620.37333333333[/C][C]-560.373333333333[/C][/ROW]
[ROW][C]11[/C][C]2120[/C][C]2836.37333333333[/C][C]-716.373333333333[/C][/ROW]
[ROW][C]12[/C][C]2210[/C][C]2974.37333333333[/C][C]-764.373333333333[/C][/ROW]
[ROW][C]13[/C][C]2190[/C][C]3167.61333333333[/C][C]-977.613333333335[/C][/ROW]
[ROW][C]14[/C][C]2180[/C][C]3534.28[/C][C]-1354.28[/C][/ROW]
[ROW][C]15[/C][C]2350[/C][C]4439.28[/C][C]-2089.28[/C][/ROW]
[ROW][C]16[/C][C]2440[/C][C]3450.94666666667[/C][C]-1010.94666666667[/C][/ROW]
[ROW][C]17[/C][C]2370[/C][C]3464.28[/C][C]-1094.28[/C][/ROW]
[ROW][C]18[/C][C]2440[/C][C]3570.94666666667[/C][C]-1130.94666666667[/C][/ROW]
[ROW][C]19[/C][C]2610[/C][C]3222.61333333333[/C][C]-612.613333333333[/C][/ROW]
[ROW][C]20[/C][C]3040[/C][C]3132.61333333333[/C][C]-92.6133333333335[/C][/ROW]
[ROW][C]21[/C][C]3190[/C][C]2860.94666666667[/C][C]329.053333333333[/C][/ROW]
[ROW][C]22[/C][C]3120[/C][C]2684.18666666667[/C][C]435.813333333333[/C][/ROW]
[ROW][C]23[/C][C]3170[/C][C]2900.18666666667[/C][C]269.813333333333[/C][/ROW]
[ROW][C]24[/C][C]3600[/C][C]3038.18666666667[/C][C]561.813333333334[/C][/ROW]
[ROW][C]25[/C][C]3420[/C][C]3231.42666666667[/C][C]188.573333333333[/C][/ROW]
[ROW][C]26[/C][C]3650[/C][C]3598.09333333333[/C][C]51.9066666666666[/C][/ROW]
[ROW][C]27[/C][C]4180[/C][C]4503.09333333333[/C][C]-323.093333333333[/C][/ROW]
[ROW][C]28[/C][C]2960[/C][C]3514.76[/C][C]-554.76[/C][/ROW]
[ROW][C]29[/C][C]2710[/C][C]3528.09333333333[/C][C]-818.093333333333[/C][/ROW]
[ROW][C]30[/C][C]2950[/C][C]3634.76[/C][C]-684.76[/C][/ROW]
[ROW][C]31[/C][C]3030[/C][C]3286.42666666667[/C][C]-256.426666666667[/C][/ROW]
[ROW][C]32[/C][C]3770[/C][C]3196.42666666667[/C][C]573.573333333333[/C][/ROW]
[ROW][C]33[/C][C]4740[/C][C]2924.76[/C][C]1815.24[/C][/ROW]
[ROW][C]34[/C][C]4450[/C][C]2748[/C][C]1702[/C][/ROW]
[ROW][C]35[/C][C]5550[/C][C]2964[/C][C]2586[/C][/ROW]
[ROW][C]36[/C][C]5580[/C][C]3102[/C][C]2478[/C][/ROW]
[ROW][C]37[/C][C]5890[/C][C]3295.24[/C][C]2594.76[/C][/ROW]
[ROW][C]38[/C][C]7480[/C][C]3661.90666666667[/C][C]3818.09333333333[/C][/ROW]
[ROW][C]39[/C][C]10450[/C][C]4566.90666666667[/C][C]5883.09333333333[/C][/ROW]
[ROW][C]40[/C][C]6360[/C][C]3578.57333333333[/C][C]2781.42666666667[/C][/ROW]
[ROW][C]41[/C][C]6710[/C][C]3591.90666666667[/C][C]3118.09333333333[/C][/ROW]
[ROW][C]42[/C][C]6200[/C][C]3698.57333333333[/C][C]2501.42666666667[/C][/ROW]
[ROW][C]43[/C][C]4490[/C][C]3350.24[/C][C]1139.76[/C][/ROW]
[ROW][C]44[/C][C]3480[/C][C]3260.24[/C][C]219.76[/C][/ROW]
[ROW][C]45[/C][C]2520[/C][C]2988.57333333333[/C][C]-468.573333333333[/C][/ROW]
[ROW][C]46[/C][C]1920[/C][C]2811.81333333333[/C][C]-891.813333333333[/C][/ROW]
[ROW][C]47[/C][C]2010[/C][C]3027.81333333333[/C][C]-1017.81333333333[/C][/ROW]
[ROW][C]48[/C][C]1950[/C][C]3165.81333333333[/C][C]-1215.81333333333[/C][/ROW]
[ROW][C]49[/C][C]2240[/C][C]3359.05333333333[/C][C]-1119.05333333333[/C][/ROW]
[ROW][C]50[/C][C]2370[/C][C]3725.72[/C][C]-1355.72[/C][/ROW]
[ROW][C]51[/C][C]2840[/C][C]4630.72[/C][C]-1790.72[/C][/ROW]
[ROW][C]52[/C][C]2700[/C][C]3642.38666666667[/C][C]-942.386666666667[/C][/ROW]
[ROW][C]53[/C][C]2980[/C][C]3655.72[/C][C]-675.72[/C][/ROW]
[ROW][C]54[/C][C]3290[/C][C]3762.38666666667[/C][C]-472.386666666666[/C][/ROW]
[ROW][C]55[/C][C]3300[/C][C]3414.05333333333[/C][C]-114.053333333333[/C][/ROW]
[ROW][C]56[/C][C]3000[/C][C]3324.05333333333[/C][C]-324.053333333333[/C][/ROW]
[ROW][C]57[/C][C]2330[/C][C]3052.38666666667[/C][C]-722.386666666667[/C][/ROW]
[ROW][C]58[/C][C]2190[/C][C]2875.62666666667[/C][C]-685.626666666666[/C][/ROW]
[ROW][C]59[/C][C]1970[/C][C]3091.62666666667[/C][C]-1121.62666666667[/C][/ROW]
[ROW][C]60[/C][C]2170[/C][C]3229.62666666667[/C][C]-1059.62666666667[/C][/ROW]
[ROW][C]61[/C][C]2830[/C][C]3422.86666666667[/C][C]-592.866666666667[/C][/ROW]
[ROW][C]62[/C][C]3190[/C][C]3789.53333333333[/C][C]-599.533333333333[/C][/ROW]
[ROW][C]63[/C][C]3550[/C][C]4694.53333333333[/C][C]-1144.53333333333[/C][/ROW]
[ROW][C]64[/C][C]3240[/C][C]3706.2[/C][C]-466.2[/C][/ROW]
[ROW][C]65[/C][C]3450[/C][C]3719.53333333333[/C][C]-269.533333333333[/C][/ROW]
[ROW][C]66[/C][C]3570[/C][C]3826.2[/C][C]-256.2[/C][/ROW]
[ROW][C]67[/C][C]3230[/C][C]3477.86666666667[/C][C]-247.866666666666[/C][/ROW]
[ROW][C]68[/C][C]3260[/C][C]3387.86666666667[/C][C]-127.866666666666[/C][/ROW]
[ROW][C]69[/C][C]2700[/C][C]3116.2[/C][C]-416.2[/C][/ROW]
[/TABLE]
Source: https://freestatistics.org/blog/index.php?pk=113692&T=4

Globally Unique Identifier (entire table): ba.freestatistics.org/blog/index.php?pk=113692&T=4

As an alternative you can also use a QR Code:  

The GUIDs for individual cells are displayed in the table below:

Multiple Linear Regression - Actuals, Interpolation, and Residuals
Time or IndexActualsInterpolationForecastResidualsPrediction Error
130103103.8-93.7999999999977
229103470.46666666667-560.466666666666
338404375.46666666667-535.466666666666
435803387.13333333333192.866666666667
531403400.46666666667-260.466666666667
635503507.1333333333342.8666666666662
732503158.891.1999999999998
828203068.8-248.8
922602797.13333333333-537.133333333333
1020602620.37333333333-560.373333333333
1121202836.37333333333-716.373333333333
1222102974.37333333333-764.373333333333
1321903167.61333333333-977.613333333335
1421803534.28-1354.28
1523504439.28-2089.28
1624403450.94666666667-1010.94666666667
1723703464.28-1094.28
1824403570.94666666667-1130.94666666667
1926103222.61333333333-612.613333333333
2030403132.61333333333-92.6133333333335
2131902860.94666666667329.053333333333
2231202684.18666666667435.813333333333
2331702900.18666666667269.813333333333
2436003038.18666666667561.813333333334
2534203231.42666666667188.573333333333
2636503598.0933333333351.9066666666666
2741804503.09333333333-323.093333333333
2829603514.76-554.76
2927103528.09333333333-818.093333333333
3029503634.76-684.76
3130303286.42666666667-256.426666666667
3237703196.42666666667573.573333333333
3347402924.761815.24
34445027481702
35555029642586
36558031022478
3758903295.242594.76
3874803661.906666666673818.09333333333
39104504566.906666666675883.09333333333
4063603578.573333333332781.42666666667
4167103591.906666666673118.09333333333
4262003698.573333333332501.42666666667
4344903350.241139.76
4434803260.24219.76
4525202988.57333333333-468.573333333333
4619202811.81333333333-891.813333333333
4720103027.81333333333-1017.81333333333
4819503165.81333333333-1215.81333333333
4922403359.05333333333-1119.05333333333
5023703725.72-1355.72
5128404630.72-1790.72
5227003642.38666666667-942.386666666667
5329803655.72-675.72
5432903762.38666666667-472.386666666666
5533003414.05333333333-114.053333333333
5630003324.05333333333-324.053333333333
5723303052.38666666667-722.386666666667
5821902875.62666666667-685.626666666666
5919703091.62666666667-1121.62666666667
6021703229.62666666667-1059.62666666667
6128303422.86666666667-592.866666666667
6231903789.53333333333-599.533333333333
6335504694.53333333333-1144.53333333333
6432403706.2-466.2
6534503719.53333333333-269.533333333333
6635703826.2-256.2
6732303477.86666666667-247.866666666666
6832603387.86666666667-127.866666666666
6927003116.2-416.2


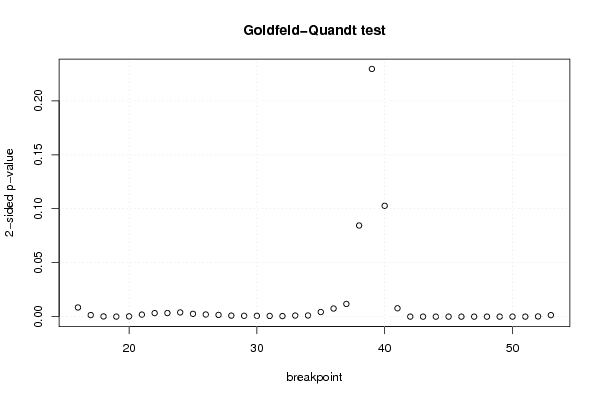
Goldfeld-Quandt test for Heteroskedasticity
p-valuesAlternative Hypothesis
breakpoint indexgreater2-sidedless
160.004258205270033740.008516410540067490.995741794729966
170.0007230015563323370.001446003112664670.999276998443668
189.81203898999334e-050.0001962407797998670.9999018796101
192.3285384769119e-054.6570769538238e-050.99997671461523
200.0001494580958832130.0002989161917664260.999850541904117
210.0009467384195608240.001893476839121650.99905326158044
220.001636303417833970.003272606835667940.998363696582166
230.001673475521074890.003346951042149780.998326524478925
240.001957651301979680.003915302603959360.99804234869802
250.001294047019694170.002588094039388340.998705952980306
260.0009985319938796340.001997063987759270.99900146800612
270.00080050745366120.00160101490732240.999199492546339
280.0004796991868676690.0009593983737353370.999520300813132
290.0003976693804943210.0007953387609886430.999602330619506
300.0003831009302249030.0007662018604498060.999616899069775
310.0003307151325310520.0006614302650621040.999669284867469
320.0002584017794971600.0005168035589943210.999741598220503
330.0005083222580895660.001016644516179130.99949167774191
340.0005536559383040890.001107311876608180.999446344061696
350.002142192189276610.004284384378553220.997857807810723
360.003767690202257830.007535380404515660.996232309797742
370.005885951582417240.01177190316483450.994114048417583
380.04222429503544320.08444859007088640.957775704964557
390.885255784076130.2294884318477410.114744215923871
400.9486542122147830.1026915755704330.0513457877852167
410.9961164520646180.00776709587076410.00388354793538205
420.9999868577915052.62844169905957e-051.31422084952978e-05
430.999999803278893.93442219338656e-071.96721109669328e-07
440.9999999515733419.68533177314686e-084.84266588657343e-08
450.9999999730312055.39375908473542e-082.69687954236771e-08
460.9999998939444212.12111158039641e-071.06055579019821e-07
470.9999998542386712.91522657109543e-071.45761328554772e-07
480.9999993905281281.21894374415350e-066.09471872076751e-07
490.9999966264202316.74715953714051e-063.37357976857026e-06
500.9999930479240231.39041519543918e-056.9520759771959e-06
510.9999829959069723.40081860551024e-051.70040930275512e-05
520.999900311595790.0001993768084196739.96884042098366e-05
530.9993084064967750.001383187006450930.000691593503225466

\begin{tabular}{lllllllll}
\hline
Goldfeld-Quandt test for Heteroskedasticity \tabularnewline
p-values & Alternative Hypothesis \tabularnewline
breakpoint index & greater & 2-sided & less \tabularnewline
16 & 0.00425820527003374 & 0.00851641054006749 & 0.995741794729966 \tabularnewline
17 & 0.000723001556332337 & 0.00144600311266467 & 0.999276998443668 \tabularnewline
18 & 9.81203898999334e-05 & 0.000196240779799867 & 0.9999018796101 \tabularnewline
19 & 2.3285384769119e-05 & 4.6570769538238e-05 & 0.99997671461523 \tabularnewline
20 & 0.000149458095883213 & 0.000298916191766426 & 0.999850541904117 \tabularnewline
21 & 0.000946738419560824 & 0.00189347683912165 & 0.99905326158044 \tabularnewline
22 & 0.00163630341783397 & 0.00327260683566794 & 0.998363696582166 \tabularnewline
23 & 0.00167347552107489 & 0.00334695104214978 & 0.998326524478925 \tabularnewline
24 & 0.00195765130197968 & 0.00391530260395936 & 0.99804234869802 \tabularnewline
25 & 0.00129404701969417 & 0.00258809403938834 & 0.998705952980306 \tabularnewline
26 & 0.000998531993879634 & 0.00199706398775927 & 0.99900146800612 \tabularnewline
27 & 0.0008005074536612 & 0.0016010149073224 & 0.999199492546339 \tabularnewline
28 & 0.000479699186867669 & 0.000959398373735337 & 0.999520300813132 \tabularnewline
29 & 0.000397669380494321 & 0.000795338760988643 & 0.999602330619506 \tabularnewline
30 & 0.000383100930224903 & 0.000766201860449806 & 0.999616899069775 \tabularnewline
31 & 0.000330715132531052 & 0.000661430265062104 & 0.999669284867469 \tabularnewline
32 & 0.000258401779497160 & 0.000516803558994321 & 0.999741598220503 \tabularnewline
33 & 0.000508322258089566 & 0.00101664451617913 & 0.99949167774191 \tabularnewline
34 & 0.000553655938304089 & 0.00110731187660818 & 0.999446344061696 \tabularnewline
35 & 0.00214219218927661 & 0.00428438437855322 & 0.997857807810723 \tabularnewline
36 & 0.00376769020225783 & 0.00753538040451566 & 0.996232309797742 \tabularnewline
37 & 0.00588595158241724 & 0.0117719031648345 & 0.994114048417583 \tabularnewline
38 & 0.0422242950354432 & 0.0844485900708864 & 0.957775704964557 \tabularnewline
39 & 0.88525578407613 & 0.229488431847741 & 0.114744215923871 \tabularnewline
40 & 0.948654212214783 & 0.102691575570433 & 0.0513457877852167 \tabularnewline
41 & 0.996116452064618 & 0.0077670958707641 & 0.00388354793538205 \tabularnewline
42 & 0.999986857791505 & 2.62844169905957e-05 & 1.31422084952978e-05 \tabularnewline
43 & 0.99999980327889 & 3.93442219338656e-07 & 1.96721109669328e-07 \tabularnewline
44 & 0.999999951573341 & 9.68533177314686e-08 & 4.84266588657343e-08 \tabularnewline
45 & 0.999999973031205 & 5.39375908473542e-08 & 2.69687954236771e-08 \tabularnewline
46 & 0.999999893944421 & 2.12111158039641e-07 & 1.06055579019821e-07 \tabularnewline
47 & 0.999999854238671 & 2.91522657109543e-07 & 1.45761328554772e-07 \tabularnewline
48 & 0.999999390528128 & 1.21894374415350e-06 & 6.09471872076751e-07 \tabularnewline
49 & 0.999996626420231 & 6.74715953714051e-06 & 3.37357976857026e-06 \tabularnewline
50 & 0.999993047924023 & 1.39041519543918e-05 & 6.9520759771959e-06 \tabularnewline
51 & 0.999982995906972 & 3.40081860551024e-05 & 1.70040930275512e-05 \tabularnewline
52 & 0.99990031159579 & 0.000199376808419673 & 9.96884042098366e-05 \tabularnewline
53 & 0.999308406496775 & 0.00138318700645093 & 0.000691593503225466 \tabularnewline
\hline
\end{tabular}
%Source: https://freestatistics.org/blog/index.php?pk=113692&T=5

[TABLE]
[ROW][C]Goldfeld-Quandt test for Heteroskedasticity[/C][/ROW]
[ROW][C]p-values[/C][C]Alternative Hypothesis[/C][/ROW]
[ROW][C]breakpoint index[/C][C]greater[/C][C]2-sided[/C][C]less[/C][/ROW]
[ROW][C]16[/C][C]0.00425820527003374[/C][C]0.00851641054006749[/C][C]0.995741794729966[/C][/ROW]
[ROW][C]17[/C][C]0.000723001556332337[/C][C]0.00144600311266467[/C][C]0.999276998443668[/C][/ROW]
[ROW][C]18[/C][C]9.81203898999334e-05[/C][C]0.000196240779799867[/C][C]0.9999018796101[/C][/ROW]
[ROW][C]19[/C][C]2.3285384769119e-05[/C][C]4.6570769538238e-05[/C][C]0.99997671461523[/C][/ROW]
[ROW][C]20[/C][C]0.000149458095883213[/C][C]0.000298916191766426[/C][C]0.999850541904117[/C][/ROW]
[ROW][C]21[/C][C]0.000946738419560824[/C][C]0.00189347683912165[/C][C]0.99905326158044[/C][/ROW]
[ROW][C]22[/C][C]0.00163630341783397[/C][C]0.00327260683566794[/C][C]0.998363696582166[/C][/ROW]
[ROW][C]23[/C][C]0.00167347552107489[/C][C]0.00334695104214978[/C][C]0.998326524478925[/C][/ROW]
[ROW][C]24[/C][C]0.00195765130197968[/C][C]0.00391530260395936[/C][C]0.99804234869802[/C][/ROW]
[ROW][C]25[/C][C]0.00129404701969417[/C][C]0.00258809403938834[/C][C]0.998705952980306[/C][/ROW]
[ROW][C]26[/C][C]0.000998531993879634[/C][C]0.00199706398775927[/C][C]0.99900146800612[/C][/ROW]
[ROW][C]27[/C][C]0.0008005074536612[/C][C]0.0016010149073224[/C][C]0.999199492546339[/C][/ROW]
[ROW][C]28[/C][C]0.000479699186867669[/C][C]0.000959398373735337[/C][C]0.999520300813132[/C][/ROW]
[ROW][C]29[/C][C]0.000397669380494321[/C][C]0.000795338760988643[/C][C]0.999602330619506[/C][/ROW]
[ROW][C]30[/C][C]0.000383100930224903[/C][C]0.000766201860449806[/C][C]0.999616899069775[/C][/ROW]
[ROW][C]31[/C][C]0.000330715132531052[/C][C]0.000661430265062104[/C][C]0.999669284867469[/C][/ROW]
[ROW][C]32[/C][C]0.000258401779497160[/C][C]0.000516803558994321[/C][C]0.999741598220503[/C][/ROW]
[ROW][C]33[/C][C]0.000508322258089566[/C][C]0.00101664451617913[/C][C]0.99949167774191[/C][/ROW]
[ROW][C]34[/C][C]0.000553655938304089[/C][C]0.00110731187660818[/C][C]0.999446344061696[/C][/ROW]
[ROW][C]35[/C][C]0.00214219218927661[/C][C]0.00428438437855322[/C][C]0.997857807810723[/C][/ROW]
[ROW][C]36[/C][C]0.00376769020225783[/C][C]0.00753538040451566[/C][C]0.996232309797742[/C][/ROW]
[ROW][C]37[/C][C]0.00588595158241724[/C][C]0.0117719031648345[/C][C]0.994114048417583[/C][/ROW]
[ROW][C]38[/C][C]0.0422242950354432[/C][C]0.0844485900708864[/C][C]0.957775704964557[/C][/ROW]
[ROW][C]39[/C][C]0.88525578407613[/C][C]0.229488431847741[/C][C]0.114744215923871[/C][/ROW]
[ROW][C]40[/C][C]0.948654212214783[/C][C]0.102691575570433[/C][C]0.0513457877852167[/C][/ROW]
[ROW][C]41[/C][C]0.996116452064618[/C][C]0.0077670958707641[/C][C]0.00388354793538205[/C][/ROW]
[ROW][C]42[/C][C]0.999986857791505[/C][C]2.62844169905957e-05[/C][C]1.31422084952978e-05[/C][/ROW]
[ROW][C]43[/C][C]0.99999980327889[/C][C]3.93442219338656e-07[/C][C]1.96721109669328e-07[/C][/ROW]
[ROW][C]44[/C][C]0.999999951573341[/C][C]9.68533177314686e-08[/C][C]4.84266588657343e-08[/C][/ROW]
[ROW][C]45[/C][C]0.999999973031205[/C][C]5.39375908473542e-08[/C][C]2.69687954236771e-08[/C][/ROW]
[ROW][C]46[/C][C]0.999999893944421[/C][C]2.12111158039641e-07[/C][C]1.06055579019821e-07[/C][/ROW]
[ROW][C]47[/C][C]0.999999854238671[/C][C]2.91522657109543e-07[/C][C]1.45761328554772e-07[/C][/ROW]
[ROW][C]48[/C][C]0.999999390528128[/C][C]1.21894374415350e-06[/C][C]6.09471872076751e-07[/C][/ROW]
[ROW][C]49[/C][C]0.999996626420231[/C][C]6.74715953714051e-06[/C][C]3.37357976857026e-06[/C][/ROW]
[ROW][C]50[/C][C]0.999993047924023[/C][C]1.39041519543918e-05[/C][C]6.9520759771959e-06[/C][/ROW]
[ROW][C]51[/C][C]0.999982995906972[/C][C]3.40081860551024e-05[/C][C]1.70040930275512e-05[/C][/ROW]
[ROW][C]52[/C][C]0.99990031159579[/C][C]0.000199376808419673[/C][C]9.96884042098366e-05[/C][/ROW]
[ROW][C]53[/C][C]0.999308406496775[/C][C]0.00138318700645093[/C][C]0.000691593503225466[/C][/ROW]
[/TABLE]
Source: https://freestatistics.org/blog/index.php?pk=113692&T=5

Globally Unique Identifier (entire table): ba.freestatistics.org/blog/index.php?pk=113692&T=5

As an alternative you can also use a QR Code:  

The GUIDs for individual cells are displayed in the table below:

Goldfeld-Quandt test for Heteroskedasticity
p-valuesAlternative Hypothesis
breakpoint indexgreater2-sidedless
160.004258205270033740.008516410540067490.995741794729966
170.0007230015563323370.001446003112664670.999276998443668
189.81203898999334e-050.0001962407797998670.9999018796101
192.3285384769119e-054.6570769538238e-050.99997671461523
200.0001494580958832130.0002989161917664260.999850541904117
210.0009467384195608240.001893476839121650.99905326158044
220.001636303417833970.003272606835667940.998363696582166
230.001673475521074890.003346951042149780.998326524478925
240.001957651301979680.003915302603959360.99804234869802
250.001294047019694170.002588094039388340.998705952980306
260.0009985319938796340.001997063987759270.99900146800612
270.00080050745366120.00160101490732240.999199492546339
280.0004796991868676690.0009593983737353370.999520300813132
290.0003976693804943210.0007953387609886430.999602330619506
300.0003831009302249030.0007662018604498060.999616899069775
310.0003307151325310520.0006614302650621040.999669284867469
320.0002584017794971600.0005168035589943210.999741598220503
330.0005083222580895660.001016644516179130.99949167774191
340.0005536559383040890.001107311876608180.999446344061696
350.002142192189276610.004284384378553220.997857807810723
360.003767690202257830.007535380404515660.996232309797742
370.005885951582417240.01177190316483450.994114048417583
380.04222429503544320.08444859007088640.957775704964557
390.885255784076130.2294884318477410.114744215923871
400.9486542122147830.1026915755704330.0513457877852167
410.9961164520646180.00776709587076410.00388354793538205
420.9999868577915052.62844169905957e-051.31422084952978e-05
430.999999803278893.93442219338656e-071.96721109669328e-07
440.9999999515733419.68533177314686e-084.84266588657343e-08
450.9999999730312055.39375908473542e-082.69687954236771e-08
460.9999998939444212.12111158039641e-071.06055579019821e-07
470.9999998542386712.91522657109543e-071.45761328554772e-07
480.9999993905281281.21894374415350e-066.09471872076751e-07
490.9999966264202316.74715953714051e-063.37357976857026e-06
500.9999930479240231.39041519543918e-056.9520759771959e-06
510.9999829959069723.40081860551024e-051.70040930275512e-05
520.999900311595790.0001993768084196739.96884042098366e-05
530.9993084064967750.001383187006450930.000691593503225466


Meta Analysis of Goldfeld-Quandt test for Heteroskedasticity
Description# significant tests% significant testsOK/NOK
1% type I error level340.894736842105263NOK
5% type I error level350.921052631578947NOK
10% type I error level360.947368421052632NOK

\begin{tabular}{lllllllll}
\hline
Meta Analysis of Goldfeld-Quandt test for Heteroskedasticity \tabularnewline
Description & # significant tests & % significant tests & OK/NOK \tabularnewline
1% type I error level & 34 & 0.894736842105263 & NOK \tabularnewline
5% type I error level & 35 & 0.921052631578947 & NOK \tabularnewline
10% type I error level & 36 & 0.947368421052632 & NOK \tabularnewline
\hline
\end{tabular}
%Source: https://freestatistics.org/blog/index.php?pk=113692&T=6

[TABLE]
[ROW][C]Meta Analysis of Goldfeld-Quandt test for Heteroskedasticity[/C][/ROW]
[ROW][C]Description[/C][C]# significant tests[/C][C]% significant tests[/C][C]OK/NOK[/C][/ROW]
[ROW][C]1% type I error level[/C][C]34[/C][C]0.894736842105263[/C][C]NOK[/C][/ROW]
[ROW][C]5% type I error level[/C][C]35[/C][C]0.921052631578947[/C][C]NOK[/C][/ROW]
[ROW][C]10% type I error level[/C][C]36[/C][C]0.947368421052632[/C][C]NOK[/C][/ROW]
[/TABLE]
Source: https://freestatistics.org/blog/index.php?pk=113692&T=6

Globally Unique Identifier (entire table): ba.freestatistics.org/blog/index.php?pk=113692&T=6

As an alternative you can also use a QR Code:  

The GUIDs for individual cells are displayed in the table below:

Meta Analysis of Goldfeld-Quandt test for Heteroskedasticity
Description# significant tests% significant testsOK/NOK
1% type I error level340.894736842105263NOK
5% type I error level350.921052631578947NOK
10% type I error level360.947368421052632NOK


Parameters (Session):
par1 = 1 ; par2 = Include Monthly Dummies ; par3 = Linear Trend ;
Parameters (R input):
par1 = 1 ; par2 = Include Monthly Dummies ; par3 = Linear Trend ;
R code (references can be found in the software module):
library(lattice)
library(lmtest)
n25 <- 25 #minimum number of obs. for Goldfeld-Quandt test
par1 <- as.numeric(par1)
x <- t(y)
k <- length(x[1,])
n <- length(x[,1])
x1 <- cbind(x[,par1], x[,1:k!=par1])
mycolnames <- c(colnames(x)[par1], colnames(x)[1:k!=par1])
colnames(x1) <- mycolnames #colnames(x)[par1]
x <- x1
if (par3 == 'First Differences'){
x2 <- array(0, dim=c(n-1,k), dimnames=list(1:(n-1), paste('(1-B)',colnames(x),sep='')))
for (i in 1:n-1) {
for (j in 1:k) {
x2[i,j] <- x[i+1,j] - x[i,j]
}
}
x <- x2
}
if (par2 == 'Include Monthly Dummies'){
x2 <- array(0, dim=c(n,11), dimnames=list(1:n, paste('M', seq(1:11), sep ='')))
for (i in 1:11){
x2[seq(i,n,12),i] <- 1
}
x <- cbind(x, x2)
}
if (par2 == 'Include Quarterly Dummies'){
x2 <- array(0, dim=c(n,3), dimnames=list(1:n, paste('Q', seq(1:3), sep ='')))
for (i in 1:3){
x2[seq(i,n,4),i] <- 1
}
x <- cbind(x, x2)
}
k <- length(x[1,])
if (par3 == 'Linear Trend'){
x <- cbind(x, c(1:n))
colnames(x)[k+1] <- 't'
}
x
k <- length(x[1,])
df <- as.data.frame(x)
(mylm <- lm(df))
(mysum <- summary(mylm))
if (n > n25) {
kp3 <- k + 3
nmkm3 <- n - k - 3
gqarr <- array(NA, dim=c(nmkm3-kp3+1,3))
numgqtests <- 0
numsignificant1 <- 0
numsignificant5 <- 0
numsignificant10 <- 0
for (mypoint in kp3:nmkm3) {
j <- 0
numgqtests <- numgqtests + 1
for (myalt in c('greater', 'two.sided', 'less')) {
j <- j + 1
gqarr[mypoint-kp3+1,j] <- gqtest(mylm, point=mypoint, alternative=myalt)$p.value
}
if (gqarr[mypoint-kp3+1,2] < 0.01) numsignificant1 <- numsignificant1 + 1
if (gqarr[mypoint-kp3+1,2] < 0.05) numsignificant5 <- numsignificant5 + 1
if (gqarr[mypoint-kp3+1,2] < 0.10) numsignificant10 <- numsignificant10 + 1
}
gqarr
}
bitmap(file='test0.png')
plot(x[,1], type='l', main='Actuals and Interpolation', ylab='value of Actuals and Interpolation (dots)', xlab='time or index')
points(x[,1]-mysum$resid)
grid()
dev.off()
bitmap(file='test1.png')
plot(mysum$resid, type='b', pch=19, main='Residuals', ylab='value of Residuals', xlab='time or index')
grid()
dev.off()
bitmap(file='test2.png')
hist(mysum$resid, main='Residual Histogram', xlab='values of Residuals')
grid()
dev.off()
bitmap(file='test3.png')
densityplot(~mysum$resid,col='black',main='Residual Density Plot', xlab='values of Residuals')
dev.off()
bitmap(file='test4.png')
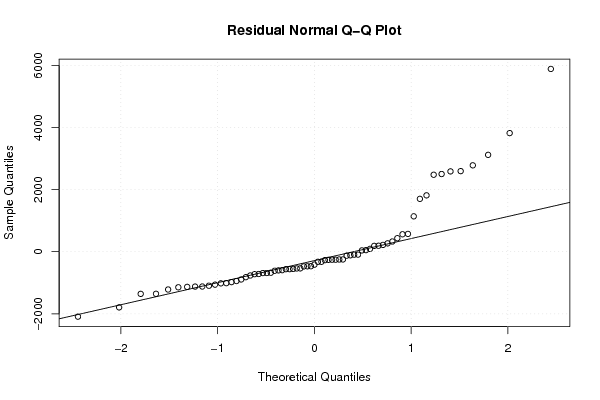
qqnorm(mysum$resid, main='Residual Normal Q-Q Plot')
qqline(mysum$resid)
grid()
dev.off()
(myerror <- as.ts(mysum$resid))
bitmap(file='test5.png')
dum <- cbind(lag(myerror,k=1),myerror)
dum
dum1 <- dum[2:length(myerror),]
dum1
z <- as.data.frame(dum1)
z
plot(z,main=paste('Residual Lag plot, lowess, and regression line'), ylab='values of Residuals', xlab='lagged values of Residuals')
lines(lowess(z))
abline(lm(z))
grid()
dev.off()
bitmap(file='test6.png')
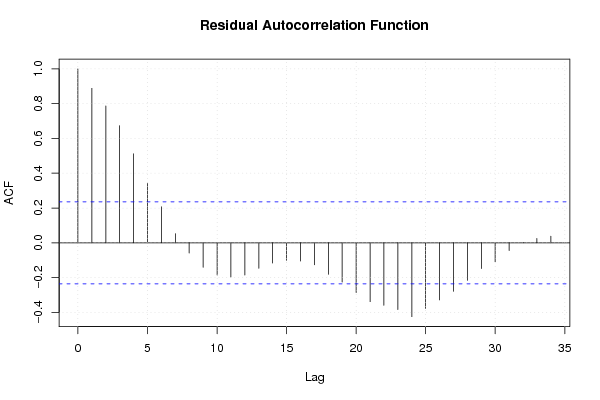
acf(mysum$resid, lag.max=length(mysum$resid)/2, main='Residual Autocorrelation Function')
grid()
dev.off()
bitmap(file='test7.png')
pacf(mysum$resid, lag.max=length(mysum$resid)/2, main='Residual Partial Autocorrelation Function')
grid()
dev.off()
bitmap(file='test8.png')
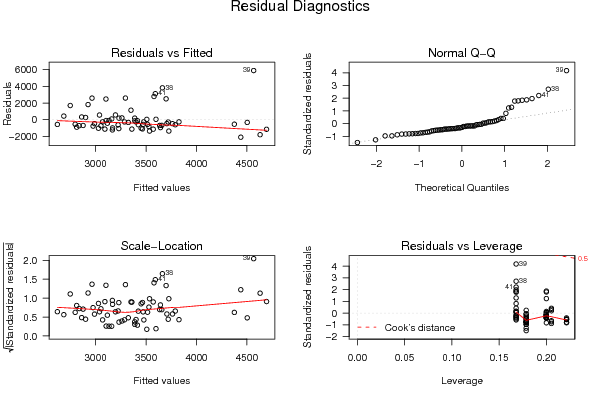
opar <- par(mfrow = c(2,2), oma = c(0, 0, 1.1, 0))
plot(mylm, las = 1, sub='Residual Diagnostics')
par(opar)
dev.off()
if (n > n25) {
bitmap(file='test9.png')
plot(kp3:nmkm3,gqarr[,2], main='Goldfeld-Quandt test',ylab='2-sided p-value',xlab='breakpoint')
grid()
dev.off()
}
load(file='createtable')
a<-table.start()
a<-table.row.start(a)
a<-table.element(a, 'Multiple Linear Regression - Estimated Regression Equation', 1, TRUE)
a<-table.row.end(a)
myeq <- colnames(x)[1]
myeq <- paste(myeq, '[t] = ', sep='')
for (i in 1:k){
if (mysum$coefficients[i,1] > 0) myeq <- paste(myeq, '+', '')
myeq <- paste(myeq, mysum$coefficients[i,1], sep=' ')
if (rownames(mysum$coefficients)[i] != '(Intercept)') {
myeq <- paste(myeq, rownames(mysum$coefficients)[i], sep='')
if (rownames(mysum$coefficients)[i] != 't') myeq <- paste(myeq, '[t]', sep='')
}
}
myeq <- paste(myeq, ' + e[t]')
a<-table.row.start(a)
a<-table.element(a, myeq)
a<-table.row.end(a)
a<-table.end(a)
table.save(a,file='mytable1.tab')
a<-table.start()
a<-table.row.start(a)
a<-table.element(a,hyperlink('ols1.htm','Multiple Linear Regression - Ordinary Least Squares',''), 6, TRUE)
a<-table.row.end(a)
a<-table.row.start(a)
a<-table.element(a,'Variable',header=TRUE)
a<-table.element(a,'Parameter',header=TRUE)
a<-table.element(a,'S.D.',header=TRUE)
a<-table.element(a,'T-STAT
H0: parameter = 0',header=TRUE)
a<-table.element(a,'2-tail p-value',header=TRUE)
a<-table.element(a,'1-tail p-value',header=TRUE)
a<-table.row.end(a)
for (i in 1:k){
a<-table.row.start(a)
a<-table.element(a,rownames(mysum$coefficients)[i],header=TRUE)
a<-table.element(a,mysum$coefficients[i,1])
a<-table.element(a, round(mysum$coefficients[i,2],6))
a<-table.element(a, round(mysum$coefficients[i,3],4))
a<-table.element(a, round(mysum$coefficients[i,4],6))
a<-table.element(a, round(mysum$coefficients[i,4]/2,6))
a<-table.row.end(a)
}
a<-table.end(a)
table.save(a,file='mytable2.tab')
a<-table.start()
a<-table.row.start(a)
a<-table.element(a, 'Multiple Linear Regression - Regression Statistics', 2, TRUE)
a<-table.row.end(a)
a<-table.row.start(a)
a<-table.element(a, 'Multiple R',1,TRUE)
a<-table.element(a, sqrt(mysum$r.squared))
a<-table.row.end(a)
a<-table.row.start(a)
a<-table.element(a, 'R-squared',1,TRUE)
a<-table.element(a, mysum$r.squared)
a<-table.row.end(a)
a<-table.row.start(a)
a<-table.element(a, 'Adjusted R-squared',1,TRUE)
a<-table.element(a, mysum$adj.r.squared)
a<-table.row.end(a)
a<-table.row.start(a)
a<-table.element(a, 'F-TEST (value)',1,TRUE)
a<-table.element(a, mysum$fstatistic[1])
a<-table.row.end(a)
a<-table.row.start(a)
a<-table.element(a, 'F-TEST (DF numerator)',1,TRUE)
a<-table.element(a, mysum$fstatistic[2])
a<-table.row.end(a)
a<-table.row.start(a)
a<-table.element(a, 'F-TEST (DF denominator)',1,TRUE)
a<-table.element(a, mysum$fstatistic[3])
a<-table.row.end(a)
a<-table.row.start(a)
a<-table.element(a, 'p-value',1,TRUE)
a<-table.element(a, 1-pf(mysum$fstatistic[1],mysum$fstatistic[2],mysum$fstatistic[3]))
a<-table.row.end(a)
a<-table.row.start(a)
a<-table.element(a, 'Multiple Linear Regression - Residual Statistics', 2, TRUE)
a<-table.row.end(a)
a<-table.row.start(a)
a<-table.element(a, 'Residual Standard Deviation',1,TRUE)
a<-table.element(a, mysum$sigma)
a<-table.row.end(a)
a<-table.row.start(a)
a<-table.element(a, 'Sum Squared Residuals',1,TRUE)
a<-table.element(a, sum(myerror*myerror))
a<-table.row.end(a)
a<-table.end(a)
table.save(a,file='mytable3.tab')
a<-table.start()
a<-table.row.start(a)
a<-table.element(a, 'Multiple Linear Regression - Actuals, Interpolation, and Residuals', 4, TRUE)
a<-table.row.end(a)
a<-table.row.start(a)
a<-table.element(a, 'Time or Index', 1, TRUE)
a<-table.element(a, 'Actuals', 1, TRUE)
a<-table.element(a, 'Interpolation
Forecast', 1, TRUE)
a<-table.element(a, 'Residuals
Prediction Error', 1, TRUE)
a<-table.row.end(a)
for (i in 1:n) {
a<-table.row.start(a)
a<-table.element(a,i, 1, TRUE)
a<-table.element(a,x[i])
a<-table.element(a,x[i]-mysum$resid[i])
a<-table.element(a,mysum$resid[i])
a<-table.row.end(a)
}
a<-table.end(a)
table.save(a,file='mytable4.tab')
if (n > n25) {
a<-table.start()
a<-table.row.start(a)
a<-table.element(a,'Goldfeld-Quandt test for Heteroskedasticity',4,TRUE)
a<-table.row.end(a)
a<-table.row.start(a)
a<-table.element(a,'p-values',header=TRUE)
a<-table.element(a,'Alternative Hypothesis',3,header=TRUE)
a<-table.row.end(a)
a<-table.row.start(a)
a<-table.element(a,'breakpoint index',header=TRUE)
a<-table.element(a,'greater',header=TRUE)
a<-table.element(a,'2-sided',header=TRUE)
a<-table.element(a,'less',header=TRUE)
a<-table.row.end(a)
for (mypoint in kp3:nmkm3) {
a<-table.row.start(a)
a<-table.element(a,mypoint,header=TRUE)
a<-table.element(a,gqarr[mypoint-kp3+1,1])
a<-table.element(a,gqarr[mypoint-kp3+1,2])
a<-table.element(a,gqarr[mypoint-kp3+1,3])
a<-table.row.end(a)
}
a<-table.end(a)
table.save(a,file='mytable5.tab')
a<-table.start()
a<-table.row.start(a)
a<-table.element(a,'Meta Analysis of Goldfeld-Quandt test for Heteroskedasticity',4,TRUE)
a<-table.row.end(a)
a<-table.row.start(a)
a<-table.element(a,'Description',header=TRUE)
a<-table.element(a,'# significant tests',header=TRUE)
a<-table.element(a,'% significant tests',header=TRUE)
a<-table.element(a,'OK/NOK',header=TRUE)
a<-table.row.end(a)
a<-table.row.start(a)
a<-table.element(a,'1% type I error level',header=TRUE)
a<-table.element(a,numsignificant1)
a<-table.element(a,numsignificant1/numgqtests)
if (numsignificant1/numgqtests < 0.01) dum <- 'OK' else dum <- 'NOK'
a<-table.element(a,dum)
a<-table.row.end(a)
a<-table.row.start(a)
a<-table.element(a,'5% type I error level',header=TRUE)
a<-table.element(a,numsignificant5)
a<-table.element(a,numsignificant5/numgqtests)
if (numsignificant5/numgqtests < 0.05) dum <- 'OK' else dum <- 'NOK'
a<-table.element(a,dum)
a<-table.row.end(a)
a<-table.row.start(a)
a<-table.element(a,'10% type I error level',header=TRUE)
a<-table.element(a,numsignificant10)
a<-table.element(a,numsignificant10/numgqtests)
if (numsignificant10/numgqtests < 0.1) dum <- 'OK' else dum <- 'NOK'
a<-table.element(a,dum)
a<-table.row.end(a)
a<-table.end(a)
table.save(a,file='mytable6.tab')
}