Free Statistics
of Irreproducible Research!
Description of Statistical Computation | |||||||||||||||||||||||||||||||||||||||||
|---|---|---|---|---|---|---|---|---|---|---|---|---|---|---|---|---|---|---|---|---|---|---|---|---|---|---|---|---|---|---|---|---|---|---|---|---|---|---|---|---|---|
| Author's title | |||||||||||||||||||||||||||||||||||||||||
| Author | *Unverified author* | ||||||||||||||||||||||||||||||||||||||||
| R Software Module | rwasp_univariatedataseries.wasp | ||||||||||||||||||||||||||||||||||||||||
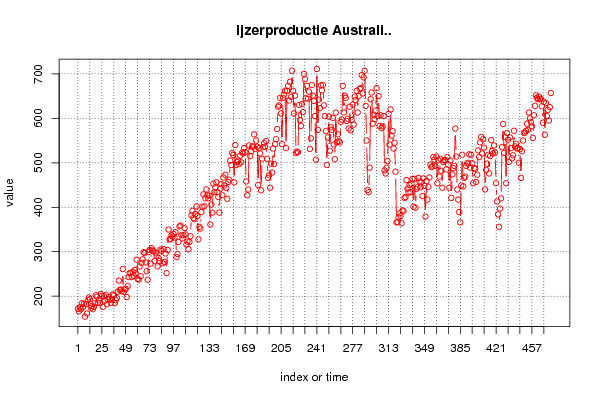
| Title produced by software | Univariate Data Series | ||||||||||||||||||||||||||||||||||||||||
| Date of computation | Fri, 11 Feb 2011 13:54:56 +0000 | ||||||||||||||||||||||||||||||||||||||||
| Cite this page as follows | Statistical Computations at FreeStatistics.org, Office for Research Development and Education, URL https://freestatistics.org/blog/index.php?v=date/2011/Feb/11/t12974328354cztd90i9qwvcey.htm/, Retrieved Wed, 15 May 2024 20:28:27 +0000 | ||||||||||||||||||||||||||||||||||||||||
| Statistical Computations at FreeStatistics.org, Office for Research Development and Education, URL https://freestatistics.org/blog/index.php?pk=118166, Retrieved Wed, 15 May 2024 20:28:27 +0000 | |||||||||||||||||||||||||||||||||||||||||
| QR Codes: | |||||||||||||||||||||||||||||||||||||||||
|
| |||||||||||||||||||||||||||||||||||||||||
| Original text written by user: | |||||||||||||||||||||||||||||||||||||||||
| IsPrivate? | No (this computation is public) | ||||||||||||||||||||||||||||||||||||||||
| User-defined keywords | |||||||||||||||||||||||||||||||||||||||||
| Estimated Impact | 247 | ||||||||||||||||||||||||||||||||||||||||
Tree of Dependent Computations | |||||||||||||||||||||||||||||||||||||||||
| Family? (F = Feedback message, R = changed R code, M = changed R Module, P = changed Parameters, D = changed Data) | |||||||||||||||||||||||||||||||||||||||||
| - [Univariate Data Series] [Cijfergegevens ij...] [2011-02-11 13:54:56] [5694cbfe7be00e9a7fc92bab13fedea1] [Current] - PD [Univariate Data Series] [Studio 100: Maxim...] [2011-04-14 14:27:52] [deafff8e312bf6ac66eadc591aad6633] - RMPD [Histogram] [Maximumprijs 2005...] [2011-04-14 14:37:04] [deafff8e312bf6ac66eadc591aad6633] - RMPD [Kernel Density Estimation] [Dichtheidsgrafiek...] [2011-04-14 15:04:06] [deafff8e312bf6ac66eadc591aad6633] | |||||||||||||||||||||||||||||||||||||||||
| Feedback Forum | |||||||||||||||||||||||||||||||||||||||||
Post a new message | |||||||||||||||||||||||||||||||||||||||||
Dataset | |||||||||||||||||||||||||||||||||||||||||
| Dataseries X: | |||||||||||||||||||||||||||||||||||||||||
172 166 175 171 184 175 183 154 182 161 191 197 193 174 178 171 176 184 202 199 185 191 185 205 201 176 200 190 203 182 193 198 193 185 192 204 202 184 191 196 210 235 214 215 211 261 210 216 216 198 223 243 252 252 243 255 246 259 252 282 239 237 267 245 275 283 299 297 276 256 237 299 304 273 308 303 301 279 298 291 267 286 279 305 302 274 306 277 296 252 304 350 328 328 337 334 340 332 344 288 295 322 357 359 337 330 337 353 339 316 323 306 322 335 382 392 376 373 385 402 380 328 356 352 389 401 429 402 420 440 427 420 426 361 406 388 453 434 445 456 434 423 388 442 452 427 467 449 473 443 419 457 462 505 495 522 518 456 540 495 502 505 497 516 501 523 521 533 524 458 427 440 539 515 526 536 537 564 531 550 536 450 533 521 438 509 535 544 536 549 509 466 472 444 498 478 532 497 542 553 576 626 629 646 611 542 646 653 662 533 662 673 640 682 648 707 662 611 651 522 525 524 630 596 583 632 614 700 688 645 673 644 660 531 555 675 651 639 605 507 711 574 642 623 674 663 675 629 605 571 495 557 604 527 580 574 601 541 508 613 546 564 549 546 592 597 673 613 651 646 594 599 577 626 573 596 631 586 649 641 662 613 650 666 668 697 656 692 707 628 550 439 434 489 643 658 588 608 598 617 668 605 650 583 607 578 582 605 483 476 489 504 610 541 620 561 571 532 545 480 366 367 377 386 380 364 393 391 421 423 461 442 433 450 434 453 464 401 464 399 441 445 466 458 445 456 425 465 448 379 459 417 446 467 496 490 492 513 507 493 514 454 506 469 509 482 444 502 505 506 485 513 496 444 505 421 474 488 493 577 514 440 417 389 366 449 518 447 466 469 493 498 500 519 489 518 499 454 488 486 457 473 528 513 546 558 521 553 534 440 484 498 518 476 515 551 526 521 539 523 454 413 384 356 397 420 535 587 522 558 454 567 552 502 557 533 510 517 572 537 543 532 533 500 531 466 526 550 567 568 572 588 574 613 600 591 582 556 607 628 652 646 643 649 643 644 627 590 637 563 634 605 619 595 625 657 | |||||||||||||||||||||||||||||||||||||||||
Tables (Output of Computation) | |||||||||||||||||||||||||||||||||||||||||
| |||||||||||||||||||||||||||||||||||||||||
Figures (Output of Computation) | |||||||||||||||||||||||||||||||||||||||||
Input Parameters & R Code | |||||||||||||||||||||||||||||||||||||||||
| Parameters (Session): | |||||||||||||||||||||||||||||||||||||||||
| par1 = Ijzerproductie Australië ; par2 = http://robjhyndman.com/tsdldata/data/basiron.dat ; par3 = productie van Ijzer ; par4 = 12 ; | |||||||||||||||||||||||||||||||||||||||||
| Parameters (R input): | |||||||||||||||||||||||||||||||||||||||||
| par1 = Ijzerproductie Australië ; par2 = http://robjhyndman.com/tsdldata/data/basiron.dat ; par3 = productie van Ijzer ; par4 = 12 ; | |||||||||||||||||||||||||||||||||||||||||
| R code (references can be found in the software module): | |||||||||||||||||||||||||||||||||||||||||
if (par4 != 'No season') { | |||||||||||||||||||||||||||||||||||||||||