Free Statistics
of Irreproducible Research!
Description of Statistical Computation | |||||||||||||||||||||||||||||||||||||||||
|---|---|---|---|---|---|---|---|---|---|---|---|---|---|---|---|---|---|---|---|---|---|---|---|---|---|---|---|---|---|---|---|---|---|---|---|---|---|---|---|---|---|
| Author's title | |||||||||||||||||||||||||||||||||||||||||
| Author | *Unverified author* | ||||||||||||||||||||||||||||||||||||||||
| R Software Module | rwasp_univariatedataseries.wasp | ||||||||||||||||||||||||||||||||||||||||
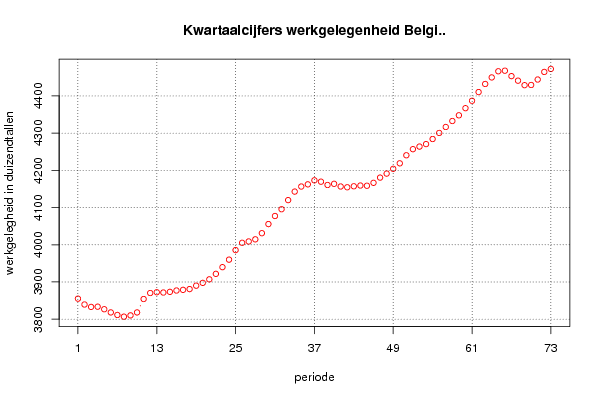
| Title produced by software | Univariate Data Series | ||||||||||||||||||||||||||||||||||||||||
| Date of computation | Tue, 15 Feb 2011 12:51:09 +0000 | ||||||||||||||||||||||||||||||||||||||||
| Cite this page as follows | Statistical Computations at FreeStatistics.org, Office for Research Development and Education, URL https://freestatistics.org/blog/index.php?v=date/2011/Feb/15/t1297776148fmwvizrvihmipyk.htm/, Retrieved Wed, 22 May 2024 05:31:37 +0000 | ||||||||||||||||||||||||||||||||||||||||
| Statistical Computations at FreeStatistics.org, Office for Research Development and Education, URL https://freestatistics.org/blog/index.php?pk=118278, Retrieved Wed, 22 May 2024 05:31:37 +0000 | |||||||||||||||||||||||||||||||||||||||||
| QR Codes: | |||||||||||||||||||||||||||||||||||||||||
|
| |||||||||||||||||||||||||||||||||||||||||
| Original text written by user: | |||||||||||||||||||||||||||||||||||||||||
| IsPrivate? | No (this computation is public) | ||||||||||||||||||||||||||||||||||||||||
| User-defined keywords | KDGP1W1 | ||||||||||||||||||||||||||||||||||||||||
| Estimated Impact | 199 | ||||||||||||||||||||||||||||||||||||||||
Tree of Dependent Computations | |||||||||||||||||||||||||||||||||||||||||
| Family? (F = Feedback message, R = changed R code, M = changed R Module, P = changed Parameters, D = changed Data) | |||||||||||||||||||||||||||||||||||||||||
| - [Univariate Data Series] [Grafiek Opgave 1] [2011-02-15 12:51:09] [bbaa69d6e080be700baadc5575065bc4] [Current] - RMPD [Kernel Density Estimation] [Dichtheidsgrafiek...] [2011-02-22 22:44:20] [46972ec2bfa5b295f8450f947ab1f239] | |||||||||||||||||||||||||||||||||||||||||
| Feedback Forum | |||||||||||||||||||||||||||||||||||||||||
Post a new message | |||||||||||||||||||||||||||||||||||||||||
Dataset | |||||||||||||||||||||||||||||||||||||||||
| Dataseries X: | |||||||||||||||||||||||||||||||||||||||||
3855,10 3839,50 3833,00 3833,60 3826,80 3818,20 3811,40 3806,80 3810,30 3818,20 3854,10 3870,30 3872,50 3871,60 3873,40 3877,00 3878,80 3880,90 3890,00 3897,60 3907,10 3921,80 3939,80 3960,00 3985,70 4005,30 4008,90 4014,60 4031,10 4055,60 4077,30 4095,50 4120,00 4142,90 4156,50 4162,40 4173,20 4169,50 4160,70 4163,80 4156,60 4154,50 4157,20 4159,20 4158,60 4166,50 4180,50 4191,30 4204,10 4218,90 4240,50 4256,90 4263,90 4270,60 4284,20 4300,50 4316,50 4332,60 4347,90 4367,10 4386,90 4410,40 4432,10 4449,70 4466,30 4467,80 4453,20 4441,00 4428,90 4429,40 4444,10 4464,50 4472,50 | |||||||||||||||||||||||||||||||||||||||||
Tables (Output of Computation) | |||||||||||||||||||||||||||||||||||||||||
| |||||||||||||||||||||||||||||||||||||||||
Figures (Output of Computation) | |||||||||||||||||||||||||||||||||||||||||
Input Parameters & R Code | |||||||||||||||||||||||||||||||||||||||||
| Parameters (Session): | |||||||||||||||||||||||||||||||||||||||||
| par1 = wergelegenheid (in duizendtallen) ; par2 = http://www.nbb.be/belgostat/PresentationLinker?TableId=836000071&Lang=N ; par3 = kwartaalgemiddelde van het aantal werknemers en zelfstandigen, seizoengezuiverde gegevens ; par4 = 12 ; | |||||||||||||||||||||||||||||||||||||||||
| Parameters (R input): | |||||||||||||||||||||||||||||||||||||||||
| par1 = wergelegenheid (in duizendtallen) ; par2 = http://www.nbb.be/belgostat/PresentationLinker?TableId=836000071&Lang=N ; par3 = kwartaalgemiddelde van het aantal werknemers en zelfstandigen, seizoengezuiverde gegevens ; par4 = 12 ; | |||||||||||||||||||||||||||||||||||||||||
| R code (references can be found in the software module): | |||||||||||||||||||||||||||||||||||||||||
if (par4 != 'No season') { | |||||||||||||||||||||||||||||||||||||||||