Free Statistics
of Irreproducible Research!
Description of Statistical Computation | |||||||||||||||||||||||||||||||||||||||||
|---|---|---|---|---|---|---|---|---|---|---|---|---|---|---|---|---|---|---|---|---|---|---|---|---|---|---|---|---|---|---|---|---|---|---|---|---|---|---|---|---|---|
| Author's title | |||||||||||||||||||||||||||||||||||||||||
| Author | *Unverified author* | ||||||||||||||||||||||||||||||||||||||||
| R Software Module | rwasp_univariatedataseries.wasp | ||||||||||||||||||||||||||||||||||||||||
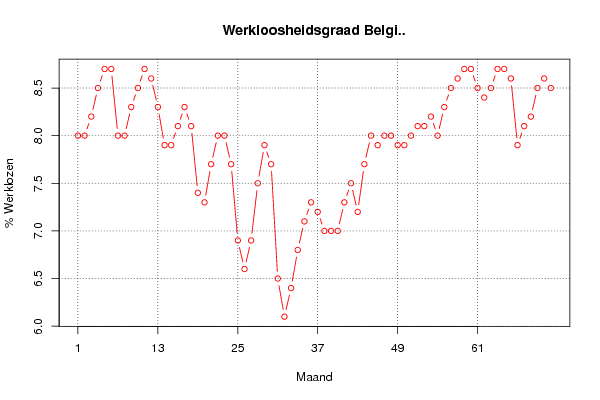
| Title produced by software | Univariate Data Series | ||||||||||||||||||||||||||||||||||||||||
| Date of computation | Tue, 15 Feb 2011 15:03:59 +0000 | ||||||||||||||||||||||||||||||||||||||||
| Cite this page as follows | Statistical Computations at FreeStatistics.org, Office for Research Development and Education, URL https://freestatistics.org/blog/index.php?v=date/2011/Feb/15/t1297782268u55wfm6ffj2nldl.htm/, Retrieved Wed, 22 May 2024 05:34:09 +0000 | ||||||||||||||||||||||||||||||||||||||||
| Statistical Computations at FreeStatistics.org, Office for Research Development and Education, URL https://freestatistics.org/blog/index.php?pk=118295, Retrieved Wed, 22 May 2024 05:34:09 +0000 | |||||||||||||||||||||||||||||||||||||||||
| QR Codes: | |||||||||||||||||||||||||||||||||||||||||
|
| |||||||||||||||||||||||||||||||||||||||||
| Original text written by user: | |||||||||||||||||||||||||||||||||||||||||
| IsPrivate? | No (this computation is public) | ||||||||||||||||||||||||||||||||||||||||
| User-defined keywords | KDGP1W1 | ||||||||||||||||||||||||||||||||||||||||
| Estimated Impact | 181 | ||||||||||||||||||||||||||||||||||||||||
Tree of Dependent Computations | |||||||||||||||||||||||||||||||||||||||||
| Family? (F = Feedback message, R = changed R code, M = changed R Module, P = changed Parameters, D = changed Data) | |||||||||||||||||||||||||||||||||||||||||
| - [Univariate Data Series] [% Werklozen in Be...] [2011-02-15 15:03:59] [a30b982302b331b677541c5a6d9dd4b2] [Current] | |||||||||||||||||||||||||||||||||||||||||
| Feedback Forum | |||||||||||||||||||||||||||||||||||||||||
Post a new message | |||||||||||||||||||||||||||||||||||||||||
Dataset | |||||||||||||||||||||||||||||||||||||||||
| Dataseries X: | |||||||||||||||||||||||||||||||||||||||||
8 8 8.2 8.5 8.7 8.7 8 8 8.3 8.5 8.7 8.6 8.3 7.9 7.9 8.1 8.3 8.1 7.4 7.3 7.7 8 8 7.7 6.9 6.6 6.9 7.5 7.9 7.7 6.5 6.1 6.4 6.8 7.1 7.3 7.2 7 7 7 7.3 7.5 7.2 7.7 8 7.9 8 8 7.9 7.9 8 8.1 8.1 8.2 8 8.3 8.5 8.6 8.7 8.7 8.5 8.4 8.5 8.7 8.7 8.6 7.9 8.1 8.2 8.5 8.6 8.5 | |||||||||||||||||||||||||||||||||||||||||
Tables (Output of Computation) | |||||||||||||||||||||||||||||||||||||||||
| |||||||||||||||||||||||||||||||||||||||||
Figures (Output of Computation) | |||||||||||||||||||||||||||||||||||||||||
Input Parameters & R Code | |||||||||||||||||||||||||||||||||||||||||
| Parameters (Session): | |||||||||||||||||||||||||||||||||||||||||
| par1 = Werkloosheidsgraad België per maand ; par2 = http://www.nbb.be/belgostat/PresentationLinker?TableId=410000092&Lang=N ; par3 = Werkloosheidsgraad van België per maand vanaf 31/1/2005 tot en met 31/12/2010 ; par4 = 12 ; | |||||||||||||||||||||||||||||||||||||||||
| Parameters (R input): | |||||||||||||||||||||||||||||||||||||||||
| par1 = Werkloosheidsgraad België per maand ; par2 = http://www.nbb.be/belgostat/PresentationLinker?TableId=410000092&Lang=N ; par3 = Werkloosheidsgraad van België per maand vanaf 31/1/2005 tot en met 31/12/2010 ; par4 = 12 ; | |||||||||||||||||||||||||||||||||||||||||
| R code (references can be found in the software module): | |||||||||||||||||||||||||||||||||||||||||
if (par4 != 'No season') { | |||||||||||||||||||||||||||||||||||||||||