Free Statistics
of Irreproducible Research!
Description of Statistical Computation | |||||||||||||||||||||||||||||||||||||||||
|---|---|---|---|---|---|---|---|---|---|---|---|---|---|---|---|---|---|---|---|---|---|---|---|---|---|---|---|---|---|---|---|---|---|---|---|---|---|---|---|---|---|
| Author's title | |||||||||||||||||||||||||||||||||||||||||
| Author | *Unverified author* | ||||||||||||||||||||||||||||||||||||||||
| R Software Module | rwasp_univariatedataseries.wasp | ||||||||||||||||||||||||||||||||||||||||
| Title produced by software | Univariate Data Series | ||||||||||||||||||||||||||||||||||||||||
| Date of computation | Tue, 22 Feb 2011 13:53:00 +0000 | ||||||||||||||||||||||||||||||||||||||||
| Cite this page as follows | Statistical Computations at FreeStatistics.org, Office for Research Development and Education, URL https://freestatistics.org/blog/index.php?v=date/2011/Feb/22/t12983826783a3rbfvp1rj7q7r.htm/, Retrieved Fri, 04 Jul 2025 17:02:58 +0000 | ||||||||||||||||||||||||||||||||||||||||
| Statistical Computations at FreeStatistics.org, Office for Research Development and Education, URL https://freestatistics.org/blog/index.php?pk=118783, Retrieved Fri, 04 Jul 2025 17:02:58 +0000 | |||||||||||||||||||||||||||||||||||||||||
| QR Codes: | |||||||||||||||||||||||||||||||||||||||||
|
| |||||||||||||||||||||||||||||||||||||||||
| Original text written by user: | |||||||||||||||||||||||||||||||||||||||||
| IsPrivate? | No (this computation is public) | ||||||||||||||||||||||||||||||||||||||||
| User-defined keywords | KDGP1W21 | ||||||||||||||||||||||||||||||||||||||||
| Estimated Impact | 183 | ||||||||||||||||||||||||||||||||||||||||
Tree of Dependent Computations | |||||||||||||||||||||||||||||||||||||||||
| Family? (F = Feedback message, R = changed R code, M = changed R Module, P = changed Parameters, D = changed Data) | |||||||||||||||||||||||||||||||||||||||||
| - [Univariate Data Series] [opgave2oefening1s...] [2011-02-22 13:53:00] [06ce09a0492afa6d4f67026fd1b7902e] [Current] | |||||||||||||||||||||||||||||||||||||||||
| Feedback Forum | |||||||||||||||||||||||||||||||||||||||||
Post a new message | |||||||||||||||||||||||||||||||||||||||||
Dataset | |||||||||||||||||||||||||||||||||||||||||
| Dataseries X: | |||||||||||||||||||||||||||||||||||||||||
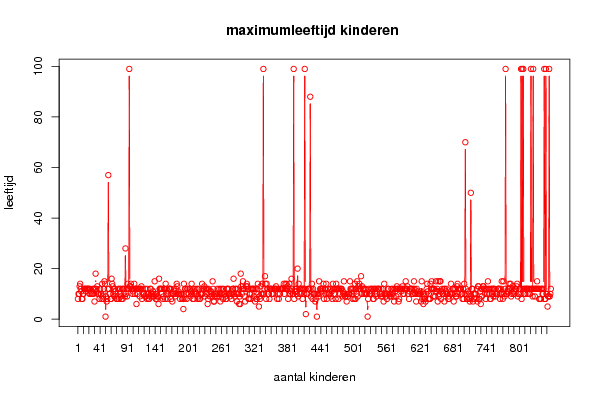
8 10 10 13 14 12 11 8 8 10 10 12 12 12 11 12 12 12 12 12 12 10 12 10 11 10 10 12 10 12 7 12 18 12 11 13 10 10 10 8 12 10 10 8 14 9 8 12 15 14 1 9 7 8 12 57 12 10 10 8 8 16 14 13 10 12 9 12 11 10 8 8 9 12 8 12 10 12 9 8 12 8 12 10 12 9 28 10 12 9 14 12 12 99 13 13 14 12 12 10 11 12 14 10 12 12 6 12 10 12 12 12 9 12 12 13 8 12 10 10 10 9 12 9 10 8 12 10 8 8 9 12 12 10 10 9 11 10 9 15 10 8 10 8 9 9 6 16 12 12 12 12 10 12 8 9 12 12 8 14 10 12 8 11 10 12 12 12 12 8 10 7 10 10 12 11 9 10 12 14 13 10 11 10 10 8 10 10 10 8 8 4 14 8 12 12 10 8 12 12 10 10 12 12 9 11 14 10 8 12 8 10 11 12 10 10 12 8 9 12 8 8 10 10 10 14 10 12 12 13 9 12 12 10 12 6 8 12 10 9 11 11 9 10 15 12 7 7 10 9 10 10 9 12 10 9 12 10 7 12 10 10 12 8 12 10 10 9 8 8 12 12 10 12 10 9 10 10 8 10 12 12 16 10 9 12 12 10 7 12 10 10 6 9 6 18 13 10 12 15 12 12 9 7 12 13 14 13 12 8 8 10 10 8 12 10 12 12 12 9 12 7 12 8 8 12 14 10 5 9 8 13 10 10 14 10 99 10 12 17 14 8 14 12 12 10 10 8 12 12 12 10 12 10 10 12 12 12 12 13 12 8 10 12 8 10 10 12 12 12 12 12 12 14 10 12 14 12 14 12 13 8 12 14 10 10 11 16 12 10 10 99 8 11 12 12 11 10 20 9 14 12 10 12 10 12 12 8 12 12 10 99 12 2 10 10 10 12 12 12 12 88 9 12 14 8 12 10 10 10 7 8 10 1 10 10 9 15 10 12 12 12 11 12 12 14 8 12 12 10 14 8 10 12 10 10 10 12 9 12 11 8 14 12 10 12 10 8 14 12 12 12 8 12 12 10 12 12 12 9 11 10 15 10 9 9 10 7 10 9 10 10 10 15 12 12 10 12 8 12 11 8 14 8 12 10 15 9 13 12 14 12 12 17 10 13 12 12 10 12 10 12 10 10 10 1 8 12 10 10 10 12 12 11 12 8 8 12 12 10 12 9 10 12 12 12 12 10 10 9 12 10 9 12 7 14 10 10 9 10 8 10 12 12 10 9 10 9 12 10 12 10 9 7 12 11 12 9 13 12 12 7 8 12 12 12 11 12 13 10 12 10 12 12 15 12 12 13 10 10 8 11 12 12 12 12 10 10 12 15 12 10 10 7 12 10 11 10 10 10 10 11 7 15 8 10 6 8 9 8 7 10 12 14 11 8 10 8 8 14 12 15 12 12 9 12 12 9 11 15 11 12 7 15 9 10 15 15 8 11 12 10 10 12 7 12 10 11 12 10 10 8 9 8 10 10 14 10 10 12 12 7 12 10 12 9 9 13 14 10 12 12 12 12 12 10 10 8 12 8 14 10 70 12 10 8 8 11 10 8 7 8 50 9 12 12 7 10 8 10 10 10 8 12 7 13 13 8 8 11 6 12 9 12 13 13 12 12 10 8 12 10 10 15 12 10 12 8 8 12 12 10 12 9 12 12 10 9 10 10 10 12 12 12 12 8 10 12 15 10 8 15 10 9 12 99 10 10 11 11 12 12 14 12 14 9 10 12 13 10 11 10 12 12 12 13 14 9 10 10 12 12 10 99 8 99 12 99 12 10 12 10 12 12 12 10 12 12 10 10 12 99 12 12 9 99 12 12 9 12 12 12 15 12 12 12 8 8 12 8 12 12 10 10 12 99 8 8 99 10 10 5 9 9 99 9 10 12 | |||||||||||||||||||||||||||||||||||||||||
Tables (Output of Computation) | |||||||||||||||||||||||||||||||||||||||||
| |||||||||||||||||||||||||||||||||||||||||
Figures (Output of Computation) | |||||||||||||||||||||||||||||||||||||||||
Input Parameters & R Code | |||||||||||||||||||||||||||||||||||||||||
| Parameters (Session): | |||||||||||||||||||||||||||||||||||||||||
| par1 = maximum leeftijd bezoek studio 100 ; par2 = excel bestand ; par3 = deze reeks bevat het antwoord op de vraag wat de maximum leeftijd is van kinderen om naar de Grote Sinterklaasshow te gaan. ; par4 = No season ; | |||||||||||||||||||||||||||||||||||||||||
| Parameters (R input): | |||||||||||||||||||||||||||||||||||||||||
| par1 = maximum leeftijd bezoek studio 100 ; par2 = excel bestand ; par3 = deze reeks bevat het antwoord op de vraag wat de maximum leeftijd is van kinderen om naar de Grote Sinterklaasshow te gaan. ; par4 = No season ; | |||||||||||||||||||||||||||||||||||||||||
| R code (references can be found in the software module): | |||||||||||||||||||||||||||||||||||||||||
if (par4 != 'No season') { | |||||||||||||||||||||||||||||||||||||||||