Free Statistics

of Irreproducible Research!

Author's title

Author*Unverified author*
R Software Modulerwasp_autocorrelation.wasp
Title produced by software(Partial) Autocorrelation Function
Date of computationSun, 10 Jul 2011 08:17:57 -0400
Cite this page as followsStatistical Computations at FreeStatistics.org, Office for Research Development and Education, URL https://freestatistics.org/blog/index.php?v=date/2011/Jul/10/t13103003273da7n4thu4i9xlh.htm/, Retrieved Wed, 15 May 2024 23:05:37 +0000
Statistical Computations at FreeStatistics.org, Office for Research Development and Education, URL https://freestatistics.org/blog/index.php?pk=123026, Retrieved Wed, 15 May 2024 23:05:37 +0000
QR Codes:

Original text written by user:
IsPrivate?No (this computation is public)
User-defined keywordsVan den Buys Daphné
Estimated Impact206
Family? (F = Feedback message, R = changed R code, M = changed R Module, P = changed Parameters, D = changed Data)
-       [(Partial) Autocorrelation Function] [Tijdreeks A-stap 20] [2011-07-10 12:17:57] [d41d8cd98f00b204e9800998ecf8427e] [Current]
Feedback Forum

Post a new message
Dataseries X:
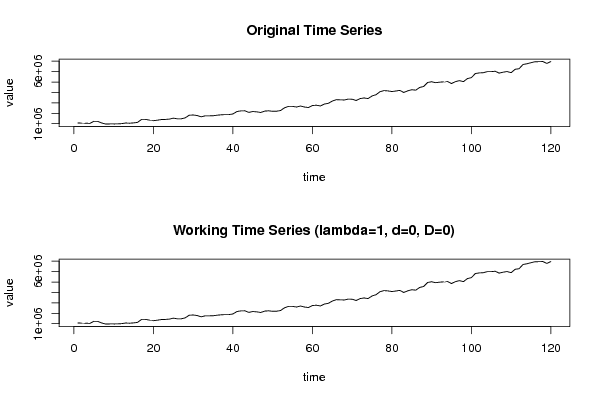
1069108
1059362
1049495
1029082
1231089
1220388
1069108
968521
978233
978233
989056
1008514
1069108
1049495
1079775
1129547
1412683
1412683
1352244
1291650
1341422
1401983
1412683
1442964
1533833
1473244
1473244
1564114
1816014
1836427
1785734
1664578
1755420
1755420
1765165
1816014
1856040
1876453
1876453
1937014
2169452
2229890
2239603
2088322
2169452
2139171
2078582
2209478
2239603
2188909
2199610
2269916
2532640
2663352
2663352
2602913
2693660
2602913
2552092
2744509
2774634
2703378
2884967
2956228
3168103
3308711
3289258
3278430
3359559
3349692
3228692
3410253
3470847
3410253
3662154
3783309
4065362
4176650
4146492
4085897
4136624
4197185
3995056
4156204
4257779
4216798
4479366
4570080
4953837
5024138
4933418
4984117
5014398
5044678
4852261
5033856
5134437
5033856
5326854
5417607
5811037
5871631
5891089
5992631
5992631
6032657
5851063
5941938
6002377
5891089
6214246
6274812
6678021
6749283
6849864
6940739
6950451
6961152
6779563
6961152


Summary of computational transaction
Raw Inputview raw input (R code)
Raw Outputview raw output of R engine
Computing time2 seconds
R Server'Herman Ole Andreas Wold' @ wold.wessa.net

\begin{tabular}{lllllllll}
\hline
Summary of computational transaction \tabularnewline
Raw Input & view raw input (R code)  \tabularnewline
Raw Output & view raw output of R engine  \tabularnewline
Computing time & 2 seconds \tabularnewline
R Server & 'Herman Ole Andreas Wold' @ wold.wessa.net \tabularnewline
\hline
\end{tabular}
%Source: https://freestatistics.org/blog/index.php?pk=123026&T=0

[TABLE]
[ROW][C]Summary of computational transaction[/C][/ROW]
[ROW][C]Raw Input[/C][C]view raw input (R code) [/C][/ROW]
[ROW][C]Raw Output[/C][C]view raw output of R engine [/C][/ROW]
[ROW][C]Computing time[/C][C]2 seconds[/C][/ROW]
[ROW][C]R Server[/C][C]'Herman Ole Andreas Wold' @ wold.wessa.net[/C][/ROW]
[/TABLE]
Source: https://freestatistics.org/blog/index.php?pk=123026&T=0

Globally Unique Identifier (entire table): ba.freestatistics.org/blog/index.php?pk=123026&T=0

As an alternative you can also use a QR Code:  

The GUIDs for individual cells are displayed in the table below:

Summary of computational transaction
Raw Inputview raw input (R code)
Raw Outputview raw output of R engine
Computing time2 seconds
R Server'Herman Ole Andreas Wold' @ wold.wessa.net


Autocorrelation Function
Time lag kACF(k)T-STATP-value
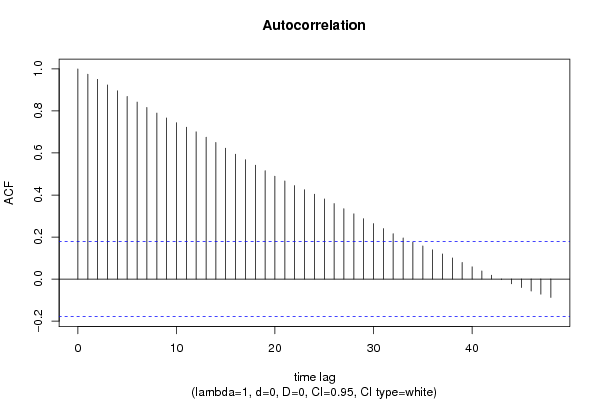
10.97471910.67750
20.95039510.41110
30.92351610.11660
40.8958759.81380
50.8690729.52020
60.8423119.22710
70.8164468.94370
80.78988.65180
90.7667178.3990
100.7435868.14560
110.7229077.9190
120.7006377.67510
130.6751797.39620
140.6498337.11860
150.6222466.81640
160.5944656.5120
170.5678056.220
180.5415115.9320
190.5156225.64840
200.4892585.35960
210.4665475.11081e-06
220.4446294.87072e-06
230.4250494.65624e-06
240.4040814.42651.1e-05
250.3812884.17682.8e-05
260.3591693.93457e-05
270.3347323.66680.000184
280.3102513.39860.00046
290.2869823.14370.001051
300.2639372.89130.002278
310.2401662.63090.004817
320.2159112.36520.009812
330.1953362.13980.017198
340.1754081.92150.02852
350.1575811.72620.043441
360.1390181.52290.065211
370.1191111.30480.09723
380.1001561.09720.137386
390.0790280.86570.194188
400.0579960.63530.263217
410.0382730.41930.337887
420.0181420.19870.421404
43-0.001973-0.02160.491395
44-0.022262-0.24390.403874
45-0.03994-0.43750.331261
46-0.056616-0.62020.268153
47-0.071657-0.7850.21701
48-0.087163-0.95480.170793

\begin{tabular}{lllllllll}
\hline
Autocorrelation Function \tabularnewline
Time lag k & ACF(k) & T-STAT & P-value \tabularnewline
1 & 0.974719 & 10.6775 & 0 \tabularnewline
2 & 0.950395 & 10.4111 & 0 \tabularnewline
3 & 0.923516 & 10.1166 & 0 \tabularnewline
4 & 0.895875 & 9.8138 & 0 \tabularnewline
5 & 0.869072 & 9.5202 & 0 \tabularnewline
6 & 0.842311 & 9.2271 & 0 \tabularnewline
7 & 0.816446 & 8.9437 & 0 \tabularnewline
8 & 0.7898 & 8.6518 & 0 \tabularnewline
9 & 0.766717 & 8.399 & 0 \tabularnewline
10 & 0.743586 & 8.1456 & 0 \tabularnewline
11 & 0.722907 & 7.919 & 0 \tabularnewline
12 & 0.700637 & 7.6751 & 0 \tabularnewline
13 & 0.675179 & 7.3962 & 0 \tabularnewline
14 & 0.649833 & 7.1186 & 0 \tabularnewline
15 & 0.622246 & 6.8164 & 0 \tabularnewline
16 & 0.594465 & 6.512 & 0 \tabularnewline
17 & 0.567805 & 6.22 & 0 \tabularnewline
18 & 0.541511 & 5.932 & 0 \tabularnewline
19 & 0.515622 & 5.6484 & 0 \tabularnewline
20 & 0.489258 & 5.3596 & 0 \tabularnewline
21 & 0.466547 & 5.1108 & 1e-06 \tabularnewline
22 & 0.444629 & 4.8707 & 2e-06 \tabularnewline
23 & 0.425049 & 4.6562 & 4e-06 \tabularnewline
24 & 0.404081 & 4.4265 & 1.1e-05 \tabularnewline
25 & 0.381288 & 4.1768 & 2.8e-05 \tabularnewline
26 & 0.359169 & 3.9345 & 7e-05 \tabularnewline
27 & 0.334732 & 3.6668 & 0.000184 \tabularnewline
28 & 0.310251 & 3.3986 & 0.00046 \tabularnewline
29 & 0.286982 & 3.1437 & 0.001051 \tabularnewline
30 & 0.263937 & 2.8913 & 0.002278 \tabularnewline
31 & 0.240166 & 2.6309 & 0.004817 \tabularnewline
32 & 0.215911 & 2.3652 & 0.009812 \tabularnewline
33 & 0.195336 & 2.1398 & 0.017198 \tabularnewline
34 & 0.175408 & 1.9215 & 0.02852 \tabularnewline
35 & 0.157581 & 1.7262 & 0.043441 \tabularnewline
36 & 0.139018 & 1.5229 & 0.065211 \tabularnewline
37 & 0.119111 & 1.3048 & 0.09723 \tabularnewline
38 & 0.100156 & 1.0972 & 0.137386 \tabularnewline
39 & 0.079028 & 0.8657 & 0.194188 \tabularnewline
40 & 0.057996 & 0.6353 & 0.263217 \tabularnewline
41 & 0.038273 & 0.4193 & 0.337887 \tabularnewline
42 & 0.018142 & 0.1987 & 0.421404 \tabularnewline
43 & -0.001973 & -0.0216 & 0.491395 \tabularnewline
44 & -0.022262 & -0.2439 & 0.403874 \tabularnewline
45 & -0.03994 & -0.4375 & 0.331261 \tabularnewline
46 & -0.056616 & -0.6202 & 0.268153 \tabularnewline
47 & -0.071657 & -0.785 & 0.21701 \tabularnewline
48 & -0.087163 & -0.9548 & 0.170793 \tabularnewline
\hline
\end{tabular}
%Source: https://freestatistics.org/blog/index.php?pk=123026&T=1

[TABLE]
[ROW][C]Autocorrelation Function[/C][/ROW]
[ROW][C]Time lag k[/C][C]ACF(k)[/C][C]T-STAT[/C][C]P-value[/C][/ROW]
[ROW][C]1[/C][C]0.974719[/C][C]10.6775[/C][C]0[/C][/ROW]
[ROW][C]2[/C][C]0.950395[/C][C]10.4111[/C][C]0[/C][/ROW]
[ROW][C]3[/C][C]0.923516[/C][C]10.1166[/C][C]0[/C][/ROW]
[ROW][C]4[/C][C]0.895875[/C][C]9.8138[/C][C]0[/C][/ROW]
[ROW][C]5[/C][C]0.869072[/C][C]9.5202[/C][C]0[/C][/ROW]
[ROW][C]6[/C][C]0.842311[/C][C]9.2271[/C][C]0[/C][/ROW]
[ROW][C]7[/C][C]0.816446[/C][C]8.9437[/C][C]0[/C][/ROW]
[ROW][C]8[/C][C]0.7898[/C][C]8.6518[/C][C]0[/C][/ROW]
[ROW][C]9[/C][C]0.766717[/C][C]8.399[/C][C]0[/C][/ROW]
[ROW][C]10[/C][C]0.743586[/C][C]8.1456[/C][C]0[/C][/ROW]
[ROW][C]11[/C][C]0.722907[/C][C]7.919[/C][C]0[/C][/ROW]
[ROW][C]12[/C][C]0.700637[/C][C]7.6751[/C][C]0[/C][/ROW]
[ROW][C]13[/C][C]0.675179[/C][C]7.3962[/C][C]0[/C][/ROW]
[ROW][C]14[/C][C]0.649833[/C][C]7.1186[/C][C]0[/C][/ROW]
[ROW][C]15[/C][C]0.622246[/C][C]6.8164[/C][C]0[/C][/ROW]
[ROW][C]16[/C][C]0.594465[/C][C]6.512[/C][C]0[/C][/ROW]
[ROW][C]17[/C][C]0.567805[/C][C]6.22[/C][C]0[/C][/ROW]
[ROW][C]18[/C][C]0.541511[/C][C]5.932[/C][C]0[/C][/ROW]
[ROW][C]19[/C][C]0.515622[/C][C]5.6484[/C][C]0[/C][/ROW]
[ROW][C]20[/C][C]0.489258[/C][C]5.3596[/C][C]0[/C][/ROW]
[ROW][C]21[/C][C]0.466547[/C][C]5.1108[/C][C]1e-06[/C][/ROW]
[ROW][C]22[/C][C]0.444629[/C][C]4.8707[/C][C]2e-06[/C][/ROW]
[ROW][C]23[/C][C]0.425049[/C][C]4.6562[/C][C]4e-06[/C][/ROW]
[ROW][C]24[/C][C]0.404081[/C][C]4.4265[/C][C]1.1e-05[/C][/ROW]
[ROW][C]25[/C][C]0.381288[/C][C]4.1768[/C][C]2.8e-05[/C][/ROW]
[ROW][C]26[/C][C]0.359169[/C][C]3.9345[/C][C]7e-05[/C][/ROW]
[ROW][C]27[/C][C]0.334732[/C][C]3.6668[/C][C]0.000184[/C][/ROW]
[ROW][C]28[/C][C]0.310251[/C][C]3.3986[/C][C]0.00046[/C][/ROW]
[ROW][C]29[/C][C]0.286982[/C][C]3.1437[/C][C]0.001051[/C][/ROW]
[ROW][C]30[/C][C]0.263937[/C][C]2.8913[/C][C]0.002278[/C][/ROW]
[ROW][C]31[/C][C]0.240166[/C][C]2.6309[/C][C]0.004817[/C][/ROW]
[ROW][C]32[/C][C]0.215911[/C][C]2.3652[/C][C]0.009812[/C][/ROW]
[ROW][C]33[/C][C]0.195336[/C][C]2.1398[/C][C]0.017198[/C][/ROW]
[ROW][C]34[/C][C]0.175408[/C][C]1.9215[/C][C]0.02852[/C][/ROW]
[ROW][C]35[/C][C]0.157581[/C][C]1.7262[/C][C]0.043441[/C][/ROW]
[ROW][C]36[/C][C]0.139018[/C][C]1.5229[/C][C]0.065211[/C][/ROW]
[ROW][C]37[/C][C]0.119111[/C][C]1.3048[/C][C]0.09723[/C][/ROW]
[ROW][C]38[/C][C]0.100156[/C][C]1.0972[/C][C]0.137386[/C][/ROW]
[ROW][C]39[/C][C]0.079028[/C][C]0.8657[/C][C]0.194188[/C][/ROW]
[ROW][C]40[/C][C]0.057996[/C][C]0.6353[/C][C]0.263217[/C][/ROW]
[ROW][C]41[/C][C]0.038273[/C][C]0.4193[/C][C]0.337887[/C][/ROW]
[ROW][C]42[/C][C]0.018142[/C][C]0.1987[/C][C]0.421404[/C][/ROW]
[ROW][C]43[/C][C]-0.001973[/C][C]-0.0216[/C][C]0.491395[/C][/ROW]
[ROW][C]44[/C][C]-0.022262[/C][C]-0.2439[/C][C]0.403874[/C][/ROW]
[ROW][C]45[/C][C]-0.03994[/C][C]-0.4375[/C][C]0.331261[/C][/ROW]
[ROW][C]46[/C][C]-0.056616[/C][C]-0.6202[/C][C]0.268153[/C][/ROW]
[ROW][C]47[/C][C]-0.071657[/C][C]-0.785[/C][C]0.21701[/C][/ROW]
[ROW][C]48[/C][C]-0.087163[/C][C]-0.9548[/C][C]0.170793[/C][/ROW]
[/TABLE]
Source: https://freestatistics.org/blog/index.php?pk=123026&T=1

Globally Unique Identifier (entire table): ba.freestatistics.org/blog/index.php?pk=123026&T=1

As an alternative you can also use a QR Code:  

The GUIDs for individual cells are displayed in the table below:

Autocorrelation Function
Time lag kACF(k)T-STATP-value
10.97471910.67750
20.95039510.41110
30.92351610.11660
40.8958759.81380
50.8690729.52020
60.8423119.22710
70.8164468.94370
80.78988.65180
90.7667178.3990
100.7435868.14560
110.7229077.9190
120.7006377.67510
130.6751797.39620
140.6498337.11860
150.6222466.81640
160.5944656.5120
170.5678056.220
180.5415115.9320
190.5156225.64840
200.4892585.35960
210.4665475.11081e-06
220.4446294.87072e-06
230.4250494.65624e-06
240.4040814.42651.1e-05
250.3812884.17682.8e-05
260.3591693.93457e-05
270.3347323.66680.000184
280.3102513.39860.00046
290.2869823.14370.001051
300.2639372.89130.002278
310.2401662.63090.004817
320.2159112.36520.009812
330.1953362.13980.017198
340.1754081.92150.02852
350.1575811.72620.043441
360.1390181.52290.065211
370.1191111.30480.09723
380.1001561.09720.137386
390.0790280.86570.194188
400.0579960.63530.263217
410.0382730.41930.337887
420.0181420.19870.421404
43-0.001973-0.02160.491395
44-0.022262-0.24390.403874
45-0.03994-0.43750.331261
46-0.056616-0.62020.268153
47-0.071657-0.7850.21701
48-0.087163-0.95480.170793


Partial Autocorrelation Function
Time lag kPACF(k)T-STATP-value
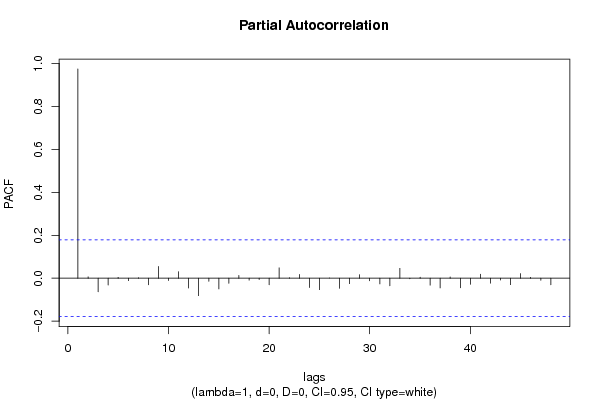
10.97471910.67750
20.0063680.06980.472253
3-0.063311-0.69350.244657
4-0.031197-0.34170.36657
50.0041570.04550.481876
6-0.011185-0.12250.451342
70.0020640.02260.490998
8-0.030063-0.32930.371244
90.0548150.60050.274664
10-0.010431-0.11430.454608
110.0302580.33150.370439
12-0.04571-0.50070.30874
13-0.080954-0.88680.188479
14-0.014005-0.15340.439162
15-0.049488-0.54210.294372
16-0.02328-0.2550.399574
170.0129710.14210.443625
18-0.00874-0.09570.461944
19-0.006114-0.0670.473357
20-0.03035-0.33250.37006
210.0483570.52970.298642
220.0021780.02390.490502
230.0173620.19020.42474
24-0.043154-0.47270.318634
25-0.053015-0.58070.28125
26-7.7e-05-8e-040.499664
27-0.046988-0.51470.303845
28-0.025061-0.27450.392076
290.0165220.1810.42834
30-0.011396-0.12480.450431
31-0.026337-0.28850.386728
32-0.03544-0.38820.349267
330.0459470.50330.307831
34-0.002612-0.02860.488612
350.0042840.04690.481322
36-0.032199-0.35270.362458
37-0.045079-0.49380.311168
380.0056710.06210.475285
39-0.04436-0.48590.313948
40-0.028294-0.30990.37857
410.0185480.20320.419668
42-0.022868-0.25050.401311
43-0.008316-0.09110.463782
44-0.02998-0.32840.371586
450.0216220.23690.406585
460.0039550.04330.482757
47-0.009773-0.10710.45746
48-0.030051-0.32920.371292

\begin{tabular}{lllllllll}
\hline
Partial Autocorrelation Function \tabularnewline
Time lag k & PACF(k) & T-STAT & P-value \tabularnewline
1 & 0.974719 & 10.6775 & 0 \tabularnewline
2 & 0.006368 & 0.0698 & 0.472253 \tabularnewline
3 & -0.063311 & -0.6935 & 0.244657 \tabularnewline
4 & -0.031197 & -0.3417 & 0.36657 \tabularnewline
5 & 0.004157 & 0.0455 & 0.481876 \tabularnewline
6 & -0.011185 & -0.1225 & 0.451342 \tabularnewline
7 & 0.002064 & 0.0226 & 0.490998 \tabularnewline
8 & -0.030063 & -0.3293 & 0.371244 \tabularnewline
9 & 0.054815 & 0.6005 & 0.274664 \tabularnewline
10 & -0.010431 & -0.1143 & 0.454608 \tabularnewline
11 & 0.030258 & 0.3315 & 0.370439 \tabularnewline
12 & -0.04571 & -0.5007 & 0.30874 \tabularnewline
13 & -0.080954 & -0.8868 & 0.188479 \tabularnewline
14 & -0.014005 & -0.1534 & 0.439162 \tabularnewline
15 & -0.049488 & -0.5421 & 0.294372 \tabularnewline
16 & -0.02328 & -0.255 & 0.399574 \tabularnewline
17 & 0.012971 & 0.1421 & 0.443625 \tabularnewline
18 & -0.00874 & -0.0957 & 0.461944 \tabularnewline
19 & -0.006114 & -0.067 & 0.473357 \tabularnewline
20 & -0.03035 & -0.3325 & 0.37006 \tabularnewline
21 & 0.048357 & 0.5297 & 0.298642 \tabularnewline
22 & 0.002178 & 0.0239 & 0.490502 \tabularnewline
23 & 0.017362 & 0.1902 & 0.42474 \tabularnewline
24 & -0.043154 & -0.4727 & 0.318634 \tabularnewline
25 & -0.053015 & -0.5807 & 0.28125 \tabularnewline
26 & -7.7e-05 & -8e-04 & 0.499664 \tabularnewline
27 & -0.046988 & -0.5147 & 0.303845 \tabularnewline
28 & -0.025061 & -0.2745 & 0.392076 \tabularnewline
29 & 0.016522 & 0.181 & 0.42834 \tabularnewline
30 & -0.011396 & -0.1248 & 0.450431 \tabularnewline
31 & -0.026337 & -0.2885 & 0.386728 \tabularnewline
32 & -0.03544 & -0.3882 & 0.349267 \tabularnewline
33 & 0.045947 & 0.5033 & 0.307831 \tabularnewline
34 & -0.002612 & -0.0286 & 0.488612 \tabularnewline
35 & 0.004284 & 0.0469 & 0.481322 \tabularnewline
36 & -0.032199 & -0.3527 & 0.362458 \tabularnewline
37 & -0.045079 & -0.4938 & 0.311168 \tabularnewline
38 & 0.005671 & 0.0621 & 0.475285 \tabularnewline
39 & -0.04436 & -0.4859 & 0.313948 \tabularnewline
40 & -0.028294 & -0.3099 & 0.37857 \tabularnewline
41 & 0.018548 & 0.2032 & 0.419668 \tabularnewline
42 & -0.022868 & -0.2505 & 0.401311 \tabularnewline
43 & -0.008316 & -0.0911 & 0.463782 \tabularnewline
44 & -0.02998 & -0.3284 & 0.371586 \tabularnewline
45 & 0.021622 & 0.2369 & 0.406585 \tabularnewline
46 & 0.003955 & 0.0433 & 0.482757 \tabularnewline
47 & -0.009773 & -0.1071 & 0.45746 \tabularnewline
48 & -0.030051 & -0.3292 & 0.371292 \tabularnewline
\hline
\end{tabular}
%Source: https://freestatistics.org/blog/index.php?pk=123026&T=2

[TABLE]
[ROW][C]Partial Autocorrelation Function[/C][/ROW]
[ROW][C]Time lag k[/C][C]PACF(k)[/C][C]T-STAT[/C][C]P-value[/C][/ROW]
[ROW][C]1[/C][C]0.974719[/C][C]10.6775[/C][C]0[/C][/ROW]
[ROW][C]2[/C][C]0.006368[/C][C]0.0698[/C][C]0.472253[/C][/ROW]
[ROW][C]3[/C][C]-0.063311[/C][C]-0.6935[/C][C]0.244657[/C][/ROW]
[ROW][C]4[/C][C]-0.031197[/C][C]-0.3417[/C][C]0.36657[/C][/ROW]
[ROW][C]5[/C][C]0.004157[/C][C]0.0455[/C][C]0.481876[/C][/ROW]
[ROW][C]6[/C][C]-0.011185[/C][C]-0.1225[/C][C]0.451342[/C][/ROW]
[ROW][C]7[/C][C]0.002064[/C][C]0.0226[/C][C]0.490998[/C][/ROW]
[ROW][C]8[/C][C]-0.030063[/C][C]-0.3293[/C][C]0.371244[/C][/ROW]
[ROW][C]9[/C][C]0.054815[/C][C]0.6005[/C][C]0.274664[/C][/ROW]
[ROW][C]10[/C][C]-0.010431[/C][C]-0.1143[/C][C]0.454608[/C][/ROW]
[ROW][C]11[/C][C]0.030258[/C][C]0.3315[/C][C]0.370439[/C][/ROW]
[ROW][C]12[/C][C]-0.04571[/C][C]-0.5007[/C][C]0.30874[/C][/ROW]
[ROW][C]13[/C][C]-0.080954[/C][C]-0.8868[/C][C]0.188479[/C][/ROW]
[ROW][C]14[/C][C]-0.014005[/C][C]-0.1534[/C][C]0.439162[/C][/ROW]
[ROW][C]15[/C][C]-0.049488[/C][C]-0.5421[/C][C]0.294372[/C][/ROW]
[ROW][C]16[/C][C]-0.02328[/C][C]-0.255[/C][C]0.399574[/C][/ROW]
[ROW][C]17[/C][C]0.012971[/C][C]0.1421[/C][C]0.443625[/C][/ROW]
[ROW][C]18[/C][C]-0.00874[/C][C]-0.0957[/C][C]0.461944[/C][/ROW]
[ROW][C]19[/C][C]-0.006114[/C][C]-0.067[/C][C]0.473357[/C][/ROW]
[ROW][C]20[/C][C]-0.03035[/C][C]-0.3325[/C][C]0.37006[/C][/ROW]
[ROW][C]21[/C][C]0.048357[/C][C]0.5297[/C][C]0.298642[/C][/ROW]
[ROW][C]22[/C][C]0.002178[/C][C]0.0239[/C][C]0.490502[/C][/ROW]
[ROW][C]23[/C][C]0.017362[/C][C]0.1902[/C][C]0.42474[/C][/ROW]
[ROW][C]24[/C][C]-0.043154[/C][C]-0.4727[/C][C]0.318634[/C][/ROW]
[ROW][C]25[/C][C]-0.053015[/C][C]-0.5807[/C][C]0.28125[/C][/ROW]
[ROW][C]26[/C][C]-7.7e-05[/C][C]-8e-04[/C][C]0.499664[/C][/ROW]
[ROW][C]27[/C][C]-0.046988[/C][C]-0.5147[/C][C]0.303845[/C][/ROW]
[ROW][C]28[/C][C]-0.025061[/C][C]-0.2745[/C][C]0.392076[/C][/ROW]
[ROW][C]29[/C][C]0.016522[/C][C]0.181[/C][C]0.42834[/C][/ROW]
[ROW][C]30[/C][C]-0.011396[/C][C]-0.1248[/C][C]0.450431[/C][/ROW]
[ROW][C]31[/C][C]-0.026337[/C][C]-0.2885[/C][C]0.386728[/C][/ROW]
[ROW][C]32[/C][C]-0.03544[/C][C]-0.3882[/C][C]0.349267[/C][/ROW]
[ROW][C]33[/C][C]0.045947[/C][C]0.5033[/C][C]0.307831[/C][/ROW]
[ROW][C]34[/C][C]-0.002612[/C][C]-0.0286[/C][C]0.488612[/C][/ROW]
[ROW][C]35[/C][C]0.004284[/C][C]0.0469[/C][C]0.481322[/C][/ROW]
[ROW][C]36[/C][C]-0.032199[/C][C]-0.3527[/C][C]0.362458[/C][/ROW]
[ROW][C]37[/C][C]-0.045079[/C][C]-0.4938[/C][C]0.311168[/C][/ROW]
[ROW][C]38[/C][C]0.005671[/C][C]0.0621[/C][C]0.475285[/C][/ROW]
[ROW][C]39[/C][C]-0.04436[/C][C]-0.4859[/C][C]0.313948[/C][/ROW]
[ROW][C]40[/C][C]-0.028294[/C][C]-0.3099[/C][C]0.37857[/C][/ROW]
[ROW][C]41[/C][C]0.018548[/C][C]0.2032[/C][C]0.419668[/C][/ROW]
[ROW][C]42[/C][C]-0.022868[/C][C]-0.2505[/C][C]0.401311[/C][/ROW]
[ROW][C]43[/C][C]-0.008316[/C][C]-0.0911[/C][C]0.463782[/C][/ROW]
[ROW][C]44[/C][C]-0.02998[/C][C]-0.3284[/C][C]0.371586[/C][/ROW]
[ROW][C]45[/C][C]0.021622[/C][C]0.2369[/C][C]0.406585[/C][/ROW]
[ROW][C]46[/C][C]0.003955[/C][C]0.0433[/C][C]0.482757[/C][/ROW]
[ROW][C]47[/C][C]-0.009773[/C][C]-0.1071[/C][C]0.45746[/C][/ROW]
[ROW][C]48[/C][C]-0.030051[/C][C]-0.3292[/C][C]0.371292[/C][/ROW]
[/TABLE]
Source: https://freestatistics.org/blog/index.php?pk=123026&T=2

Globally Unique Identifier (entire table): ba.freestatistics.org/blog/index.php?pk=123026&T=2

As an alternative you can also use a QR Code:  

The GUIDs for individual cells are displayed in the table below:

Partial Autocorrelation Function
Time lag kPACF(k)T-STATP-value
10.97471910.67750
20.0063680.06980.472253
3-0.063311-0.69350.244657
4-0.031197-0.34170.36657
50.0041570.04550.481876
6-0.011185-0.12250.451342
70.0020640.02260.490998
8-0.030063-0.32930.371244
90.0548150.60050.274664
10-0.010431-0.11430.454608
110.0302580.33150.370439
12-0.04571-0.50070.30874
13-0.080954-0.88680.188479
14-0.014005-0.15340.439162
15-0.049488-0.54210.294372
16-0.02328-0.2550.399574
170.0129710.14210.443625
18-0.00874-0.09570.461944
19-0.006114-0.0670.473357
20-0.03035-0.33250.37006
210.0483570.52970.298642
220.0021780.02390.490502
230.0173620.19020.42474
24-0.043154-0.47270.318634
25-0.053015-0.58070.28125
26-7.7e-05-8e-040.499664
27-0.046988-0.51470.303845
28-0.025061-0.27450.392076
290.0165220.1810.42834
30-0.011396-0.12480.450431
31-0.026337-0.28850.386728
32-0.03544-0.38820.349267
330.0459470.50330.307831
34-0.002612-0.02860.488612
350.0042840.04690.481322
36-0.032199-0.35270.362458
37-0.045079-0.49380.311168
380.0056710.06210.475285
39-0.04436-0.48590.313948
40-0.028294-0.30990.37857
410.0185480.20320.419668
42-0.022868-0.25050.401311
43-0.008316-0.09110.463782
44-0.02998-0.32840.371586
450.0216220.23690.406585
460.0039550.04330.482757
47-0.009773-0.10710.45746
48-0.030051-0.32920.371292


Parameters (Session):
par1 = 48 ; par2 = 1 ; par3 = 0 ; par4 = 0 ; par5 = 12 ; par6 = White Noise ; par7 = 0.95 ;
Parameters (R input):
par1 = 48 ; par2 = 1 ; par3 = 0 ; par4 = 0 ; par5 = 12 ; par6 = White Noise ; par7 = 0.95 ; par8 = ;
R code (references can be found in the software module):
if (par1 == 'Default') {
par1 = 10*log10(length(x))
} else {
par1 <- as.numeric(par1)
}
par2 <- as.numeric(par2)
par3 <- as.numeric(par3)
par4 <- as.numeric(par4)
par5 <- as.numeric(par5)
if (par6 == 'White Noise') par6 <- 'white' else par6 <- 'ma'
par7 <- as.numeric(par7)
if (par8 != '') par8 <- as.numeric(par8)
ox <- x
if (par8 == '') {
if (par2 == 0) {
x <- log(x)
} else {
x <- (x ^ par2 - 1) / par2
}
} else {
x <- log(x,base=par8)
}
if (par3 > 0) x <- diff(x,lag=1,difference=par3)
if (par4 > 0) x <- diff(x,lag=par5,difference=par4)
bitmap(file='picts.png')
op <- par(mfrow=c(2,1))
plot(ox,type='l',main='Original Time Series',xlab='time',ylab='value')
if (par8=='') {
mytitle <- paste('Working Time Series (lambda=',par2,', d=',par3,', D=',par4,')',sep='')
mysub <- paste('(lambda=',par2,', d=',par3,', D=',par4,', CI=', par7, ', CI type=',par6,')',sep='')
} else {
mytitle <- paste('Working Time Series (base=',par8,', d=',par3,', D=',par4,')',sep='')
mysub <- paste('(base=',par8,', d=',par3,', D=',par4,', CI=', par7, ', CI type=',par6,')',sep='')
}
plot(x,type='l', main=mytitle,xlab='time',ylab='value')
par(op)
dev.off()
bitmap(file='pic1.png')
racf <- acf(x, par1, main='Autocorrelation', xlab='time lag', ylab='ACF', ci.type=par6, ci=par7, sub=mysub)
dev.off()
bitmap(file='pic2.png')
rpacf <- pacf(x,par1,main='Partial Autocorrelation',xlab='lags',ylab='PACF',sub=mysub)
dev.off()
(myacf <- c(racf$acf))
(mypacf <- c(rpacf$acf))
lengthx <- length(x)
sqrtn <- sqrt(lengthx)
load(file='createtable')
a<-table.start()
a<-table.row.start(a)
a<-table.element(a,'Autocorrelation Function',4,TRUE)
a<-table.row.end(a)
a<-table.row.start(a)
a<-table.element(a,'Time lag k',header=TRUE)
a<-table.element(a,hyperlink('basics.htm','ACF(k)','click here for more information about the Autocorrelation Function'),header=TRUE)
a<-table.element(a,'T-STAT',header=TRUE)
a<-table.element(a,'P-value',header=TRUE)
a<-table.row.end(a)
for (i in 2:(par1+1)) {
a<-table.row.start(a)
a<-table.element(a,i-1,header=TRUE)
a<-table.element(a,round(myacf[i],6))
mytstat <- myacf[i]*sqrtn
a<-table.element(a,round(mytstat,4))
a<-table.element(a,round(1-pt(abs(mytstat),lengthx),6))
a<-table.row.end(a)
}
a<-table.end(a)
table.save(a,file='mytable.tab')
a<-table.start()
a<-table.row.start(a)
a<-table.element(a,'Partial Autocorrelation Function',4,TRUE)
a<-table.row.end(a)
a<-table.row.start(a)
a<-table.element(a,'Time lag k',header=TRUE)
a<-table.element(a,hyperlink('basics.htm','PACF(k)','click here for more information about the Partial Autocorrelation Function'),header=TRUE)
a<-table.element(a,'T-STAT',header=TRUE)
a<-table.element(a,'P-value',header=TRUE)
a<-table.row.end(a)
for (i in 1:par1) {
a<-table.row.start(a)
a<-table.element(a,i,header=TRUE)
a<-table.element(a,round(mypacf[i],6))
mytstat <- mypacf[i]*sqrtn
a<-table.element(a,round(mytstat,4))
a<-table.element(a,round(1-pt(abs(mytstat),lengthx),6))
a<-table.row.end(a)
}
a<-table.end(a)
table.save(a,file='mytable1.tab')