Free Statistics

of Irreproducible Research!

Author's title

Author*Unverified author*
R Software Modulerwasp_autocorrelation.wasp
Title produced by software(Partial) Autocorrelation Function
Date of computationWed, 20 Jul 2011 08:36:20 -0400
Cite this page as followsStatistical Computations at FreeStatistics.org, Office for Research Development and Education, URL https://freestatistics.org/blog/index.php?v=date/2011/Jul/20/t1311165416m7kq6jcu6cotno5.htm/, Retrieved Thu, 16 May 2024 22:18:48 +0000
Statistical Computations at FreeStatistics.org, Office for Research Development and Education, URL https://freestatistics.org/blog/index.php?pk=123091, Retrieved Thu, 16 May 2024 22:18:48 +0000
QR Codes:

Original text written by user:
IsPrivate?No (this computation is public)
User-defined keywordsLynn Pelgrims
Estimated Impact218
Family? (F = Feedback message, R = changed R code, M = changed R Module, P = changed Parameters, D = changed Data)
-       [(Partial) Autocorrelation Function] [Tijdreeks B - Sta...] [2011-07-20 12:36:20] [cedc01334dbefab590f7f4b747b64ab1] [Current]
Feedback Forum

Post a new message
Dataseries X:
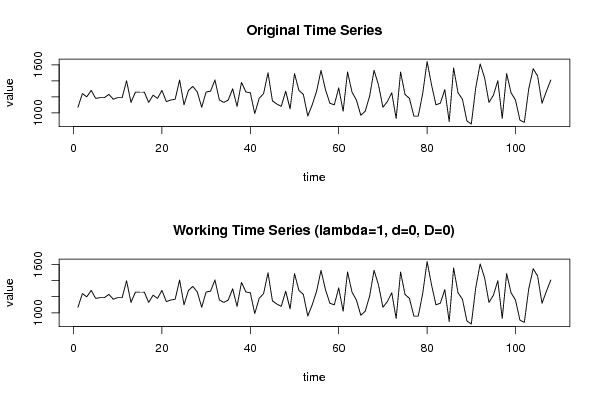
1070
1240
1200
1280
1180
1190
1190
1230
1170
1190
1190
1400
1130
1260
1260
1260
1130
1220
1180
1280
1140
1160
1170
1410
1100
1280
1330
1260
1070
1260
1270
1410
1160
1130
1160
1300
1080
1380
1260
1250
990
1180
1240
1500
1150
1110
1080
1270
1050
1490
1280
1230
960
1100
1270
1530
1290
1120
1100
1310
1020
1510
1260
1160
970
1020
1210
1530
1350
1070
1140
1250
930
1510
1230
1180
960
960
1240
1640
1350
1100
1120
1290
890
1560
1250
1170
900
860
1310
1610
1440
1130
1220
1400
930
1490
1250
1160
910
880
1300
1550
1460
1120
1270
1410


Summary of computational transaction
Raw Inputview raw input (R code)
Raw Outputview raw output of R engine
Computing time1 seconds
R Server'Gertrude Mary Cox' @ cox.wessa.net

\begin{tabular}{lllllllll}
\hline
Summary of computational transaction \tabularnewline
Raw Input & view raw input (R code)  \tabularnewline
Raw Output & view raw output of R engine  \tabularnewline
Computing time & 1 seconds \tabularnewline
R Server & 'Gertrude Mary Cox' @ cox.wessa.net \tabularnewline
\hline
\end{tabular}
%Source: https://freestatistics.org/blog/index.php?pk=123091&T=0

[TABLE]
[ROW][C]Summary of computational transaction[/C][/ROW]
[ROW][C]Raw Input[/C][C]view raw input (R code) [/C][/ROW]
[ROW][C]Raw Output[/C][C]view raw output of R engine [/C][/ROW]
[ROW][C]Computing time[/C][C]1 seconds[/C][/ROW]
[ROW][C]R Server[/C][C]'Gertrude Mary Cox' @ cox.wessa.net[/C][/ROW]
[/TABLE]
Source: https://freestatistics.org/blog/index.php?pk=123091&T=0

Globally Unique Identifier (entire table): ba.freestatistics.org/blog/index.php?pk=123091&T=0

As an alternative you can also use a QR Code:  

The GUIDs for individual cells are displayed in the table below:

Summary of computational transaction
Raw Inputview raw input (R code)
Raw Outputview raw output of R engine
Computing time1 seconds
R Server'Gertrude Mary Cox' @ cox.wessa.net


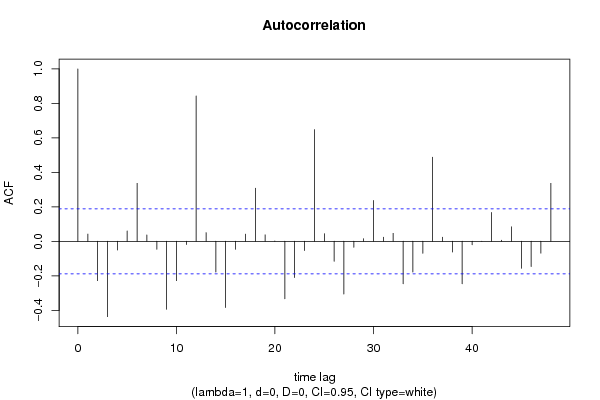
Autocorrelation Function
Time lag kACF(k)T-STATP-value
10.041630.43260.333073
2-0.228125-2.37070.009763
3-0.437113-4.54267e-06
4-0.050965-0.52960.298723
50.0597290.62070.268047
60.3362193.49410.000345
70.036260.37680.353521
8-0.046501-0.48330.314947
9-0.394605-4.10094e-05
10-0.228133-2.37080.00976
11-0.018195-0.18910.425189
120.8431338.76210
130.050240.52210.301332
14-0.177636-1.84610.033812
15-0.384043-3.99116e-05
16-0.045713-0.47510.31785
170.0415340.43160.333433
180.3078253.1990.000905
190.0375430.39020.348595
200.0013690.01420.494336
21-0.333256-3.46330.000383
22-0.210253-2.1850.015524
23-0.053179-0.55260.290823
240.6480796.7350
250.0434280.45130.326335
26-0.115972-1.20520.115376
27-0.306113-3.18120.000957
28-0.034122-0.35460.361789
290.0148430.15430.438849
300.2368672.46160.007707
310.0231830.24090.405035
320.0460350.47840.316662
33-0.245853-2.5550.006006
34-0.17771-1.84680.033755
35-0.069571-0.7230.23562
360.4879015.07041e-06
370.0237280.24660.402848
38-0.061939-0.64370.260571
39-0.246163-2.55820.005954
40-0.019849-0.20630.418483
41-0.000485-0.0050.497995
420.1673831.73950.042399
430.0063110.06560.473914
440.0837920.87080.1929
45-0.156609-1.62750.05327
46-0.146191-1.51930.065809
47-0.068822-0.71520.23801
480.3362363.49430.000345

\begin{tabular}{lllllllll}
\hline
Autocorrelation Function \tabularnewline
Time lag k & ACF(k) & T-STAT & P-value \tabularnewline
1 & 0.04163 & 0.4326 & 0.333073 \tabularnewline
2 & -0.228125 & -2.3707 & 0.009763 \tabularnewline
3 & -0.437113 & -4.5426 & 7e-06 \tabularnewline
4 & -0.050965 & -0.5296 & 0.298723 \tabularnewline
5 & 0.059729 & 0.6207 & 0.268047 \tabularnewline
6 & 0.336219 & 3.4941 & 0.000345 \tabularnewline
7 & 0.03626 & 0.3768 & 0.353521 \tabularnewline
8 & -0.046501 & -0.4833 & 0.314947 \tabularnewline
9 & -0.394605 & -4.1009 & 4e-05 \tabularnewline
10 & -0.228133 & -2.3708 & 0.00976 \tabularnewline
11 & -0.018195 & -0.1891 & 0.425189 \tabularnewline
12 & 0.843133 & 8.7621 & 0 \tabularnewline
13 & 0.05024 & 0.5221 & 0.301332 \tabularnewline
14 & -0.177636 & -1.8461 & 0.033812 \tabularnewline
15 & -0.384043 & -3.9911 & 6e-05 \tabularnewline
16 & -0.045713 & -0.4751 & 0.31785 \tabularnewline
17 & 0.041534 & 0.4316 & 0.333433 \tabularnewline
18 & 0.307825 & 3.199 & 0.000905 \tabularnewline
19 & 0.037543 & 0.3902 & 0.348595 \tabularnewline
20 & 0.001369 & 0.0142 & 0.494336 \tabularnewline
21 & -0.333256 & -3.4633 & 0.000383 \tabularnewline
22 & -0.210253 & -2.185 & 0.015524 \tabularnewline
23 & -0.053179 & -0.5526 & 0.290823 \tabularnewline
24 & 0.648079 & 6.735 & 0 \tabularnewline
25 & 0.043428 & 0.4513 & 0.326335 \tabularnewline
26 & -0.115972 & -1.2052 & 0.115376 \tabularnewline
27 & -0.306113 & -3.1812 & 0.000957 \tabularnewline
28 & -0.034122 & -0.3546 & 0.361789 \tabularnewline
29 & 0.014843 & 0.1543 & 0.438849 \tabularnewline
30 & 0.236867 & 2.4616 & 0.007707 \tabularnewline
31 & 0.023183 & 0.2409 & 0.405035 \tabularnewline
32 & 0.046035 & 0.4784 & 0.316662 \tabularnewline
33 & -0.245853 & -2.555 & 0.006006 \tabularnewline
34 & -0.17771 & -1.8468 & 0.033755 \tabularnewline
35 & -0.069571 & -0.723 & 0.23562 \tabularnewline
36 & 0.487901 & 5.0704 & 1e-06 \tabularnewline
37 & 0.023728 & 0.2466 & 0.402848 \tabularnewline
38 & -0.061939 & -0.6437 & 0.260571 \tabularnewline
39 & -0.246163 & -2.5582 & 0.005954 \tabularnewline
40 & -0.019849 & -0.2063 & 0.418483 \tabularnewline
41 & -0.000485 & -0.005 & 0.497995 \tabularnewline
42 & 0.167383 & 1.7395 & 0.042399 \tabularnewline
43 & 0.006311 & 0.0656 & 0.473914 \tabularnewline
44 & 0.083792 & 0.8708 & 0.1929 \tabularnewline
45 & -0.156609 & -1.6275 & 0.05327 \tabularnewline
46 & -0.146191 & -1.5193 & 0.065809 \tabularnewline
47 & -0.068822 & -0.7152 & 0.23801 \tabularnewline
48 & 0.336236 & 3.4943 & 0.000345 \tabularnewline
\hline
\end{tabular}
%Source: https://freestatistics.org/blog/index.php?pk=123091&T=1

[TABLE]
[ROW][C]Autocorrelation Function[/C][/ROW]
[ROW][C]Time lag k[/C][C]ACF(k)[/C][C]T-STAT[/C][C]P-value[/C][/ROW]
[ROW][C]1[/C][C]0.04163[/C][C]0.4326[/C][C]0.333073[/C][/ROW]
[ROW][C]2[/C][C]-0.228125[/C][C]-2.3707[/C][C]0.009763[/C][/ROW]
[ROW][C]3[/C][C]-0.437113[/C][C]-4.5426[/C][C]7e-06[/C][/ROW]
[ROW][C]4[/C][C]-0.050965[/C][C]-0.5296[/C][C]0.298723[/C][/ROW]
[ROW][C]5[/C][C]0.059729[/C][C]0.6207[/C][C]0.268047[/C][/ROW]
[ROW][C]6[/C][C]0.336219[/C][C]3.4941[/C][C]0.000345[/C][/ROW]
[ROW][C]7[/C][C]0.03626[/C][C]0.3768[/C][C]0.353521[/C][/ROW]
[ROW][C]8[/C][C]-0.046501[/C][C]-0.4833[/C][C]0.314947[/C][/ROW]
[ROW][C]9[/C][C]-0.394605[/C][C]-4.1009[/C][C]4e-05[/C][/ROW]
[ROW][C]10[/C][C]-0.228133[/C][C]-2.3708[/C][C]0.00976[/C][/ROW]
[ROW][C]11[/C][C]-0.018195[/C][C]-0.1891[/C][C]0.425189[/C][/ROW]
[ROW][C]12[/C][C]0.843133[/C][C]8.7621[/C][C]0[/C][/ROW]
[ROW][C]13[/C][C]0.05024[/C][C]0.5221[/C][C]0.301332[/C][/ROW]
[ROW][C]14[/C][C]-0.177636[/C][C]-1.8461[/C][C]0.033812[/C][/ROW]
[ROW][C]15[/C][C]-0.384043[/C][C]-3.9911[/C][C]6e-05[/C][/ROW]
[ROW][C]16[/C][C]-0.045713[/C][C]-0.4751[/C][C]0.31785[/C][/ROW]
[ROW][C]17[/C][C]0.041534[/C][C]0.4316[/C][C]0.333433[/C][/ROW]
[ROW][C]18[/C][C]0.307825[/C][C]3.199[/C][C]0.000905[/C][/ROW]
[ROW][C]19[/C][C]0.037543[/C][C]0.3902[/C][C]0.348595[/C][/ROW]
[ROW][C]20[/C][C]0.001369[/C][C]0.0142[/C][C]0.494336[/C][/ROW]
[ROW][C]21[/C][C]-0.333256[/C][C]-3.4633[/C][C]0.000383[/C][/ROW]
[ROW][C]22[/C][C]-0.210253[/C][C]-2.185[/C][C]0.015524[/C][/ROW]
[ROW][C]23[/C][C]-0.053179[/C][C]-0.5526[/C][C]0.290823[/C][/ROW]
[ROW][C]24[/C][C]0.648079[/C][C]6.735[/C][C]0[/C][/ROW]
[ROW][C]25[/C][C]0.043428[/C][C]0.4513[/C][C]0.326335[/C][/ROW]
[ROW][C]26[/C][C]-0.115972[/C][C]-1.2052[/C][C]0.115376[/C][/ROW]
[ROW][C]27[/C][C]-0.306113[/C][C]-3.1812[/C][C]0.000957[/C][/ROW]
[ROW][C]28[/C][C]-0.034122[/C][C]-0.3546[/C][C]0.361789[/C][/ROW]
[ROW][C]29[/C][C]0.014843[/C][C]0.1543[/C][C]0.438849[/C][/ROW]
[ROW][C]30[/C][C]0.236867[/C][C]2.4616[/C][C]0.007707[/C][/ROW]
[ROW][C]31[/C][C]0.023183[/C][C]0.2409[/C][C]0.405035[/C][/ROW]
[ROW][C]32[/C][C]0.046035[/C][C]0.4784[/C][C]0.316662[/C][/ROW]
[ROW][C]33[/C][C]-0.245853[/C][C]-2.555[/C][C]0.006006[/C][/ROW]
[ROW][C]34[/C][C]-0.17771[/C][C]-1.8468[/C][C]0.033755[/C][/ROW]
[ROW][C]35[/C][C]-0.069571[/C][C]-0.723[/C][C]0.23562[/C][/ROW]
[ROW][C]36[/C][C]0.487901[/C][C]5.0704[/C][C]1e-06[/C][/ROW]
[ROW][C]37[/C][C]0.023728[/C][C]0.2466[/C][C]0.402848[/C][/ROW]
[ROW][C]38[/C][C]-0.061939[/C][C]-0.6437[/C][C]0.260571[/C][/ROW]
[ROW][C]39[/C][C]-0.246163[/C][C]-2.5582[/C][C]0.005954[/C][/ROW]
[ROW][C]40[/C][C]-0.019849[/C][C]-0.2063[/C][C]0.418483[/C][/ROW]
[ROW][C]41[/C][C]-0.000485[/C][C]-0.005[/C][C]0.497995[/C][/ROW]
[ROW][C]42[/C][C]0.167383[/C][C]1.7395[/C][C]0.042399[/C][/ROW]
[ROW][C]43[/C][C]0.006311[/C][C]0.0656[/C][C]0.473914[/C][/ROW]
[ROW][C]44[/C][C]0.083792[/C][C]0.8708[/C][C]0.1929[/C][/ROW]
[ROW][C]45[/C][C]-0.156609[/C][C]-1.6275[/C][C]0.05327[/C][/ROW]
[ROW][C]46[/C][C]-0.146191[/C][C]-1.5193[/C][C]0.065809[/C][/ROW]
[ROW][C]47[/C][C]-0.068822[/C][C]-0.7152[/C][C]0.23801[/C][/ROW]
[ROW][C]48[/C][C]0.336236[/C][C]3.4943[/C][C]0.000345[/C][/ROW]
[/TABLE]
Source: https://freestatistics.org/blog/index.php?pk=123091&T=1

Globally Unique Identifier (entire table): ba.freestatistics.org/blog/index.php?pk=123091&T=1

As an alternative you can also use a QR Code:  

The GUIDs for individual cells are displayed in the table below:

Autocorrelation Function
Time lag kACF(k)T-STATP-value
10.041630.43260.333073
2-0.228125-2.37070.009763
3-0.437113-4.54267e-06
4-0.050965-0.52960.298723
50.0597290.62070.268047
60.3362193.49410.000345
70.036260.37680.353521
8-0.046501-0.48330.314947
9-0.394605-4.10094e-05
10-0.228133-2.37080.00976
11-0.018195-0.18910.425189
120.8431338.76210
130.050240.52210.301332
14-0.177636-1.84610.033812
15-0.384043-3.99116e-05
16-0.045713-0.47510.31785
170.0415340.43160.333433
180.3078253.1990.000905
190.0375430.39020.348595
200.0013690.01420.494336
21-0.333256-3.46330.000383
22-0.210253-2.1850.015524
23-0.053179-0.55260.290823
240.6480796.7350
250.0434280.45130.326335
26-0.115972-1.20520.115376
27-0.306113-3.18120.000957
28-0.034122-0.35460.361789
290.0148430.15430.438849
300.2368672.46160.007707
310.0231830.24090.405035
320.0460350.47840.316662
33-0.245853-2.5550.006006
34-0.17771-1.84680.033755
35-0.069571-0.7230.23562
360.4879015.07041e-06
370.0237280.24660.402848
38-0.061939-0.64370.260571
39-0.246163-2.55820.005954
40-0.019849-0.20630.418483
41-0.000485-0.0050.497995
420.1673831.73950.042399
430.0063110.06560.473914
440.0837920.87080.1929
45-0.156609-1.62750.05327
46-0.146191-1.51930.065809
47-0.068822-0.71520.23801
480.3362363.49430.000345


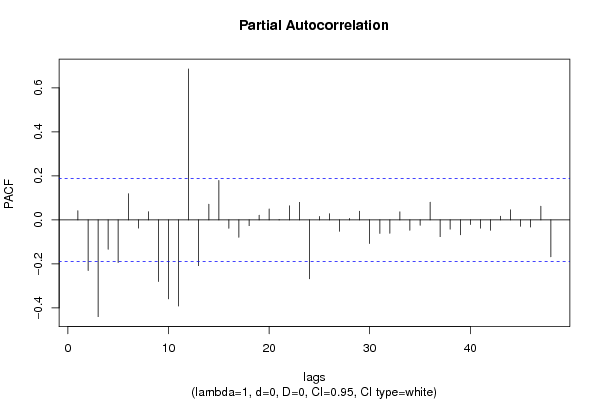
Partial Autocorrelation Function
Time lag kPACF(k)T-STATP-value
10.041630.43260.333073
2-0.230257-2.39290.009221
3-0.439888-4.57146e-06
4-0.13369-1.38930.083792
5-0.193741-2.01340.023279
60.1185861.23240.110242
7-0.037401-0.38870.349137
80.0368120.38260.351399
9-0.280099-2.91090.002189
10-0.358964-3.73050.000153
11-0.391872-4.07254.4e-05
120.6859647.12880
13-0.208015-2.16180.016422
140.0708540.73630.231562
150.1787481.85760.032975
16-0.038378-0.39880.345402
17-0.07902-0.82120.206672
18-0.026352-0.27390.392356
190.0207970.21610.414647
200.0496270.51570.303547
21-0.000988-0.01030.495915
220.0637150.66220.254643
230.0796920.82820.204697
24-0.267846-2.78350.003175
250.0153230.15920.436888
260.0275370.28620.387645
27-0.051432-0.53450.29705
280.0066490.06910.472521
290.0389790.40510.34311
30-0.107093-1.11290.134101
31-0.061596-0.64010.261723
32-0.061166-0.63570.263172
330.0362520.37670.353552
34-0.046897-0.48740.313493
35-0.024536-0.2550.39961
360.0801930.83340.203232
37-0.076237-0.79230.214967
38-0.042073-0.43720.331408
39-0.06762-0.70270.241867
40-0.02127-0.2210.412736
41-0.037645-0.39120.348205
42-0.047152-0.490.312557
430.0164960.17140.432102
440.0454370.47220.318871
45-0.029071-0.30210.381572
46-0.032513-0.33790.368054
470.0623260.64770.259273
48-0.167356-1.73920.042424

\begin{tabular}{lllllllll}
\hline
Partial Autocorrelation Function \tabularnewline
Time lag k & PACF(k) & T-STAT & P-value \tabularnewline
1 & 0.04163 & 0.4326 & 0.333073 \tabularnewline
2 & -0.230257 & -2.3929 & 0.009221 \tabularnewline
3 & -0.439888 & -4.5714 & 6e-06 \tabularnewline
4 & -0.13369 & -1.3893 & 0.083792 \tabularnewline
5 & -0.193741 & -2.0134 & 0.023279 \tabularnewline
6 & 0.118586 & 1.2324 & 0.110242 \tabularnewline
7 & -0.037401 & -0.3887 & 0.349137 \tabularnewline
8 & 0.036812 & 0.3826 & 0.351399 \tabularnewline
9 & -0.280099 & -2.9109 & 0.002189 \tabularnewline
10 & -0.358964 & -3.7305 & 0.000153 \tabularnewline
11 & -0.391872 & -4.0725 & 4.4e-05 \tabularnewline
12 & 0.685964 & 7.1288 & 0 \tabularnewline
13 & -0.208015 & -2.1618 & 0.016422 \tabularnewline
14 & 0.070854 & 0.7363 & 0.231562 \tabularnewline
15 & 0.178748 & 1.8576 & 0.032975 \tabularnewline
16 & -0.038378 & -0.3988 & 0.345402 \tabularnewline
17 & -0.07902 & -0.8212 & 0.206672 \tabularnewline
18 & -0.026352 & -0.2739 & 0.392356 \tabularnewline
19 & 0.020797 & 0.2161 & 0.414647 \tabularnewline
20 & 0.049627 & 0.5157 & 0.303547 \tabularnewline
21 & -0.000988 & -0.0103 & 0.495915 \tabularnewline
22 & 0.063715 & 0.6622 & 0.254643 \tabularnewline
23 & 0.079692 & 0.8282 & 0.204697 \tabularnewline
24 & -0.267846 & -2.7835 & 0.003175 \tabularnewline
25 & 0.015323 & 0.1592 & 0.436888 \tabularnewline
26 & 0.027537 & 0.2862 & 0.387645 \tabularnewline
27 & -0.051432 & -0.5345 & 0.29705 \tabularnewline
28 & 0.006649 & 0.0691 & 0.472521 \tabularnewline
29 & 0.038979 & 0.4051 & 0.34311 \tabularnewline
30 & -0.107093 & -1.1129 & 0.134101 \tabularnewline
31 & -0.061596 & -0.6401 & 0.261723 \tabularnewline
32 & -0.061166 & -0.6357 & 0.263172 \tabularnewline
33 & 0.036252 & 0.3767 & 0.353552 \tabularnewline
34 & -0.046897 & -0.4874 & 0.313493 \tabularnewline
35 & -0.024536 & -0.255 & 0.39961 \tabularnewline
36 & 0.080193 & 0.8334 & 0.203232 \tabularnewline
37 & -0.076237 & -0.7923 & 0.214967 \tabularnewline
38 & -0.042073 & -0.4372 & 0.331408 \tabularnewline
39 & -0.06762 & -0.7027 & 0.241867 \tabularnewline
40 & -0.02127 & -0.221 & 0.412736 \tabularnewline
41 & -0.037645 & -0.3912 & 0.348205 \tabularnewline
42 & -0.047152 & -0.49 & 0.312557 \tabularnewline
43 & 0.016496 & 0.1714 & 0.432102 \tabularnewline
44 & 0.045437 & 0.4722 & 0.318871 \tabularnewline
45 & -0.029071 & -0.3021 & 0.381572 \tabularnewline
46 & -0.032513 & -0.3379 & 0.368054 \tabularnewline
47 & 0.062326 & 0.6477 & 0.259273 \tabularnewline
48 & -0.167356 & -1.7392 & 0.042424 \tabularnewline
\hline
\end{tabular}
%Source: https://freestatistics.org/blog/index.php?pk=123091&T=2

[TABLE]
[ROW][C]Partial Autocorrelation Function[/C][/ROW]
[ROW][C]Time lag k[/C][C]PACF(k)[/C][C]T-STAT[/C][C]P-value[/C][/ROW]
[ROW][C]1[/C][C]0.04163[/C][C]0.4326[/C][C]0.333073[/C][/ROW]
[ROW][C]2[/C][C]-0.230257[/C][C]-2.3929[/C][C]0.009221[/C][/ROW]
[ROW][C]3[/C][C]-0.439888[/C][C]-4.5714[/C][C]6e-06[/C][/ROW]
[ROW][C]4[/C][C]-0.13369[/C][C]-1.3893[/C][C]0.083792[/C][/ROW]
[ROW][C]5[/C][C]-0.193741[/C][C]-2.0134[/C][C]0.023279[/C][/ROW]
[ROW][C]6[/C][C]0.118586[/C][C]1.2324[/C][C]0.110242[/C][/ROW]
[ROW][C]7[/C][C]-0.037401[/C][C]-0.3887[/C][C]0.349137[/C][/ROW]
[ROW][C]8[/C][C]0.036812[/C][C]0.3826[/C][C]0.351399[/C][/ROW]
[ROW][C]9[/C][C]-0.280099[/C][C]-2.9109[/C][C]0.002189[/C][/ROW]
[ROW][C]10[/C][C]-0.358964[/C][C]-3.7305[/C][C]0.000153[/C][/ROW]
[ROW][C]11[/C][C]-0.391872[/C][C]-4.0725[/C][C]4.4e-05[/C][/ROW]
[ROW][C]12[/C][C]0.685964[/C][C]7.1288[/C][C]0[/C][/ROW]
[ROW][C]13[/C][C]-0.208015[/C][C]-2.1618[/C][C]0.016422[/C][/ROW]
[ROW][C]14[/C][C]0.070854[/C][C]0.7363[/C][C]0.231562[/C][/ROW]
[ROW][C]15[/C][C]0.178748[/C][C]1.8576[/C][C]0.032975[/C][/ROW]
[ROW][C]16[/C][C]-0.038378[/C][C]-0.3988[/C][C]0.345402[/C][/ROW]
[ROW][C]17[/C][C]-0.07902[/C][C]-0.8212[/C][C]0.206672[/C][/ROW]
[ROW][C]18[/C][C]-0.026352[/C][C]-0.2739[/C][C]0.392356[/C][/ROW]
[ROW][C]19[/C][C]0.020797[/C][C]0.2161[/C][C]0.414647[/C][/ROW]
[ROW][C]20[/C][C]0.049627[/C][C]0.5157[/C][C]0.303547[/C][/ROW]
[ROW][C]21[/C][C]-0.000988[/C][C]-0.0103[/C][C]0.495915[/C][/ROW]
[ROW][C]22[/C][C]0.063715[/C][C]0.6622[/C][C]0.254643[/C][/ROW]
[ROW][C]23[/C][C]0.079692[/C][C]0.8282[/C][C]0.204697[/C][/ROW]
[ROW][C]24[/C][C]-0.267846[/C][C]-2.7835[/C][C]0.003175[/C][/ROW]
[ROW][C]25[/C][C]0.015323[/C][C]0.1592[/C][C]0.436888[/C][/ROW]
[ROW][C]26[/C][C]0.027537[/C][C]0.2862[/C][C]0.387645[/C][/ROW]
[ROW][C]27[/C][C]-0.051432[/C][C]-0.5345[/C][C]0.29705[/C][/ROW]
[ROW][C]28[/C][C]0.006649[/C][C]0.0691[/C][C]0.472521[/C][/ROW]
[ROW][C]29[/C][C]0.038979[/C][C]0.4051[/C][C]0.34311[/C][/ROW]
[ROW][C]30[/C][C]-0.107093[/C][C]-1.1129[/C][C]0.134101[/C][/ROW]
[ROW][C]31[/C][C]-0.061596[/C][C]-0.6401[/C][C]0.261723[/C][/ROW]
[ROW][C]32[/C][C]-0.061166[/C][C]-0.6357[/C][C]0.263172[/C][/ROW]
[ROW][C]33[/C][C]0.036252[/C][C]0.3767[/C][C]0.353552[/C][/ROW]
[ROW][C]34[/C][C]-0.046897[/C][C]-0.4874[/C][C]0.313493[/C][/ROW]
[ROW][C]35[/C][C]-0.024536[/C][C]-0.255[/C][C]0.39961[/C][/ROW]
[ROW][C]36[/C][C]0.080193[/C][C]0.8334[/C][C]0.203232[/C][/ROW]
[ROW][C]37[/C][C]-0.076237[/C][C]-0.7923[/C][C]0.214967[/C][/ROW]
[ROW][C]38[/C][C]-0.042073[/C][C]-0.4372[/C][C]0.331408[/C][/ROW]
[ROW][C]39[/C][C]-0.06762[/C][C]-0.7027[/C][C]0.241867[/C][/ROW]
[ROW][C]40[/C][C]-0.02127[/C][C]-0.221[/C][C]0.412736[/C][/ROW]
[ROW][C]41[/C][C]-0.037645[/C][C]-0.3912[/C][C]0.348205[/C][/ROW]
[ROW][C]42[/C][C]-0.047152[/C][C]-0.49[/C][C]0.312557[/C][/ROW]
[ROW][C]43[/C][C]0.016496[/C][C]0.1714[/C][C]0.432102[/C][/ROW]
[ROW][C]44[/C][C]0.045437[/C][C]0.4722[/C][C]0.318871[/C][/ROW]
[ROW][C]45[/C][C]-0.029071[/C][C]-0.3021[/C][C]0.381572[/C][/ROW]
[ROW][C]46[/C][C]-0.032513[/C][C]-0.3379[/C][C]0.368054[/C][/ROW]
[ROW][C]47[/C][C]0.062326[/C][C]0.6477[/C][C]0.259273[/C][/ROW]
[ROW][C]48[/C][C]-0.167356[/C][C]-1.7392[/C][C]0.042424[/C][/ROW]
[/TABLE]
Source: https://freestatistics.org/blog/index.php?pk=123091&T=2

Globally Unique Identifier (entire table): ba.freestatistics.org/blog/index.php?pk=123091&T=2

As an alternative you can also use a QR Code:  

The GUIDs for individual cells are displayed in the table below:

Partial Autocorrelation Function
Time lag kPACF(k)T-STATP-value
10.041630.43260.333073
2-0.230257-2.39290.009221
3-0.439888-4.57146e-06
4-0.13369-1.38930.083792
5-0.193741-2.01340.023279
60.1185861.23240.110242
7-0.037401-0.38870.349137
80.0368120.38260.351399
9-0.280099-2.91090.002189
10-0.358964-3.73050.000153
11-0.391872-4.07254.4e-05
120.6859647.12880
13-0.208015-2.16180.016422
140.0708540.73630.231562
150.1787481.85760.032975
16-0.038378-0.39880.345402
17-0.07902-0.82120.206672
18-0.026352-0.27390.392356
190.0207970.21610.414647
200.0496270.51570.303547
21-0.000988-0.01030.495915
220.0637150.66220.254643
230.0796920.82820.204697
24-0.267846-2.78350.003175
250.0153230.15920.436888
260.0275370.28620.387645
27-0.051432-0.53450.29705
280.0066490.06910.472521
290.0389790.40510.34311
30-0.107093-1.11290.134101
31-0.061596-0.64010.261723
32-0.061166-0.63570.263172
330.0362520.37670.353552
34-0.046897-0.48740.313493
35-0.024536-0.2550.39961
360.0801930.83340.203232
37-0.076237-0.79230.214967
38-0.042073-0.43720.331408
39-0.06762-0.70270.241867
40-0.02127-0.2210.412736
41-0.037645-0.39120.348205
42-0.047152-0.490.312557
430.0164960.17140.432102
440.0454370.47220.318871
45-0.029071-0.30210.381572
46-0.032513-0.33790.368054
470.0623260.64770.259273
48-0.167356-1.73920.042424


Parameters (Session):
par1 = 48 ; par2 = 1 ; par3 = 0 ; par4 = 0 ; par5 = 12 ; par6 = White Noise ; par7 = 0.95 ;
Parameters (R input):
par1 = 48 ; par2 = 1 ; par3 = 0 ; par4 = 0 ; par5 = 12 ; par6 = White Noise ; par7 = 0.95 ; par8 = ;
R code (references can be found in the software module):
if (par1 == 'Default') {
par1 = 10*log10(length(x))
} else {
par1 <- as.numeric(par1)
}
par2 <- as.numeric(par2)
par3 <- as.numeric(par3)
par4 <- as.numeric(par4)
par5 <- as.numeric(par5)
if (par6 == 'White Noise') par6 <- 'white' else par6 <- 'ma'
par7 <- as.numeric(par7)
if (par8 != '') par8 <- as.numeric(par8)
ox <- x
if (par8 == '') {
if (par2 == 0) {
x <- log(x)
} else {
x <- (x ^ par2 - 1) / par2
}
} else {
x <- log(x,base=par8)
}
if (par3 > 0) x <- diff(x,lag=1,difference=par3)
if (par4 > 0) x <- diff(x,lag=par5,difference=par4)
bitmap(file='picts.png')
op <- par(mfrow=c(2,1))
plot(ox,type='l',main='Original Time Series',xlab='time',ylab='value')
if (par8=='') {
mytitle <- paste('Working Time Series (lambda=',par2,', d=',par3,', D=',par4,')',sep='')
mysub <- paste('(lambda=',par2,', d=',par3,', D=',par4,', CI=', par7, ', CI type=',par6,')',sep='')
} else {
mytitle <- paste('Working Time Series (base=',par8,', d=',par3,', D=',par4,')',sep='')
mysub <- paste('(base=',par8,', d=',par3,', D=',par4,', CI=', par7, ', CI type=',par6,')',sep='')
}
plot(x,type='l', main=mytitle,xlab='time',ylab='value')
par(op)
dev.off()
bitmap(file='pic1.png')
racf <- acf(x, par1, main='Autocorrelation', xlab='time lag', ylab='ACF', ci.type=par6, ci=par7, sub=mysub)
dev.off()
bitmap(file='pic2.png')
rpacf <- pacf(x,par1,main='Partial Autocorrelation',xlab='lags',ylab='PACF',sub=mysub)
dev.off()
(myacf <- c(racf$acf))
(mypacf <- c(rpacf$acf))
lengthx <- length(x)
sqrtn <- sqrt(lengthx)
load(file='createtable')
a<-table.start()
a<-table.row.start(a)
a<-table.element(a,'Autocorrelation Function',4,TRUE)
a<-table.row.end(a)
a<-table.row.start(a)
a<-table.element(a,'Time lag k',header=TRUE)
a<-table.element(a,hyperlink('basics.htm','ACF(k)','click here for more information about the Autocorrelation Function'),header=TRUE)
a<-table.element(a,'T-STAT',header=TRUE)
a<-table.element(a,'P-value',header=TRUE)
a<-table.row.end(a)
for (i in 2:(par1+1)) {
a<-table.row.start(a)
a<-table.element(a,i-1,header=TRUE)
a<-table.element(a,round(myacf[i],6))
mytstat <- myacf[i]*sqrtn
a<-table.element(a,round(mytstat,4))
a<-table.element(a,round(1-pt(abs(mytstat),lengthx),6))
a<-table.row.end(a)
}
a<-table.end(a)
table.save(a,file='mytable.tab')
a<-table.start()
a<-table.row.start(a)
a<-table.element(a,'Partial Autocorrelation Function',4,TRUE)
a<-table.row.end(a)
a<-table.row.start(a)
a<-table.element(a,'Time lag k',header=TRUE)
a<-table.element(a,hyperlink('basics.htm','PACF(k)','click here for more information about the Partial Autocorrelation Function'),header=TRUE)
a<-table.element(a,'T-STAT',header=TRUE)
a<-table.element(a,'P-value',header=TRUE)
a<-table.row.end(a)
for (i in 1:par1) {
a<-table.row.start(a)
a<-table.element(a,i,header=TRUE)
a<-table.element(a,round(mypacf[i],6))
mytstat <- mypacf[i]*sqrtn
a<-table.element(a,round(mytstat,4))
a<-table.element(a,round(1-pt(abs(mytstat),lengthx),6))
a<-table.row.end(a)
}
a<-table.end(a)
table.save(a,file='mytable1.tab')