Free Statistics

of Irreproducible Research!

Author's title

Author*Unverified author*
R Software Modulerwasp_autocorrelation.wasp
Title produced by software(Partial) Autocorrelation Function
Date of computationWed, 20 Jul 2011 08:40:01 -0400
Cite this page as followsStatistical Computations at FreeStatistics.org, Office for Research Development and Education, URL https://freestatistics.org/blog/index.php?v=date/2011/Jul/20/t13111656298oe63wfn1fsya4k.htm/, Retrieved Thu, 16 May 2024 14:31:16 +0000
Statistical Computations at FreeStatistics.org, Office for Research Development and Education, URL https://freestatistics.org/blog/index.php?pk=123092, Retrieved Thu, 16 May 2024 14:31:16 +0000
QR Codes:

Original text written by user:
IsPrivate?No (this computation is public)
User-defined keywordsLynn Pelgrims
Estimated Impact224
Family? (F = Feedback message, R = changed R code, M = changed R Module, P = changed Parameters, D = changed Data)
-       [(Partial) Autocorrelation Function] [Tijdreeks B - Sta...] [2011-07-20 12:40:01] [cedc01334dbefab590f7f4b747b64ab1] [Current]
Feedback Forum

Post a new message
Dataseries X:
1070
1240
1200
1280
1180
1190
1190
1230
1170
1190
1190
1400
1130
1260
1260
1260
1130
1220
1180
1280
1140
1160
1170
1410
1100
1280
1330
1260
1070
1260
1270
1410
1160
1130
1160
1300
1080
1380
1260
1250
990
1180
1240
1500
1150
1110
1080
1270
1050
1490
1280
1230
960
1100
1270
1530
1290
1120
1100
1310
1020
1510
1260
1160
970
1020
1210
1530
1350
1070
1140
1250
930
1510
1230
1180
960
960
1240
1640
1350
1100
1120
1290
890
1560
1250
1170
900
860
1310
1610
1440
1130
1220
1400
930
1490
1250
1160
910
880
1300
1550
1460
1120
1270
1410


Summary of computational transaction
Raw Inputview raw input (R code)
Raw Outputview raw output of R engine
Computing time1 seconds
R Server'Herman Ole Andreas Wold' @ wold.wessa.net

\begin{tabular}{lllllllll}
\hline
Summary of computational transaction \tabularnewline
Raw Input & view raw input (R code)  \tabularnewline
Raw Output & view raw output of R engine  \tabularnewline
Computing time & 1 seconds \tabularnewline
R Server & 'Herman Ole Andreas Wold' @ wold.wessa.net \tabularnewline
\hline
\end{tabular}
%Source: https://freestatistics.org/blog/index.php?pk=123092&T=0

[TABLE]
[ROW][C]Summary of computational transaction[/C][/ROW]
[ROW][C]Raw Input[/C][C]view raw input (R code) [/C][/ROW]
[ROW][C]Raw Output[/C][C]view raw output of R engine [/C][/ROW]
[ROW][C]Computing time[/C][C]1 seconds[/C][/ROW]
[ROW][C]R Server[/C][C]'Herman Ole Andreas Wold' @ wold.wessa.net[/C][/ROW]
[/TABLE]
Source: https://freestatistics.org/blog/index.php?pk=123092&T=0

Globally Unique Identifier (entire table): ba.freestatistics.org/blog/index.php?pk=123092&T=0

As an alternative you can also use a QR Code:  

The GUIDs for individual cells are displayed in the table below:

Summary of computational transaction
Raw Inputview raw input (R code)
Raw Outputview raw output of R engine
Computing time1 seconds
R Server'Herman Ole Andreas Wold' @ wold.wessa.net


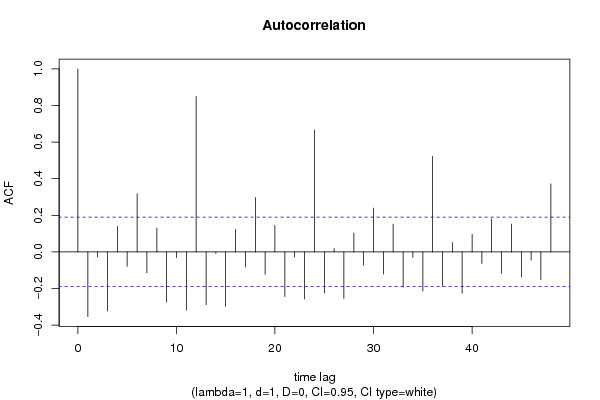
Autocorrelation Function
Time lag kACF(k)T-STATP-value
1-0.353929-3.66110.000196
2-0.027986-0.28950.386382
3-0.323219-3.34340.000571
40.1393811.44180.076144
5-0.078806-0.81520.20839
60.3181923.29140.000675
7-0.11431-1.18240.119827
80.129911.34380.090928
9-0.273839-2.83260.002759
10-0.031174-0.32250.373862
11-0.318875-3.29850.00066
120.8491018.78320
13-0.288443-2.98370.001764
14-0.008243-0.08530.466104
15-0.297737-3.07980.001316
160.122981.27210.103046
17-0.082042-0.84860.198986
180.2971253.07350.001342
19-0.121993-1.26190.104863
200.1445721.49550.068868
21-0.243518-2.5190.006624
22-0.028389-0.29370.384795
23-0.25787-2.66740.004416
240.6668146.89760
25-0.224297-2.32020.011115
260.0182590.18890.425276
27-0.253958-2.6270.00494
280.1025231.06050.145651
29-0.072887-0.75390.226268
300.2395012.47740.007399
31-0.120871-1.25030.106959
320.1519711.5720.059451
33-0.19238-1.990.024571
34-0.029983-0.31010.378527
35-0.213594-2.20940.014638
360.5219695.39930
37-0.187991-1.94460.027224
380.0512380.530.298601
39-0.226237-2.34020.010564
400.0959280.99230.161648
41-0.062682-0.64840.259061
420.1814121.87650.031653
43-0.117114-1.21140.114198
440.1520261.57260.059386
45-0.136795-1.4150.079984
46-0.044807-0.46350.321977
47-0.151282-1.56490.060283
480.3716643.84450.000103

\begin{tabular}{lllllllll}
\hline
Autocorrelation Function \tabularnewline
Time lag k & ACF(k) & T-STAT & P-value \tabularnewline
1 & -0.353929 & -3.6611 & 0.000196 \tabularnewline
2 & -0.027986 & -0.2895 & 0.386382 \tabularnewline
3 & -0.323219 & -3.3434 & 0.000571 \tabularnewline
4 & 0.139381 & 1.4418 & 0.076144 \tabularnewline
5 & -0.078806 & -0.8152 & 0.20839 \tabularnewline
6 & 0.318192 & 3.2914 & 0.000675 \tabularnewline
7 & -0.11431 & -1.1824 & 0.119827 \tabularnewline
8 & 0.12991 & 1.3438 & 0.090928 \tabularnewline
9 & -0.273839 & -2.8326 & 0.002759 \tabularnewline
10 & -0.031174 & -0.3225 & 0.373862 \tabularnewline
11 & -0.318875 & -3.2985 & 0.00066 \tabularnewline
12 & 0.849101 & 8.7832 & 0 \tabularnewline
13 & -0.288443 & -2.9837 & 0.001764 \tabularnewline
14 & -0.008243 & -0.0853 & 0.466104 \tabularnewline
15 & -0.297737 & -3.0798 & 0.001316 \tabularnewline
16 & 0.12298 & 1.2721 & 0.103046 \tabularnewline
17 & -0.082042 & -0.8486 & 0.198986 \tabularnewline
18 & 0.297125 & 3.0735 & 0.001342 \tabularnewline
19 & -0.121993 & -1.2619 & 0.104863 \tabularnewline
20 & 0.144572 & 1.4955 & 0.068868 \tabularnewline
21 & -0.243518 & -2.519 & 0.006624 \tabularnewline
22 & -0.028389 & -0.2937 & 0.384795 \tabularnewline
23 & -0.25787 & -2.6674 & 0.004416 \tabularnewline
24 & 0.666814 & 6.8976 & 0 \tabularnewline
25 & -0.224297 & -2.3202 & 0.011115 \tabularnewline
26 & 0.018259 & 0.1889 & 0.425276 \tabularnewline
27 & -0.253958 & -2.627 & 0.00494 \tabularnewline
28 & 0.102523 & 1.0605 & 0.145651 \tabularnewline
29 & -0.072887 & -0.7539 & 0.226268 \tabularnewline
30 & 0.239501 & 2.4774 & 0.007399 \tabularnewline
31 & -0.120871 & -1.2503 & 0.106959 \tabularnewline
32 & 0.151971 & 1.572 & 0.059451 \tabularnewline
33 & -0.19238 & -1.99 & 0.024571 \tabularnewline
34 & -0.029983 & -0.3101 & 0.378527 \tabularnewline
35 & -0.213594 & -2.2094 & 0.014638 \tabularnewline
36 & 0.521969 & 5.3993 & 0 \tabularnewline
37 & -0.187991 & -1.9446 & 0.027224 \tabularnewline
38 & 0.051238 & 0.53 & 0.298601 \tabularnewline
39 & -0.226237 & -2.3402 & 0.010564 \tabularnewline
40 & 0.095928 & 0.9923 & 0.161648 \tabularnewline
41 & -0.062682 & -0.6484 & 0.259061 \tabularnewline
42 & 0.181412 & 1.8765 & 0.031653 \tabularnewline
43 & -0.117114 & -1.2114 & 0.114198 \tabularnewline
44 & 0.152026 & 1.5726 & 0.059386 \tabularnewline
45 & -0.136795 & -1.415 & 0.079984 \tabularnewline
46 & -0.044807 & -0.4635 & 0.321977 \tabularnewline
47 & -0.151282 & -1.5649 & 0.060283 \tabularnewline
48 & 0.371664 & 3.8445 & 0.000103 \tabularnewline
\hline
\end{tabular}
%Source: https://freestatistics.org/blog/index.php?pk=123092&T=1

[TABLE]
[ROW][C]Autocorrelation Function[/C][/ROW]
[ROW][C]Time lag k[/C][C]ACF(k)[/C][C]T-STAT[/C][C]P-value[/C][/ROW]
[ROW][C]1[/C][C]-0.353929[/C][C]-3.6611[/C][C]0.000196[/C][/ROW]
[ROW][C]2[/C][C]-0.027986[/C][C]-0.2895[/C][C]0.386382[/C][/ROW]
[ROW][C]3[/C][C]-0.323219[/C][C]-3.3434[/C][C]0.000571[/C][/ROW]
[ROW][C]4[/C][C]0.139381[/C][C]1.4418[/C][C]0.076144[/C][/ROW]
[ROW][C]5[/C][C]-0.078806[/C][C]-0.8152[/C][C]0.20839[/C][/ROW]
[ROW][C]6[/C][C]0.318192[/C][C]3.2914[/C][C]0.000675[/C][/ROW]
[ROW][C]7[/C][C]-0.11431[/C][C]-1.1824[/C][C]0.119827[/C][/ROW]
[ROW][C]8[/C][C]0.12991[/C][C]1.3438[/C][C]0.090928[/C][/ROW]
[ROW][C]9[/C][C]-0.273839[/C][C]-2.8326[/C][C]0.002759[/C][/ROW]
[ROW][C]10[/C][C]-0.031174[/C][C]-0.3225[/C][C]0.373862[/C][/ROW]
[ROW][C]11[/C][C]-0.318875[/C][C]-3.2985[/C][C]0.00066[/C][/ROW]
[ROW][C]12[/C][C]0.849101[/C][C]8.7832[/C][C]0[/C][/ROW]
[ROW][C]13[/C][C]-0.288443[/C][C]-2.9837[/C][C]0.001764[/C][/ROW]
[ROW][C]14[/C][C]-0.008243[/C][C]-0.0853[/C][C]0.466104[/C][/ROW]
[ROW][C]15[/C][C]-0.297737[/C][C]-3.0798[/C][C]0.001316[/C][/ROW]
[ROW][C]16[/C][C]0.12298[/C][C]1.2721[/C][C]0.103046[/C][/ROW]
[ROW][C]17[/C][C]-0.082042[/C][C]-0.8486[/C][C]0.198986[/C][/ROW]
[ROW][C]18[/C][C]0.297125[/C][C]3.0735[/C][C]0.001342[/C][/ROW]
[ROW][C]19[/C][C]-0.121993[/C][C]-1.2619[/C][C]0.104863[/C][/ROW]
[ROW][C]20[/C][C]0.144572[/C][C]1.4955[/C][C]0.068868[/C][/ROW]
[ROW][C]21[/C][C]-0.243518[/C][C]-2.519[/C][C]0.006624[/C][/ROW]
[ROW][C]22[/C][C]-0.028389[/C][C]-0.2937[/C][C]0.384795[/C][/ROW]
[ROW][C]23[/C][C]-0.25787[/C][C]-2.6674[/C][C]0.004416[/C][/ROW]
[ROW][C]24[/C][C]0.666814[/C][C]6.8976[/C][C]0[/C][/ROW]
[ROW][C]25[/C][C]-0.224297[/C][C]-2.3202[/C][C]0.011115[/C][/ROW]
[ROW][C]26[/C][C]0.018259[/C][C]0.1889[/C][C]0.425276[/C][/ROW]
[ROW][C]27[/C][C]-0.253958[/C][C]-2.627[/C][C]0.00494[/C][/ROW]
[ROW][C]28[/C][C]0.102523[/C][C]1.0605[/C][C]0.145651[/C][/ROW]
[ROW][C]29[/C][C]-0.072887[/C][C]-0.7539[/C][C]0.226268[/C][/ROW]
[ROW][C]30[/C][C]0.239501[/C][C]2.4774[/C][C]0.007399[/C][/ROW]
[ROW][C]31[/C][C]-0.120871[/C][C]-1.2503[/C][C]0.106959[/C][/ROW]
[ROW][C]32[/C][C]0.151971[/C][C]1.572[/C][C]0.059451[/C][/ROW]
[ROW][C]33[/C][C]-0.19238[/C][C]-1.99[/C][C]0.024571[/C][/ROW]
[ROW][C]34[/C][C]-0.029983[/C][C]-0.3101[/C][C]0.378527[/C][/ROW]
[ROW][C]35[/C][C]-0.213594[/C][C]-2.2094[/C][C]0.014638[/C][/ROW]
[ROW][C]36[/C][C]0.521969[/C][C]5.3993[/C][C]0[/C][/ROW]
[ROW][C]37[/C][C]-0.187991[/C][C]-1.9446[/C][C]0.027224[/C][/ROW]
[ROW][C]38[/C][C]0.051238[/C][C]0.53[/C][C]0.298601[/C][/ROW]
[ROW][C]39[/C][C]-0.226237[/C][C]-2.3402[/C][C]0.010564[/C][/ROW]
[ROW][C]40[/C][C]0.095928[/C][C]0.9923[/C][C]0.161648[/C][/ROW]
[ROW][C]41[/C][C]-0.062682[/C][C]-0.6484[/C][C]0.259061[/C][/ROW]
[ROW][C]42[/C][C]0.181412[/C][C]1.8765[/C][C]0.031653[/C][/ROW]
[ROW][C]43[/C][C]-0.117114[/C][C]-1.2114[/C][C]0.114198[/C][/ROW]
[ROW][C]44[/C][C]0.152026[/C][C]1.5726[/C][C]0.059386[/C][/ROW]
[ROW][C]45[/C][C]-0.136795[/C][C]-1.415[/C][C]0.079984[/C][/ROW]
[ROW][C]46[/C][C]-0.044807[/C][C]-0.4635[/C][C]0.321977[/C][/ROW]
[ROW][C]47[/C][C]-0.151282[/C][C]-1.5649[/C][C]0.060283[/C][/ROW]
[ROW][C]48[/C][C]0.371664[/C][C]3.8445[/C][C]0.000103[/C][/ROW]
[/TABLE]
Source: https://freestatistics.org/blog/index.php?pk=123092&T=1

Globally Unique Identifier (entire table): ba.freestatistics.org/blog/index.php?pk=123092&T=1

As an alternative you can also use a QR Code:  

The GUIDs for individual cells are displayed in the table below:

Autocorrelation Function
Time lag kACF(k)T-STATP-value
1-0.353929-3.66110.000196
2-0.027986-0.28950.386382
3-0.323219-3.34340.000571
40.1393811.44180.076144
5-0.078806-0.81520.20839
60.3181923.29140.000675
7-0.11431-1.18240.119827
80.129911.34380.090928
9-0.273839-2.83260.002759
10-0.031174-0.32250.373862
11-0.318875-3.29850.00066
120.8491018.78320
13-0.288443-2.98370.001764
14-0.008243-0.08530.466104
15-0.297737-3.07980.001316
160.122981.27210.103046
17-0.082042-0.84860.198986
180.2971253.07350.001342
19-0.121993-1.26190.104863
200.1445721.49550.068868
21-0.243518-2.5190.006624
22-0.028389-0.29370.384795
23-0.25787-2.66740.004416
240.6668146.89760
25-0.224297-2.32020.011115
260.0182590.18890.425276
27-0.253958-2.6270.00494
280.1025231.06050.145651
29-0.072887-0.75390.226268
300.2395012.47740.007399
31-0.120871-1.25030.106959
320.1519711.5720.059451
33-0.19238-1.990.024571
34-0.029983-0.31010.378527
35-0.213594-2.20940.014638
360.5219695.39930
37-0.187991-1.94460.027224
380.0512380.530.298601
39-0.226237-2.34020.010564
400.0959280.99230.161648
41-0.062682-0.64840.259061
420.1814121.87650.031653
43-0.117114-1.21140.114198
440.1520261.57260.059386
45-0.136795-1.4150.079984
46-0.044807-0.46350.321977
47-0.151282-1.56490.060283
480.3716643.84450.000103


Partial Autocorrelation Function
Time lag kPACF(k)T-STATP-value
1-0.353929-3.66110.000196
2-0.175198-1.81230.036375
3-0.468067-4.84172e-06
4-0.298399-3.08670.001289
5-0.444377-4.59676e-06
6-0.163668-1.6930.046683
7-0.170304-1.76160.040494
80.1469161.51970.065767
90.135291.39950.082285
100.0017230.01780.492905
11-0.735233-7.60530
120.3116223.22340.00084
130.0242030.25040.401397
14-0.059684-0.61740.269149
150.1650271.7070.045357
160.1347891.39430.083063
170.0070970.07340.470807
18-0.052743-0.54560.293248
19-0.047715-0.49360.311313
200.0025650.02650.48944
21-0.065272-0.67520.25051
22-0.016629-0.1720.431876
230.2178352.25330.01314
24-0.07511-0.77690.219454
25-0.077497-0.80160.212272
260.0186480.19290.423704
27-0.012762-0.1320.447613
28-0.041347-0.42770.334868
290.1147121.18660.119008
300.0472390.48860.313048
31-0.019262-0.19920.421224
32-0.07401-0.76560.222809
330.0287740.29760.383278
34-0.00679-0.07020.472067
35-0.081605-0.84410.200241
360.0850740.880.190412
370.0356680.3690.356444
38-0.010732-0.1110.455909
39-0.057162-0.59130.277788
400.0078150.08080.467859
41-0.028292-0.29260.385178
42-0.081796-0.84610.199692
43-0.006855-0.07090.471803
440.0420510.4350.332228
450.0059410.06140.475558
46-0.080718-0.8350.202801
470.1295481.34010.091534
48-0.083142-0.860.19585

\begin{tabular}{lllllllll}
\hline
Partial Autocorrelation Function \tabularnewline
Time lag k & PACF(k) & T-STAT & P-value \tabularnewline
1 & -0.353929 & -3.6611 & 0.000196 \tabularnewline
2 & -0.175198 & -1.8123 & 0.036375 \tabularnewline
3 & -0.468067 & -4.8417 & 2e-06 \tabularnewline
4 & -0.298399 & -3.0867 & 0.001289 \tabularnewline
5 & -0.444377 & -4.5967 & 6e-06 \tabularnewline
6 & -0.163668 & -1.693 & 0.046683 \tabularnewline
7 & -0.170304 & -1.7616 & 0.040494 \tabularnewline
8 & 0.146916 & 1.5197 & 0.065767 \tabularnewline
9 & 0.13529 & 1.3995 & 0.082285 \tabularnewline
10 & 0.001723 & 0.0178 & 0.492905 \tabularnewline
11 & -0.735233 & -7.6053 & 0 \tabularnewline
12 & 0.311622 & 3.2234 & 0.00084 \tabularnewline
13 & 0.024203 & 0.2504 & 0.401397 \tabularnewline
14 & -0.059684 & -0.6174 & 0.269149 \tabularnewline
15 & 0.165027 & 1.707 & 0.045357 \tabularnewline
16 & 0.134789 & 1.3943 & 0.083063 \tabularnewline
17 & 0.007097 & 0.0734 & 0.470807 \tabularnewline
18 & -0.052743 & -0.5456 & 0.293248 \tabularnewline
19 & -0.047715 & -0.4936 & 0.311313 \tabularnewline
20 & 0.002565 & 0.0265 & 0.48944 \tabularnewline
21 & -0.065272 & -0.6752 & 0.25051 \tabularnewline
22 & -0.016629 & -0.172 & 0.431876 \tabularnewline
23 & 0.217835 & 2.2533 & 0.01314 \tabularnewline
24 & -0.07511 & -0.7769 & 0.219454 \tabularnewline
25 & -0.077497 & -0.8016 & 0.212272 \tabularnewline
26 & 0.018648 & 0.1929 & 0.423704 \tabularnewline
27 & -0.012762 & -0.132 & 0.447613 \tabularnewline
28 & -0.041347 & -0.4277 & 0.334868 \tabularnewline
29 & 0.114712 & 1.1866 & 0.119008 \tabularnewline
30 & 0.047239 & 0.4886 & 0.313048 \tabularnewline
31 & -0.019262 & -0.1992 & 0.421224 \tabularnewline
32 & -0.07401 & -0.7656 & 0.222809 \tabularnewline
33 & 0.028774 & 0.2976 & 0.383278 \tabularnewline
34 & -0.00679 & -0.0702 & 0.472067 \tabularnewline
35 & -0.081605 & -0.8441 & 0.200241 \tabularnewline
36 & 0.085074 & 0.88 & 0.190412 \tabularnewline
37 & 0.035668 & 0.369 & 0.356444 \tabularnewline
38 & -0.010732 & -0.111 & 0.455909 \tabularnewline
39 & -0.057162 & -0.5913 & 0.277788 \tabularnewline
40 & 0.007815 & 0.0808 & 0.467859 \tabularnewline
41 & -0.028292 & -0.2926 & 0.385178 \tabularnewline
42 & -0.081796 & -0.8461 & 0.199692 \tabularnewline
43 & -0.006855 & -0.0709 & 0.471803 \tabularnewline
44 & 0.042051 & 0.435 & 0.332228 \tabularnewline
45 & 0.005941 & 0.0614 & 0.475558 \tabularnewline
46 & -0.080718 & -0.835 & 0.202801 \tabularnewline
47 & 0.129548 & 1.3401 & 0.091534 \tabularnewline
48 & -0.083142 & -0.86 & 0.19585 \tabularnewline
\hline
\end{tabular}
%Source: https://freestatistics.org/blog/index.php?pk=123092&T=2

[TABLE]
[ROW][C]Partial Autocorrelation Function[/C][/ROW]
[ROW][C]Time lag k[/C][C]PACF(k)[/C][C]T-STAT[/C][C]P-value[/C][/ROW]
[ROW][C]1[/C][C]-0.353929[/C][C]-3.6611[/C][C]0.000196[/C][/ROW]
[ROW][C]2[/C][C]-0.175198[/C][C]-1.8123[/C][C]0.036375[/C][/ROW]
[ROW][C]3[/C][C]-0.468067[/C][C]-4.8417[/C][C]2e-06[/C][/ROW]
[ROW][C]4[/C][C]-0.298399[/C][C]-3.0867[/C][C]0.001289[/C][/ROW]
[ROW][C]5[/C][C]-0.444377[/C][C]-4.5967[/C][C]6e-06[/C][/ROW]
[ROW][C]6[/C][C]-0.163668[/C][C]-1.693[/C][C]0.046683[/C][/ROW]
[ROW][C]7[/C][C]-0.170304[/C][C]-1.7616[/C][C]0.040494[/C][/ROW]
[ROW][C]8[/C][C]0.146916[/C][C]1.5197[/C][C]0.065767[/C][/ROW]
[ROW][C]9[/C][C]0.13529[/C][C]1.3995[/C][C]0.082285[/C][/ROW]
[ROW][C]10[/C][C]0.001723[/C][C]0.0178[/C][C]0.492905[/C][/ROW]
[ROW][C]11[/C][C]-0.735233[/C][C]-7.6053[/C][C]0[/C][/ROW]
[ROW][C]12[/C][C]0.311622[/C][C]3.2234[/C][C]0.00084[/C][/ROW]
[ROW][C]13[/C][C]0.024203[/C][C]0.2504[/C][C]0.401397[/C][/ROW]
[ROW][C]14[/C][C]-0.059684[/C][C]-0.6174[/C][C]0.269149[/C][/ROW]
[ROW][C]15[/C][C]0.165027[/C][C]1.707[/C][C]0.045357[/C][/ROW]
[ROW][C]16[/C][C]0.134789[/C][C]1.3943[/C][C]0.083063[/C][/ROW]
[ROW][C]17[/C][C]0.007097[/C][C]0.0734[/C][C]0.470807[/C][/ROW]
[ROW][C]18[/C][C]-0.052743[/C][C]-0.5456[/C][C]0.293248[/C][/ROW]
[ROW][C]19[/C][C]-0.047715[/C][C]-0.4936[/C][C]0.311313[/C][/ROW]
[ROW][C]20[/C][C]0.002565[/C][C]0.0265[/C][C]0.48944[/C][/ROW]
[ROW][C]21[/C][C]-0.065272[/C][C]-0.6752[/C][C]0.25051[/C][/ROW]
[ROW][C]22[/C][C]-0.016629[/C][C]-0.172[/C][C]0.431876[/C][/ROW]
[ROW][C]23[/C][C]0.217835[/C][C]2.2533[/C][C]0.01314[/C][/ROW]
[ROW][C]24[/C][C]-0.07511[/C][C]-0.7769[/C][C]0.219454[/C][/ROW]
[ROW][C]25[/C][C]-0.077497[/C][C]-0.8016[/C][C]0.212272[/C][/ROW]
[ROW][C]26[/C][C]0.018648[/C][C]0.1929[/C][C]0.423704[/C][/ROW]
[ROW][C]27[/C][C]-0.012762[/C][C]-0.132[/C][C]0.447613[/C][/ROW]
[ROW][C]28[/C][C]-0.041347[/C][C]-0.4277[/C][C]0.334868[/C][/ROW]
[ROW][C]29[/C][C]0.114712[/C][C]1.1866[/C][C]0.119008[/C][/ROW]
[ROW][C]30[/C][C]0.047239[/C][C]0.4886[/C][C]0.313048[/C][/ROW]
[ROW][C]31[/C][C]-0.019262[/C][C]-0.1992[/C][C]0.421224[/C][/ROW]
[ROW][C]32[/C][C]-0.07401[/C][C]-0.7656[/C][C]0.222809[/C][/ROW]
[ROW][C]33[/C][C]0.028774[/C][C]0.2976[/C][C]0.383278[/C][/ROW]
[ROW][C]34[/C][C]-0.00679[/C][C]-0.0702[/C][C]0.472067[/C][/ROW]
[ROW][C]35[/C][C]-0.081605[/C][C]-0.8441[/C][C]0.200241[/C][/ROW]
[ROW][C]36[/C][C]0.085074[/C][C]0.88[/C][C]0.190412[/C][/ROW]
[ROW][C]37[/C][C]0.035668[/C][C]0.369[/C][C]0.356444[/C][/ROW]
[ROW][C]38[/C][C]-0.010732[/C][C]-0.111[/C][C]0.455909[/C][/ROW]
[ROW][C]39[/C][C]-0.057162[/C][C]-0.5913[/C][C]0.277788[/C][/ROW]
[ROW][C]40[/C][C]0.007815[/C][C]0.0808[/C][C]0.467859[/C][/ROW]
[ROW][C]41[/C][C]-0.028292[/C][C]-0.2926[/C][C]0.385178[/C][/ROW]
[ROW][C]42[/C][C]-0.081796[/C][C]-0.8461[/C][C]0.199692[/C][/ROW]
[ROW][C]43[/C][C]-0.006855[/C][C]-0.0709[/C][C]0.471803[/C][/ROW]
[ROW][C]44[/C][C]0.042051[/C][C]0.435[/C][C]0.332228[/C][/ROW]
[ROW][C]45[/C][C]0.005941[/C][C]0.0614[/C][C]0.475558[/C][/ROW]
[ROW][C]46[/C][C]-0.080718[/C][C]-0.835[/C][C]0.202801[/C][/ROW]
[ROW][C]47[/C][C]0.129548[/C][C]1.3401[/C][C]0.091534[/C][/ROW]
[ROW][C]48[/C][C]-0.083142[/C][C]-0.86[/C][C]0.19585[/C][/ROW]
[/TABLE]
Source: https://freestatistics.org/blog/index.php?pk=123092&T=2

Globally Unique Identifier (entire table): ba.freestatistics.org/blog/index.php?pk=123092&T=2

As an alternative you can also use a QR Code:  

The GUIDs for individual cells are displayed in the table below:

Partial Autocorrelation Function
Time lag kPACF(k)T-STATP-value
1-0.353929-3.66110.000196
2-0.175198-1.81230.036375
3-0.468067-4.84172e-06
4-0.298399-3.08670.001289
5-0.444377-4.59676e-06
6-0.163668-1.6930.046683
7-0.170304-1.76160.040494
80.1469161.51970.065767
90.135291.39950.082285
100.0017230.01780.492905
11-0.735233-7.60530
120.3116223.22340.00084
130.0242030.25040.401397
14-0.059684-0.61740.269149
150.1650271.7070.045357
160.1347891.39430.083063
170.0070970.07340.470807
18-0.052743-0.54560.293248
19-0.047715-0.49360.311313
200.0025650.02650.48944
21-0.065272-0.67520.25051
22-0.016629-0.1720.431876
230.2178352.25330.01314
24-0.07511-0.77690.219454
25-0.077497-0.80160.212272
260.0186480.19290.423704
27-0.012762-0.1320.447613
28-0.041347-0.42770.334868
290.1147121.18660.119008
300.0472390.48860.313048
31-0.019262-0.19920.421224
32-0.07401-0.76560.222809
330.0287740.29760.383278
34-0.00679-0.07020.472067
35-0.081605-0.84410.200241
360.0850740.880.190412
370.0356680.3690.356444
38-0.010732-0.1110.455909
39-0.057162-0.59130.277788
400.0078150.08080.467859
41-0.028292-0.29260.385178
42-0.081796-0.84610.199692
43-0.006855-0.07090.471803
440.0420510.4350.332228
450.0059410.06140.475558
46-0.080718-0.8350.202801
470.1295481.34010.091534
48-0.083142-0.860.19585


Parameters (Session):
par1 = 48 ; par2 = 1 ; par3 = 1 ; par4 = 0 ; par5 = 12 ; par6 = White Noise ; par7 = 0.95 ;
Parameters (R input):
par1 = 48 ; par2 = 1 ; par3 = 1 ; par4 = 0 ; par5 = 12 ; par6 = White Noise ; par7 = 0.95 ; par8 = ;
R code (references can be found in the software module):
if (par1 == 'Default') {
par1 = 10*log10(length(x))
} else {
par1 <- as.numeric(par1)
}
par2 <- as.numeric(par2)
par3 <- as.numeric(par3)
par4 <- as.numeric(par4)
par5 <- as.numeric(par5)
if (par6 == 'White Noise') par6 <- 'white' else par6 <- 'ma'
par7 <- as.numeric(par7)
if (par8 != '') par8 <- as.numeric(par8)
ox <- x
if (par8 == '') {
if (par2 == 0) {
x <- log(x)
} else {
x <- (x ^ par2 - 1) / par2
}
} else {
x <- log(x,base=par8)
}
if (par3 > 0) x <- diff(x,lag=1,difference=par3)
if (par4 > 0) x <- diff(x,lag=par5,difference=par4)
bitmap(file='picts.png')
op <- par(mfrow=c(2,1))
plot(ox,type='l',main='Original Time Series',xlab='time',ylab='value')
if (par8=='') {
mytitle <- paste('Working Time Series (lambda=',par2,', d=',par3,', D=',par4,')',sep='')
mysub <- paste('(lambda=',par2,', d=',par3,', D=',par4,', CI=', par7, ', CI type=',par6,')',sep='')
} else {
mytitle <- paste('Working Time Series (base=',par8,', d=',par3,', D=',par4,')',sep='')
mysub <- paste('(base=',par8,', d=',par3,', D=',par4,', CI=', par7, ', CI type=',par6,')',sep='')
}
plot(x,type='l', main=mytitle,xlab='time',ylab='value')
par(op)
dev.off()
bitmap(file='pic1.png')
racf <- acf(x, par1, main='Autocorrelation', xlab='time lag', ylab='ACF', ci.type=par6, ci=par7, sub=mysub)
dev.off()
bitmap(file='pic2.png')
rpacf <- pacf(x,par1,main='Partial Autocorrelation',xlab='lags',ylab='PACF',sub=mysub)
dev.off()
(myacf <- c(racf$acf))
(mypacf <- c(rpacf$acf))
lengthx <- length(x)
sqrtn <- sqrt(lengthx)
load(file='createtable')
a<-table.start()
a<-table.row.start(a)
a<-table.element(a,'Autocorrelation Function',4,TRUE)
a<-table.row.end(a)
a<-table.row.start(a)
a<-table.element(a,'Time lag k',header=TRUE)
a<-table.element(a,hyperlink('basics.htm','ACF(k)','click here for more information about the Autocorrelation Function'),header=TRUE)
a<-table.element(a,'T-STAT',header=TRUE)
a<-table.element(a,'P-value',header=TRUE)
a<-table.row.end(a)
for (i in 2:(par1+1)) {
a<-table.row.start(a)
a<-table.element(a,i-1,header=TRUE)
a<-table.element(a,round(myacf[i],6))
mytstat <- myacf[i]*sqrtn
a<-table.element(a,round(mytstat,4))
a<-table.element(a,round(1-pt(abs(mytstat),lengthx),6))
a<-table.row.end(a)
}
a<-table.end(a)
table.save(a,file='mytable.tab')
a<-table.start()
a<-table.row.start(a)
a<-table.element(a,'Partial Autocorrelation Function',4,TRUE)
a<-table.row.end(a)
a<-table.row.start(a)
a<-table.element(a,'Time lag k',header=TRUE)
a<-table.element(a,hyperlink('basics.htm','PACF(k)','click here for more information about the Partial Autocorrelation Function'),header=TRUE)
a<-table.element(a,'T-STAT',header=TRUE)
a<-table.element(a,'P-value',header=TRUE)
a<-table.row.end(a)
for (i in 1:par1) {
a<-table.row.start(a)
a<-table.element(a,i,header=TRUE)
a<-table.element(a,round(mypacf[i],6))
mytstat <- mypacf[i]*sqrtn
a<-table.element(a,round(mytstat,4))
a<-table.element(a,round(1-pt(abs(mytstat),lengthx),6))
a<-table.row.end(a)
}
a<-table.end(a)
table.save(a,file='mytable1.tab')