Free Statistics

of Irreproducible Research!

Author's title

Author*Unverified author*
R Software Modulerwasp_smp.wasp
Title produced by softwareStandard Deviation-Mean Plot
Date of computationWed, 20 Jul 2011 09:07:19 -0400
Cite this page as followsStatistical Computations at FreeStatistics.org, Office for Research Development and Education, URL https://freestatistics.org/blog/index.php?v=date/2011/Jul/20/t1311167274n1j4m4t9crpzkwm.htm/, Retrieved Thu, 16 May 2024 20:55:22 +0000
Statistical Computations at FreeStatistics.org, Office for Research Development and Education, URL https://freestatistics.org/blog/index.php?pk=123094, Retrieved Thu, 16 May 2024 20:55:22 +0000
QR Codes:

Original text written by user:
IsPrivate?No (this computation is public)
User-defined keywordsLynn Pelgrims
Estimated Impact229
Family? (F = Feedback message, R = changed R code, M = changed R Module, P = changed Parameters, D = changed Data)
-       [Standard Deviation-Mean Plot] [Tijdreeks B - Sta...] [2011-07-20 13:07:19] [cedc01334dbefab590f7f4b747b64ab1] [Current]
Feedback Forum

Post a new message
Dataseries X:
1070
1240
1200
1280
1180
1190
1190
1230
1170
1190
1190
1400
1130
1260
1260
1260
1130
1220
1180
1280
1140
1160
1170
1410
1100
1280
1330
1260
1070
1260
1270
1410
1160
1130
1160
1300
1080
1380
1260
1250
990
1180
1240
1500
1150
1110
1080
1270
1050
1490
1280
1230
960
1100
1270
1530
1290
1120
1100
1310
1020
1510
1260
1160
970
1020
1210
1530
1350
1070
1140
1250
930
1510
1230
1180
960
960
1240
1640
1350
1100
1120
1290
890
1560
1250
1170
900
860
1310
1610
1440
1130
1220
1400
930
1490
1250
1160
910
880
1300
1550
1460
1120
1270
1410


Summary of computational transaction
Raw Inputview raw input (R code)
Raw Outputview raw output of R engine
Computing time1 seconds
R Server'Gertrude Mary Cox' @ cox.wessa.net

\begin{tabular}{lllllllll}
\hline
Summary of computational transaction \tabularnewline
Raw Input & view raw input (R code)  \tabularnewline
Raw Output & view raw output of R engine  \tabularnewline
Computing time & 1 seconds \tabularnewline
R Server & 'Gertrude Mary Cox' @ cox.wessa.net \tabularnewline
\hline
\end{tabular}
%Source: https://freestatistics.org/blog/index.php?pk=123094&T=0

[TABLE]
[ROW][C]Summary of computational transaction[/C][/ROW]
[ROW][C]Raw Input[/C][C]view raw input (R code) [/C][/ROW]
[ROW][C]Raw Output[/C][C]view raw output of R engine [/C][/ROW]
[ROW][C]Computing time[/C][C]1 seconds[/C][/ROW]
[ROW][C]R Server[/C][C]'Gertrude Mary Cox' @ cox.wessa.net[/C][/ROW]
[/TABLE]
Source: https://freestatistics.org/blog/index.php?pk=123094&T=0

Globally Unique Identifier (entire table): ba.freestatistics.org/blog/index.php?pk=123094&T=0

As an alternative you can also use a QR Code:  

The GUIDs for individual cells are displayed in the table below:

Summary of computational transaction
Raw Inputview raw input (R code)
Raw Outputview raw output of R engine
Computing time1 seconds
R Server'Gertrude Mary Cox' @ cox.wessa.net


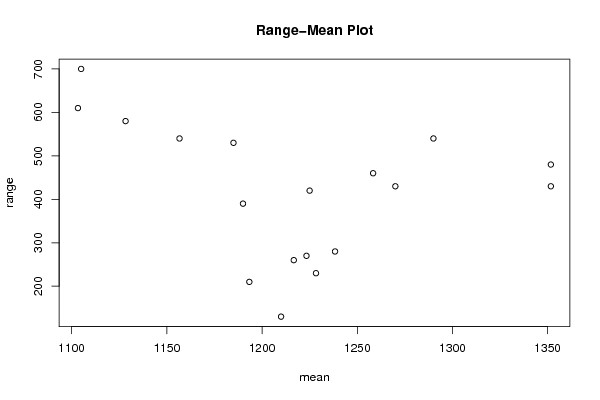
Standard Deviation-Mean Plot
SectionMeanStandard DeviationRange
11193.3333333333370.8989891794422210
21228.3333333333386.3519928355256230
3121063.8748776906852130
41223.33333333333103.666130759601270
51216.66666666667105.577775439089260
61238.33333333333107.966044044721280
71190139.140217047409390
81225153.460092532228420
91185189.81570008827530
101270155.56349186104430
111156.66666666667203.829994521578540
121258.33333333333163.757951460888460
131128.33333333333225.691529895711580
141290196.773982019982540
151105275.88040887312700
161351.66666666667170.342791648683480
171103.33333333333241.467734214463610
181351.66666666667153.286224647444430

\begin{tabular}{lllllllll}
\hline
Standard Deviation-Mean Plot \tabularnewline
Section & Mean & Standard Deviation & Range \tabularnewline
1 & 1193.33333333333 & 70.8989891794422 & 210 \tabularnewline
2 & 1228.33333333333 & 86.3519928355256 & 230 \tabularnewline
3 & 1210 & 63.8748776906852 & 130 \tabularnewline
4 & 1223.33333333333 & 103.666130759601 & 270 \tabularnewline
5 & 1216.66666666667 & 105.577775439089 & 260 \tabularnewline
6 & 1238.33333333333 & 107.966044044721 & 280 \tabularnewline
7 & 1190 & 139.140217047409 & 390 \tabularnewline
8 & 1225 & 153.460092532228 & 420 \tabularnewline
9 & 1185 & 189.81570008827 & 530 \tabularnewline
10 & 1270 & 155.56349186104 & 430 \tabularnewline
11 & 1156.66666666667 & 203.829994521578 & 540 \tabularnewline
12 & 1258.33333333333 & 163.757951460888 & 460 \tabularnewline
13 & 1128.33333333333 & 225.691529895711 & 580 \tabularnewline
14 & 1290 & 196.773982019982 & 540 \tabularnewline
15 & 1105 & 275.88040887312 & 700 \tabularnewline
16 & 1351.66666666667 & 170.342791648683 & 480 \tabularnewline
17 & 1103.33333333333 & 241.467734214463 & 610 \tabularnewline
18 & 1351.66666666667 & 153.286224647444 & 430 \tabularnewline
\hline
\end{tabular}
%Source: https://freestatistics.org/blog/index.php?pk=123094&T=1

[TABLE]
[ROW][C]Standard Deviation-Mean Plot[/C][/ROW]
[ROW][C]Section[/C][C]Mean[/C][C]Standard Deviation[/C][C]Range[/C][/ROW]
[ROW][C]1[/C][C]1193.33333333333[/C][C]70.8989891794422[/C][C]210[/C][/ROW]
[ROW][C]2[/C][C]1228.33333333333[/C][C]86.3519928355256[/C][C]230[/C][/ROW]
[ROW][C]3[/C][C]1210[/C][C]63.8748776906852[/C][C]130[/C][/ROW]
[ROW][C]4[/C][C]1223.33333333333[/C][C]103.666130759601[/C][C]270[/C][/ROW]
[ROW][C]5[/C][C]1216.66666666667[/C][C]105.577775439089[/C][C]260[/C][/ROW]
[ROW][C]6[/C][C]1238.33333333333[/C][C]107.966044044721[/C][C]280[/C][/ROW]
[ROW][C]7[/C][C]1190[/C][C]139.140217047409[/C][C]390[/C][/ROW]
[ROW][C]8[/C][C]1225[/C][C]153.460092532228[/C][C]420[/C][/ROW]
[ROW][C]9[/C][C]1185[/C][C]189.81570008827[/C][C]530[/C][/ROW]
[ROW][C]10[/C][C]1270[/C][C]155.56349186104[/C][C]430[/C][/ROW]
[ROW][C]11[/C][C]1156.66666666667[/C][C]203.829994521578[/C][C]540[/C][/ROW]
[ROW][C]12[/C][C]1258.33333333333[/C][C]163.757951460888[/C][C]460[/C][/ROW]
[ROW][C]13[/C][C]1128.33333333333[/C][C]225.691529895711[/C][C]580[/C][/ROW]
[ROW][C]14[/C][C]1290[/C][C]196.773982019982[/C][C]540[/C][/ROW]
[ROW][C]15[/C][C]1105[/C][C]275.88040887312[/C][C]700[/C][/ROW]
[ROW][C]16[/C][C]1351.66666666667[/C][C]170.342791648683[/C][C]480[/C][/ROW]
[ROW][C]17[/C][C]1103.33333333333[/C][C]241.467734214463[/C][C]610[/C][/ROW]
[ROW][C]18[/C][C]1351.66666666667[/C][C]153.286224647444[/C][C]430[/C][/ROW]
[/TABLE]
Source: https://freestatistics.org/blog/index.php?pk=123094&T=1

Globally Unique Identifier (entire table): ba.freestatistics.org/blog/index.php?pk=123094&T=1

As an alternative you can also use a QR Code:  

The GUIDs for individual cells are displayed in the table below:

Standard Deviation-Mean Plot
SectionMeanStandard DeviationRange
11193.3333333333370.8989891794422210
21228.3333333333386.3519928355256230
3121063.8748776906852130
41223.33333333333103.666130759601270
51216.66666666667105.577775439089260
61238.33333333333107.966044044721280
71190139.140217047409390
81225153.460092532228420
91185189.81570008827530
101270155.56349186104430
111156.66666666667203.829994521578540
121258.33333333333163.757951460888460
131128.33333333333225.691529895711580
141290196.773982019982540
151105275.88040887312700
161351.66666666667170.342791648683480
171103.33333333333241.467734214463610
181351.66666666667153.286224647444430


Regression: S.E.(k) = alpha + beta * Mean(k)
alpha544.704916750318
beta-0.319149034104714
S.D.0.193500682316626
T-STAT-1.64934319757327
p-value0.118569042314173

\begin{tabular}{lllllllll}
\hline
Regression: S.E.(k) = alpha + beta * Mean(k) \tabularnewline
alpha & 544.704916750318 \tabularnewline
beta & -0.319149034104714 \tabularnewline
S.D. & 0.193500682316626 \tabularnewline
T-STAT & -1.64934319757327 \tabularnewline
p-value & 0.118569042314173 \tabularnewline
\hline
\end{tabular}
%Source: https://freestatistics.org/blog/index.php?pk=123094&T=2

[TABLE]
[ROW][C]Regression: S.E.(k) = alpha + beta * Mean(k)[/C][/ROW]
[ROW][C]alpha[/C][C]544.704916750318[/C][/ROW]
[ROW][C]beta[/C][C]-0.319149034104714[/C][/ROW]
[ROW][C]S.D.[/C][C]0.193500682316626[/C][/ROW]
[ROW][C]T-STAT[/C][C]-1.64934319757327[/C][/ROW]
[ROW][C]p-value[/C][C]0.118569042314173[/C][/ROW]
[/TABLE]
Source: https://freestatistics.org/blog/index.php?pk=123094&T=2

Globally Unique Identifier (entire table): ba.freestatistics.org/blog/index.php?pk=123094&T=2

As an alternative you can also use a QR Code:  

The GUIDs for individual cells are displayed in the table below:

Regression: S.E.(k) = alpha + beta * Mean(k)
alpha544.704916750318
beta-0.319149034104714
S.D.0.193500682316626
T-STAT-1.64934319757327
p-value0.118569042314173


Regression: ln S.E.(k) = alpha + beta * ln Mean(k)
alpha19.0177720186245
beta-1.97718204437322
S.D.1.72063567891552
T-STAT-1.14909975923514
p-value0.267403381168593
Lambda2.97718204437322

\begin{tabular}{lllllllll}
\hline
Regression: ln S.E.(k) = alpha + beta * ln Mean(k) \tabularnewline
alpha & 19.0177720186245 \tabularnewline
beta & -1.97718204437322 \tabularnewline
S.D. & 1.72063567891552 \tabularnewline
T-STAT & -1.14909975923514 \tabularnewline
p-value & 0.267403381168593 \tabularnewline
Lambda & 2.97718204437322 \tabularnewline
\hline
\end{tabular}
%Source: https://freestatistics.org/blog/index.php?pk=123094&T=3

[TABLE]
[ROW][C]Regression: ln S.E.(k) = alpha + beta * ln Mean(k)[/C][/ROW]
[ROW][C]alpha[/C][C]19.0177720186245[/C][/ROW]
[ROW][C]beta[/C][C]-1.97718204437322[/C][/ROW]
[ROW][C]S.D.[/C][C]1.72063567891552[/C][/ROW]
[ROW][C]T-STAT[/C][C]-1.14909975923514[/C][/ROW]
[ROW][C]p-value[/C][C]0.267403381168593[/C][/ROW]
[ROW][C]Lambda[/C][C]2.97718204437322[/C][/ROW]
[/TABLE]
Source: https://freestatistics.org/blog/index.php?pk=123094&T=3

Globally Unique Identifier (entire table): ba.freestatistics.org/blog/index.php?pk=123094&T=3

As an alternative you can also use a QR Code:  

The GUIDs for individual cells are displayed in the table below:

Regression: ln S.E.(k) = alpha + beta * ln Mean(k)
alpha19.0177720186245
beta-1.97718204437322
S.D.1.72063567891552
T-STAT-1.14909975923514
p-value0.267403381168593
Lambda2.97718204437322


Parameters (Session):
par1 = 6 ;
Parameters (R input):
par1 = 6 ;
R code (references can be found in the software module):
par1 <- as.numeric(par1)
(n <- length(x))
(np <- floor(n / par1))
arr <- array(NA,dim=c(par1,np))
j <- 0
k <- 1
for (i in 1:(np*par1))
{
j = j + 1
arr[j,k] <- x[i]
if (j == par1) {
j = 0
k=k+1
}
}
arr
arr.mean <- array(NA,dim=np)
arr.sd <- array(NA,dim=np)
arr.range <- array(NA,dim=np)
for (j in 1:np)
{
arr.mean[j] <- mean(arr[,j],na.rm=TRUE)
arr.sd[j] <- sd(arr[,j],na.rm=TRUE)
arr.range[j] <- max(arr[,j],na.rm=TRUE) - min(arr[,j],na.rm=TRUE)
}
arr.mean
arr.sd
arr.range
(lm1 <- lm(arr.sd~arr.mean))
(lnlm1 <- lm(log(arr.sd)~log(arr.mean)))
(lm2 <- lm(arr.range~arr.mean))
bitmap(file='test1.png')
plot(arr.mean,arr.sd,main='Standard Deviation-Mean Plot',xlab='mean',ylab='standard deviation')
dev.off()
bitmap(file='test2.png')
plot(arr.mean,arr.range,main='Range-Mean Plot',xlab='mean',ylab='range')
dev.off()
load(file='createtable')
a<-table.start()
a<-table.row.start(a)
a<-table.element(a,'Standard Deviation-Mean Plot',4,TRUE)
a<-table.row.end(a)
a<-table.row.start(a)
a<-table.element(a,'Section',header=TRUE)
a<-table.element(a,'Mean',header=TRUE)
a<-table.element(a,'Standard Deviation',header=TRUE)
a<-table.element(a,'Range',header=TRUE)
a<-table.row.end(a)
for (j in 1:np) {
a<-table.row.start(a)
a<-table.element(a,j,header=TRUE)
a<-table.element(a,arr.mean[j])
a<-table.element(a,arr.sd[j] )
a<-table.element(a,arr.range[j] )
a<-table.row.end(a)
}
a<-table.end(a)
table.save(a,file='mytable.tab')
a<-table.start()
a<-table.row.start(a)
a<-table.element(a,'Regression: S.E.(k) = alpha + beta * Mean(k)',2,TRUE)
a<-table.row.end(a)
a<-table.row.start(a)
a<-table.element(a,'alpha',header=TRUE)
a<-table.element(a,lm1$coefficients[[1]])
a<-table.row.end(a)
a<-table.row.start(a)
a<-table.element(a,'beta',header=TRUE)
a<-table.element(a,lm1$coefficients[[2]])
a<-table.row.end(a)
a<-table.row.start(a)
a<-table.element(a,'S.D.',header=TRUE)
a<-table.element(a,summary(lm1)$coefficients[2,2])
a<-table.row.end(a)
a<-table.row.start(a)
a<-table.element(a,'T-STAT',header=TRUE)
a<-table.element(a,summary(lm1)$coefficients[2,3])
a<-table.row.end(a)
a<-table.row.start(a)
a<-table.element(a,'p-value',header=TRUE)
a<-table.element(a,summary(lm1)$coefficients[2,4])
a<-table.row.end(a)
a<-table.end(a)
table.save(a,file='mytable1.tab')
a<-table.start()
a<-table.row.start(a)
a<-table.element(a,'Regression: ln S.E.(k) = alpha + beta * ln Mean(k)',2,TRUE)
a<-table.row.end(a)
a<-table.row.start(a)
a<-table.element(a,'alpha',header=TRUE)
a<-table.element(a,lnlm1$coefficients[[1]])
a<-table.row.end(a)
a<-table.row.start(a)
a<-table.element(a,'beta',header=TRUE)
a<-table.element(a,lnlm1$coefficients[[2]])
a<-table.row.end(a)
a<-table.row.start(a)
a<-table.element(a,'S.D.',header=TRUE)
a<-table.element(a,summary(lnlm1)$coefficients[2,2])
a<-table.row.end(a)
a<-table.row.start(a)
a<-table.element(a,'T-STAT',header=TRUE)
a<-table.element(a,summary(lnlm1)$coefficients[2,3])
a<-table.row.end(a)
a<-table.row.start(a)
a<-table.element(a,'p-value',header=TRUE)
a<-table.element(a,summary(lnlm1)$coefficients[2,4])
a<-table.row.end(a)
a<-table.row.start(a)
a<-table.element(a,'Lambda',header=TRUE)
a<-table.element(a,1-lnlm1$coefficients[[2]])
a<-table.row.end(a)
a<-table.end(a)
table.save(a,file='mytable2.tab')