Free Statistics

of Irreproducible Research!

Author's title

Author*Unverified author*
R Software Modulerwasp_autocorrelation.wasp
Title produced by software(Partial) Autocorrelation Function
Date of computationTue, 26 Jul 2011 09:20:54 -0400
Cite this page as followsStatistical Computations at FreeStatistics.org, Office for Research Development and Education, URL https://freestatistics.org/blog/index.php?v=date/2011/Jul/26/t1311690060id72i367qn1bew8.htm/, Retrieved Thu, 16 May 2024 22:07:52 +0000
Statistical Computations at FreeStatistics.org, Office for Research Development and Education, URL https://freestatistics.org/blog/index.php?pk=123152, Retrieved Thu, 16 May 2024 22:07:52 +0000
QR Codes:

Original text written by user:
IsPrivate?No (this computation is public)
User-defined keywordsThomas Schroeven
Estimated Impact156
Family? (F = Feedback message, R = changed R code, M = changed R Module, P = changed Parameters, D = changed Data)
-       [(Partial) Autocorrelation Function] [Tijdreeks 2 - Sta...] [2011-07-26 13:20:54] [1757923712b2aedbf315e1364d6f70a4] [Current]
Feedback Forum

Post a new message
Dataseries X:
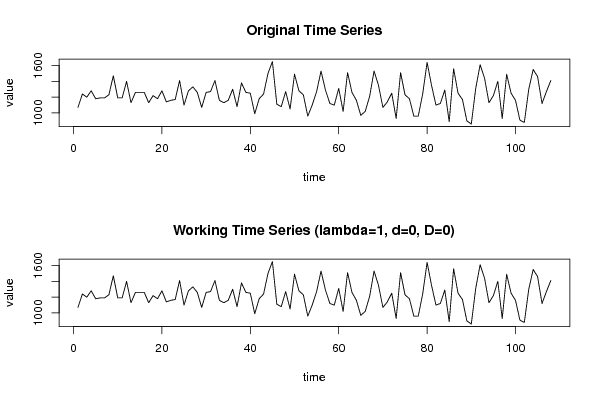
1070
1240
1200
1280
1180
1190
1190
1230
1470
1190
1190
1400
1130
1260
1260
1260
1130
1220
1180
1280
1140
1160
1170
1410
1100
1280
1330
1260
1070
1260
1270
1410
1160
1130
1160
1300
1080
1380
1260
1250
990
1180
1240
1500
1650
1110
1080
1270
1050
1490
1280
1230
960
1100
1270
1530
1290
1120
1100
1310
1020
1510
1260
1160
970
1020
1210
1530
1350
1070
1140
1250
930
1510
1230
1180
960
960
1240
1640
1350
1100
1120
1290
890
1560
1250
1170
900
860
1310
1610
1440
1130
1220
1400
930
1490
1250
1160
910
880
1300
1550
1460
1120
1270
1410


Summary of computational transaction
Raw Inputview raw input (R code)
Raw Outputview raw output of R engine
Computing time12 seconds
R Server'AstonUniversity' @ aston.wessa.net

\begin{tabular}{lllllllll}
\hline
Summary of computational transaction \tabularnewline
Raw Input & view raw input (R code)  \tabularnewline
Raw Output & view raw output of R engine  \tabularnewline
Computing time & 12 seconds \tabularnewline
R Server & 'AstonUniversity' @ aston.wessa.net \tabularnewline
\hline
\end{tabular}
%Source: https://freestatistics.org/blog/index.php?pk=123152&T=0

[TABLE]
[ROW][C]Summary of computational transaction[/C][/ROW]
[ROW][C]Raw Input[/C][C]view raw input (R code) [/C][/ROW]
[ROW][C]Raw Output[/C][C]view raw output of R engine [/C][/ROW]
[ROW][C]Computing time[/C][C]12 seconds[/C][/ROW]
[ROW][C]R Server[/C][C]'AstonUniversity' @ aston.wessa.net[/C][/ROW]
[/TABLE]
Source: https://freestatistics.org/blog/index.php?pk=123152&T=0

Globally Unique Identifier (entire table): ba.freestatistics.org/blog/index.php?pk=123152&T=0

As an alternative you can also use a QR Code:  

The GUIDs for individual cells are displayed in the table below:

Summary of computational transaction
Raw Inputview raw input (R code)
Raw Outputview raw output of R engine
Computing time12 seconds
R Server'AstonUniversity' @ aston.wessa.net


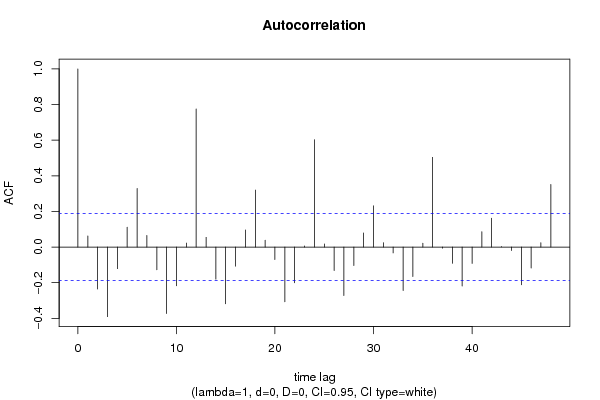
Autocorrelation Function
Time lag kACF(k)T-STATP-value
10.0621490.64590.259867
2-0.23612-2.45380.007866
3-0.390667-4.05994.7e-05
4-0.121132-1.25880.105401
50.1112511.15620.125084
60.3294243.42350.000437
70.0650220.67570.250329
8-0.12795-1.32970.093211
9-0.372702-3.87329.2e-05
10-0.217482-2.26010.012909
110.0223360.23210.408439
120.7751448.05550
130.0545810.56720.285868
14-0.180285-1.87360.031846
15-0.318719-3.31220.00063
16-0.107158-1.11360.133958
170.0958110.99570.160811
180.3197223.32260.000609
190.0386890.40210.344213
20-0.070021-0.72770.234194
21-0.307453-3.19510.000916
22-0.200298-2.08160.019873
230.0066610.06920.472472
240.6024016.26030
250.0174780.18160.428103
26-0.132219-1.37410.086135
27-0.272435-2.83120.002766
28-0.103461-1.07520.142341
290.0796720.8280.204755
300.2313572.40430.008952
310.0241760.25120.401053
32-0.032779-0.34070.367013
33-0.244398-2.53990.006256
34-0.165094-1.71570.044542
350.0213320.22170.412489
360.5036685.23430
37-0.006037-0.06270.475045
38-0.091123-0.9470.172883
39-0.218379-2.26950.012613
40-0.091766-0.95370.171193
410.0856850.89050.187597
420.161651.67990.047932
430.0011470.01190.495255
44-0.019737-0.20510.418936
45-0.212135-2.20460.014803
46-0.11759-1.2220.112179
470.0247240.25690.398859
480.3514393.65230.000201

\begin{tabular}{lllllllll}
\hline
Autocorrelation Function \tabularnewline
Time lag k & ACF(k) & T-STAT & P-value \tabularnewline
1 & 0.062149 & 0.6459 & 0.259867 \tabularnewline
2 & -0.23612 & -2.4538 & 0.007866 \tabularnewline
3 & -0.390667 & -4.0599 & 4.7e-05 \tabularnewline
4 & -0.121132 & -1.2588 & 0.105401 \tabularnewline
5 & 0.111251 & 1.1562 & 0.125084 \tabularnewline
6 & 0.329424 & 3.4235 & 0.000437 \tabularnewline
7 & 0.065022 & 0.6757 & 0.250329 \tabularnewline
8 & -0.12795 & -1.3297 & 0.093211 \tabularnewline
9 & -0.372702 & -3.8732 & 9.2e-05 \tabularnewline
10 & -0.217482 & -2.2601 & 0.012909 \tabularnewline
11 & 0.022336 & 0.2321 & 0.408439 \tabularnewline
12 & 0.775144 & 8.0555 & 0 \tabularnewline
13 & 0.054581 & 0.5672 & 0.285868 \tabularnewline
14 & -0.180285 & -1.8736 & 0.031846 \tabularnewline
15 & -0.318719 & -3.3122 & 0.00063 \tabularnewline
16 & -0.107158 & -1.1136 & 0.133958 \tabularnewline
17 & 0.095811 & 0.9957 & 0.160811 \tabularnewline
18 & 0.319722 & 3.3226 & 0.000609 \tabularnewline
19 & 0.038689 & 0.4021 & 0.344213 \tabularnewline
20 & -0.070021 & -0.7277 & 0.234194 \tabularnewline
21 & -0.307453 & -3.1951 & 0.000916 \tabularnewline
22 & -0.200298 & -2.0816 & 0.019873 \tabularnewline
23 & 0.006661 & 0.0692 & 0.472472 \tabularnewline
24 & 0.602401 & 6.2603 & 0 \tabularnewline
25 & 0.017478 & 0.1816 & 0.428103 \tabularnewline
26 & -0.132219 & -1.3741 & 0.086135 \tabularnewline
27 & -0.272435 & -2.8312 & 0.002766 \tabularnewline
28 & -0.103461 & -1.0752 & 0.142341 \tabularnewline
29 & 0.079672 & 0.828 & 0.204755 \tabularnewline
30 & 0.231357 & 2.4043 & 0.008952 \tabularnewline
31 & 0.024176 & 0.2512 & 0.401053 \tabularnewline
32 & -0.032779 & -0.3407 & 0.367013 \tabularnewline
33 & -0.244398 & -2.5399 & 0.006256 \tabularnewline
34 & -0.165094 & -1.7157 & 0.044542 \tabularnewline
35 & 0.021332 & 0.2217 & 0.412489 \tabularnewline
36 & 0.503668 & 5.2343 & 0 \tabularnewline
37 & -0.006037 & -0.0627 & 0.475045 \tabularnewline
38 & -0.091123 & -0.947 & 0.172883 \tabularnewline
39 & -0.218379 & -2.2695 & 0.012613 \tabularnewline
40 & -0.091766 & -0.9537 & 0.171193 \tabularnewline
41 & 0.085685 & 0.8905 & 0.187597 \tabularnewline
42 & 0.16165 & 1.6799 & 0.047932 \tabularnewline
43 & 0.001147 & 0.0119 & 0.495255 \tabularnewline
44 & -0.019737 & -0.2051 & 0.418936 \tabularnewline
45 & -0.212135 & -2.2046 & 0.014803 \tabularnewline
46 & -0.11759 & -1.222 & 0.112179 \tabularnewline
47 & 0.024724 & 0.2569 & 0.398859 \tabularnewline
48 & 0.351439 & 3.6523 & 0.000201 \tabularnewline
\hline
\end{tabular}
%Source: https://freestatistics.org/blog/index.php?pk=123152&T=1

[TABLE]
[ROW][C]Autocorrelation Function[/C][/ROW]
[ROW][C]Time lag k[/C][C]ACF(k)[/C][C]T-STAT[/C][C]P-value[/C][/ROW]
[ROW][C]1[/C][C]0.062149[/C][C]0.6459[/C][C]0.259867[/C][/ROW]
[ROW][C]2[/C][C]-0.23612[/C][C]-2.4538[/C][C]0.007866[/C][/ROW]
[ROW][C]3[/C][C]-0.390667[/C][C]-4.0599[/C][C]4.7e-05[/C][/ROW]
[ROW][C]4[/C][C]-0.121132[/C][C]-1.2588[/C][C]0.105401[/C][/ROW]
[ROW][C]5[/C][C]0.111251[/C][C]1.1562[/C][C]0.125084[/C][/ROW]
[ROW][C]6[/C][C]0.329424[/C][C]3.4235[/C][C]0.000437[/C][/ROW]
[ROW][C]7[/C][C]0.065022[/C][C]0.6757[/C][C]0.250329[/C][/ROW]
[ROW][C]8[/C][C]-0.12795[/C][C]-1.3297[/C][C]0.093211[/C][/ROW]
[ROW][C]9[/C][C]-0.372702[/C][C]-3.8732[/C][C]9.2e-05[/C][/ROW]
[ROW][C]10[/C][C]-0.217482[/C][C]-2.2601[/C][C]0.012909[/C][/ROW]
[ROW][C]11[/C][C]0.022336[/C][C]0.2321[/C][C]0.408439[/C][/ROW]
[ROW][C]12[/C][C]0.775144[/C][C]8.0555[/C][C]0[/C][/ROW]
[ROW][C]13[/C][C]0.054581[/C][C]0.5672[/C][C]0.285868[/C][/ROW]
[ROW][C]14[/C][C]-0.180285[/C][C]-1.8736[/C][C]0.031846[/C][/ROW]
[ROW][C]15[/C][C]-0.318719[/C][C]-3.3122[/C][C]0.00063[/C][/ROW]
[ROW][C]16[/C][C]-0.107158[/C][C]-1.1136[/C][C]0.133958[/C][/ROW]
[ROW][C]17[/C][C]0.095811[/C][C]0.9957[/C][C]0.160811[/C][/ROW]
[ROW][C]18[/C][C]0.319722[/C][C]3.3226[/C][C]0.000609[/C][/ROW]
[ROW][C]19[/C][C]0.038689[/C][C]0.4021[/C][C]0.344213[/C][/ROW]
[ROW][C]20[/C][C]-0.070021[/C][C]-0.7277[/C][C]0.234194[/C][/ROW]
[ROW][C]21[/C][C]-0.307453[/C][C]-3.1951[/C][C]0.000916[/C][/ROW]
[ROW][C]22[/C][C]-0.200298[/C][C]-2.0816[/C][C]0.019873[/C][/ROW]
[ROW][C]23[/C][C]0.006661[/C][C]0.0692[/C][C]0.472472[/C][/ROW]
[ROW][C]24[/C][C]0.602401[/C][C]6.2603[/C][C]0[/C][/ROW]
[ROW][C]25[/C][C]0.017478[/C][C]0.1816[/C][C]0.428103[/C][/ROW]
[ROW][C]26[/C][C]-0.132219[/C][C]-1.3741[/C][C]0.086135[/C][/ROW]
[ROW][C]27[/C][C]-0.272435[/C][C]-2.8312[/C][C]0.002766[/C][/ROW]
[ROW][C]28[/C][C]-0.103461[/C][C]-1.0752[/C][C]0.142341[/C][/ROW]
[ROW][C]29[/C][C]0.079672[/C][C]0.828[/C][C]0.204755[/C][/ROW]
[ROW][C]30[/C][C]0.231357[/C][C]2.4043[/C][C]0.008952[/C][/ROW]
[ROW][C]31[/C][C]0.024176[/C][C]0.2512[/C][C]0.401053[/C][/ROW]
[ROW][C]32[/C][C]-0.032779[/C][C]-0.3407[/C][C]0.367013[/C][/ROW]
[ROW][C]33[/C][C]-0.244398[/C][C]-2.5399[/C][C]0.006256[/C][/ROW]
[ROW][C]34[/C][C]-0.165094[/C][C]-1.7157[/C][C]0.044542[/C][/ROW]
[ROW][C]35[/C][C]0.021332[/C][C]0.2217[/C][C]0.412489[/C][/ROW]
[ROW][C]36[/C][C]0.503668[/C][C]5.2343[/C][C]0[/C][/ROW]
[ROW][C]37[/C][C]-0.006037[/C][C]-0.0627[/C][C]0.475045[/C][/ROW]
[ROW][C]38[/C][C]-0.091123[/C][C]-0.947[/C][C]0.172883[/C][/ROW]
[ROW][C]39[/C][C]-0.218379[/C][C]-2.2695[/C][C]0.012613[/C][/ROW]
[ROW][C]40[/C][C]-0.091766[/C][C]-0.9537[/C][C]0.171193[/C][/ROW]
[ROW][C]41[/C][C]0.085685[/C][C]0.8905[/C][C]0.187597[/C][/ROW]
[ROW][C]42[/C][C]0.16165[/C][C]1.6799[/C][C]0.047932[/C][/ROW]
[ROW][C]43[/C][C]0.001147[/C][C]0.0119[/C][C]0.495255[/C][/ROW]
[ROW][C]44[/C][C]-0.019737[/C][C]-0.2051[/C][C]0.418936[/C][/ROW]
[ROW][C]45[/C][C]-0.212135[/C][C]-2.2046[/C][C]0.014803[/C][/ROW]
[ROW][C]46[/C][C]-0.11759[/C][C]-1.222[/C][C]0.112179[/C][/ROW]
[ROW][C]47[/C][C]0.024724[/C][C]0.2569[/C][C]0.398859[/C][/ROW]
[ROW][C]48[/C][C]0.351439[/C][C]3.6523[/C][C]0.000201[/C][/ROW]
[/TABLE]
Source: https://freestatistics.org/blog/index.php?pk=123152&T=1

Globally Unique Identifier (entire table): ba.freestatistics.org/blog/index.php?pk=123152&T=1

As an alternative you can also use a QR Code:  

The GUIDs for individual cells are displayed in the table below:

Autocorrelation Function
Time lag kACF(k)T-STATP-value
10.0621490.64590.259867
2-0.23612-2.45380.007866
3-0.390667-4.05994.7e-05
4-0.121132-1.25880.105401
50.1112511.15620.125084
60.3294243.42350.000437
70.0650220.67570.250329
8-0.12795-1.32970.093211
9-0.372702-3.87329.2e-05
10-0.217482-2.26010.012909
110.0223360.23210.408439
120.7751448.05550
130.0545810.56720.285868
14-0.180285-1.87360.031846
15-0.318719-3.31220.00063
16-0.107158-1.11360.133958
170.0958110.99570.160811
180.3197223.32260.000609
190.0386890.40210.344213
20-0.070021-0.72770.234194
21-0.307453-3.19510.000916
22-0.200298-2.08160.019873
230.0066610.06920.472472
240.6024016.26030
250.0174780.18160.428103
26-0.132219-1.37410.086135
27-0.272435-2.83120.002766
28-0.103461-1.07520.142341
290.0796720.8280.204755
300.2313572.40430.008952
310.0241760.25120.401053
32-0.032779-0.34070.367013
33-0.244398-2.53990.006256
34-0.165094-1.71570.044542
350.0213320.22170.412489
360.5036685.23430
37-0.006037-0.06270.475045
38-0.091123-0.9470.172883
39-0.218379-2.26950.012613
40-0.091766-0.95370.171193
410.0856850.89050.187597
420.161651.67990.047932
430.0011470.01190.495255
44-0.019737-0.20510.418936
45-0.212135-2.20460.014803
46-0.11759-1.2220.112179
470.0247240.25690.398859
480.3514393.65230.000201


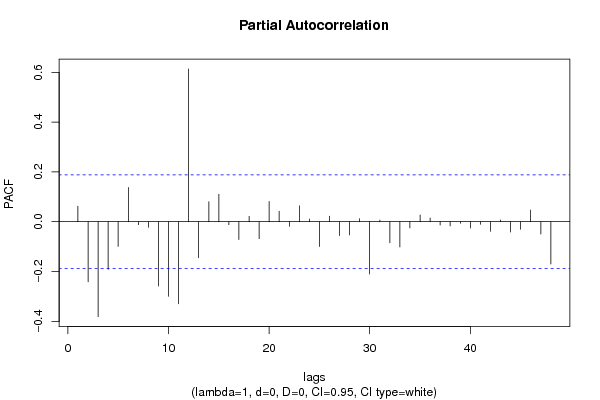
Partial Autocorrelation Function
Time lag kPACF(k)T-STATP-value
10.0621490.64590.259867
2-0.240914-2.50360.006894
3-0.380983-3.95936.7e-05
4-0.190904-1.98390.0249
5-0.098984-1.02870.152967
60.1378411.43250.077447
7-0.011692-0.12150.451756
8-0.022398-0.23280.408191
9-0.258257-2.68390.004212
10-0.299208-3.10950.001198
11-0.329133-3.42040.000442
120.6133396.3740
13-0.144512-1.50180.068032
140.0806250.83790.201973
150.1101761.1450.127374
16-0.011632-0.12090.452002
17-0.071298-0.74090.230167
180.021770.22620.410721
19-0.067967-0.70630.240752
200.0815360.84740.199337
210.0418960.43540.332073
22-0.018232-0.18950.425038
230.0638560.66360.254177
240.010510.10920.456616
25-0.099311-1.03210.152173
260.0220550.22920.409572
27-0.055644-0.57830.282143
28-0.05294-0.55020.29167
290.0121430.12620.449905
30-0.209885-2.18120.015669
310.0066060.06870.472696
32-0.084289-0.8760.191498
33-0.101026-1.04990.148056
34-0.024722-0.25690.398863
350.0269830.28040.389847
360.0146220.1520.439753
37-0.012867-0.13370.446938
38-0.01681-0.17470.430824
39-0.006396-0.06650.473562
40-0.025576-0.26580.395453
41-0.010461-0.10870.456817
42-0.038088-0.39580.346507
430.0074450.07740.469235
44-0.041115-0.42730.335012
45-0.029957-0.31130.378078
460.0467150.48550.31416
47-0.049678-0.51630.30336
48-0.170116-1.76790.039951

\begin{tabular}{lllllllll}
\hline
Partial Autocorrelation Function \tabularnewline
Time lag k & PACF(k) & T-STAT & P-value \tabularnewline
1 & 0.062149 & 0.6459 & 0.259867 \tabularnewline
2 & -0.240914 & -2.5036 & 0.006894 \tabularnewline
3 & -0.380983 & -3.9593 & 6.7e-05 \tabularnewline
4 & -0.190904 & -1.9839 & 0.0249 \tabularnewline
5 & -0.098984 & -1.0287 & 0.152967 \tabularnewline
6 & 0.137841 & 1.4325 & 0.077447 \tabularnewline
7 & -0.011692 & -0.1215 & 0.451756 \tabularnewline
8 & -0.022398 & -0.2328 & 0.408191 \tabularnewline
9 & -0.258257 & -2.6839 & 0.004212 \tabularnewline
10 & -0.299208 & -3.1095 & 0.001198 \tabularnewline
11 & -0.329133 & -3.4204 & 0.000442 \tabularnewline
12 & 0.613339 & 6.374 & 0 \tabularnewline
13 & -0.144512 & -1.5018 & 0.068032 \tabularnewline
14 & 0.080625 & 0.8379 & 0.201973 \tabularnewline
15 & 0.110176 & 1.145 & 0.127374 \tabularnewline
16 & -0.011632 & -0.1209 & 0.452002 \tabularnewline
17 & -0.071298 & -0.7409 & 0.230167 \tabularnewline
18 & 0.02177 & 0.2262 & 0.410721 \tabularnewline
19 & -0.067967 & -0.7063 & 0.240752 \tabularnewline
20 & 0.081536 & 0.8474 & 0.199337 \tabularnewline
21 & 0.041896 & 0.4354 & 0.332073 \tabularnewline
22 & -0.018232 & -0.1895 & 0.425038 \tabularnewline
23 & 0.063856 & 0.6636 & 0.254177 \tabularnewline
24 & 0.01051 & 0.1092 & 0.456616 \tabularnewline
25 & -0.099311 & -1.0321 & 0.152173 \tabularnewline
26 & 0.022055 & 0.2292 & 0.409572 \tabularnewline
27 & -0.055644 & -0.5783 & 0.282143 \tabularnewline
28 & -0.05294 & -0.5502 & 0.29167 \tabularnewline
29 & 0.012143 & 0.1262 & 0.449905 \tabularnewline
30 & -0.209885 & -2.1812 & 0.015669 \tabularnewline
31 & 0.006606 & 0.0687 & 0.472696 \tabularnewline
32 & -0.084289 & -0.876 & 0.191498 \tabularnewline
33 & -0.101026 & -1.0499 & 0.148056 \tabularnewline
34 & -0.024722 & -0.2569 & 0.398863 \tabularnewline
35 & 0.026983 & 0.2804 & 0.389847 \tabularnewline
36 & 0.014622 & 0.152 & 0.439753 \tabularnewline
37 & -0.012867 & -0.1337 & 0.446938 \tabularnewline
38 & -0.01681 & -0.1747 & 0.430824 \tabularnewline
39 & -0.006396 & -0.0665 & 0.473562 \tabularnewline
40 & -0.025576 & -0.2658 & 0.395453 \tabularnewline
41 & -0.010461 & -0.1087 & 0.456817 \tabularnewline
42 & -0.038088 & -0.3958 & 0.346507 \tabularnewline
43 & 0.007445 & 0.0774 & 0.469235 \tabularnewline
44 & -0.041115 & -0.4273 & 0.335012 \tabularnewline
45 & -0.029957 & -0.3113 & 0.378078 \tabularnewline
46 & 0.046715 & 0.4855 & 0.31416 \tabularnewline
47 & -0.049678 & -0.5163 & 0.30336 \tabularnewline
48 & -0.170116 & -1.7679 & 0.039951 \tabularnewline
\hline
\end{tabular}
%Source: https://freestatistics.org/blog/index.php?pk=123152&T=2

[TABLE]
[ROW][C]Partial Autocorrelation Function[/C][/ROW]
[ROW][C]Time lag k[/C][C]PACF(k)[/C][C]T-STAT[/C][C]P-value[/C][/ROW]
[ROW][C]1[/C][C]0.062149[/C][C]0.6459[/C][C]0.259867[/C][/ROW]
[ROW][C]2[/C][C]-0.240914[/C][C]-2.5036[/C][C]0.006894[/C][/ROW]
[ROW][C]3[/C][C]-0.380983[/C][C]-3.9593[/C][C]6.7e-05[/C][/ROW]
[ROW][C]4[/C][C]-0.190904[/C][C]-1.9839[/C][C]0.0249[/C][/ROW]
[ROW][C]5[/C][C]-0.098984[/C][C]-1.0287[/C][C]0.152967[/C][/ROW]
[ROW][C]6[/C][C]0.137841[/C][C]1.4325[/C][C]0.077447[/C][/ROW]
[ROW][C]7[/C][C]-0.011692[/C][C]-0.1215[/C][C]0.451756[/C][/ROW]
[ROW][C]8[/C][C]-0.022398[/C][C]-0.2328[/C][C]0.408191[/C][/ROW]
[ROW][C]9[/C][C]-0.258257[/C][C]-2.6839[/C][C]0.004212[/C][/ROW]
[ROW][C]10[/C][C]-0.299208[/C][C]-3.1095[/C][C]0.001198[/C][/ROW]
[ROW][C]11[/C][C]-0.329133[/C][C]-3.4204[/C][C]0.000442[/C][/ROW]
[ROW][C]12[/C][C]0.613339[/C][C]6.374[/C][C]0[/C][/ROW]
[ROW][C]13[/C][C]-0.144512[/C][C]-1.5018[/C][C]0.068032[/C][/ROW]
[ROW][C]14[/C][C]0.080625[/C][C]0.8379[/C][C]0.201973[/C][/ROW]
[ROW][C]15[/C][C]0.110176[/C][C]1.145[/C][C]0.127374[/C][/ROW]
[ROW][C]16[/C][C]-0.011632[/C][C]-0.1209[/C][C]0.452002[/C][/ROW]
[ROW][C]17[/C][C]-0.071298[/C][C]-0.7409[/C][C]0.230167[/C][/ROW]
[ROW][C]18[/C][C]0.02177[/C][C]0.2262[/C][C]0.410721[/C][/ROW]
[ROW][C]19[/C][C]-0.067967[/C][C]-0.7063[/C][C]0.240752[/C][/ROW]
[ROW][C]20[/C][C]0.081536[/C][C]0.8474[/C][C]0.199337[/C][/ROW]
[ROW][C]21[/C][C]0.041896[/C][C]0.4354[/C][C]0.332073[/C][/ROW]
[ROW][C]22[/C][C]-0.018232[/C][C]-0.1895[/C][C]0.425038[/C][/ROW]
[ROW][C]23[/C][C]0.063856[/C][C]0.6636[/C][C]0.254177[/C][/ROW]
[ROW][C]24[/C][C]0.01051[/C][C]0.1092[/C][C]0.456616[/C][/ROW]
[ROW][C]25[/C][C]-0.099311[/C][C]-1.0321[/C][C]0.152173[/C][/ROW]
[ROW][C]26[/C][C]0.022055[/C][C]0.2292[/C][C]0.409572[/C][/ROW]
[ROW][C]27[/C][C]-0.055644[/C][C]-0.5783[/C][C]0.282143[/C][/ROW]
[ROW][C]28[/C][C]-0.05294[/C][C]-0.5502[/C][C]0.29167[/C][/ROW]
[ROW][C]29[/C][C]0.012143[/C][C]0.1262[/C][C]0.449905[/C][/ROW]
[ROW][C]30[/C][C]-0.209885[/C][C]-2.1812[/C][C]0.015669[/C][/ROW]
[ROW][C]31[/C][C]0.006606[/C][C]0.0687[/C][C]0.472696[/C][/ROW]
[ROW][C]32[/C][C]-0.084289[/C][C]-0.876[/C][C]0.191498[/C][/ROW]
[ROW][C]33[/C][C]-0.101026[/C][C]-1.0499[/C][C]0.148056[/C][/ROW]
[ROW][C]34[/C][C]-0.024722[/C][C]-0.2569[/C][C]0.398863[/C][/ROW]
[ROW][C]35[/C][C]0.026983[/C][C]0.2804[/C][C]0.389847[/C][/ROW]
[ROW][C]36[/C][C]0.014622[/C][C]0.152[/C][C]0.439753[/C][/ROW]
[ROW][C]37[/C][C]-0.012867[/C][C]-0.1337[/C][C]0.446938[/C][/ROW]
[ROW][C]38[/C][C]-0.01681[/C][C]-0.1747[/C][C]0.430824[/C][/ROW]
[ROW][C]39[/C][C]-0.006396[/C][C]-0.0665[/C][C]0.473562[/C][/ROW]
[ROW][C]40[/C][C]-0.025576[/C][C]-0.2658[/C][C]0.395453[/C][/ROW]
[ROW][C]41[/C][C]-0.010461[/C][C]-0.1087[/C][C]0.456817[/C][/ROW]
[ROW][C]42[/C][C]-0.038088[/C][C]-0.3958[/C][C]0.346507[/C][/ROW]
[ROW][C]43[/C][C]0.007445[/C][C]0.0774[/C][C]0.469235[/C][/ROW]
[ROW][C]44[/C][C]-0.041115[/C][C]-0.4273[/C][C]0.335012[/C][/ROW]
[ROW][C]45[/C][C]-0.029957[/C][C]-0.3113[/C][C]0.378078[/C][/ROW]
[ROW][C]46[/C][C]0.046715[/C][C]0.4855[/C][C]0.31416[/C][/ROW]
[ROW][C]47[/C][C]-0.049678[/C][C]-0.5163[/C][C]0.30336[/C][/ROW]
[ROW][C]48[/C][C]-0.170116[/C][C]-1.7679[/C][C]0.039951[/C][/ROW]
[/TABLE]
Source: https://freestatistics.org/blog/index.php?pk=123152&T=2

Globally Unique Identifier (entire table): ba.freestatistics.org/blog/index.php?pk=123152&T=2

As an alternative you can also use a QR Code:  

The GUIDs for individual cells are displayed in the table below:

Partial Autocorrelation Function
Time lag kPACF(k)T-STATP-value
10.0621490.64590.259867
2-0.240914-2.50360.006894
3-0.380983-3.95936.7e-05
4-0.190904-1.98390.0249
5-0.098984-1.02870.152967
60.1378411.43250.077447
7-0.011692-0.12150.451756
8-0.022398-0.23280.408191
9-0.258257-2.68390.004212
10-0.299208-3.10950.001198
11-0.329133-3.42040.000442
120.6133396.3740
13-0.144512-1.50180.068032
140.0806250.83790.201973
150.1101761.1450.127374
16-0.011632-0.12090.452002
17-0.071298-0.74090.230167
180.021770.22620.410721
19-0.067967-0.70630.240752
200.0815360.84740.199337
210.0418960.43540.332073
22-0.018232-0.18950.425038
230.0638560.66360.254177
240.010510.10920.456616
25-0.099311-1.03210.152173
260.0220550.22920.409572
27-0.055644-0.57830.282143
28-0.05294-0.55020.29167
290.0121430.12620.449905
30-0.209885-2.18120.015669
310.0066060.06870.472696
32-0.084289-0.8760.191498
33-0.101026-1.04990.148056
34-0.024722-0.25690.398863
350.0269830.28040.389847
360.0146220.1520.439753
37-0.012867-0.13370.446938
38-0.01681-0.17470.430824
39-0.006396-0.06650.473562
40-0.025576-0.26580.395453
41-0.010461-0.10870.456817
42-0.038088-0.39580.346507
430.0074450.07740.469235
44-0.041115-0.42730.335012
45-0.029957-0.31130.378078
460.0467150.48550.31416
47-0.049678-0.51630.30336
48-0.170116-1.76790.039951


Parameters (Session):
par1 = 12 ;
Parameters (R input):
par1 = 48 ; par2 = 1 ; par3 = 0 ; par4 = 0 ; par5 = 12 ; par6 = White Noise ; par7 = 0.95 ; par8 = ;
R code (references can be found in the software module):
if (par1 == 'Default') {
par1 = 10*log10(length(x))
} else {
par1 <- as.numeric(par1)
}
par2 <- as.numeric(par2)
par3 <- as.numeric(par3)
par4 <- as.numeric(par4)
par5 <- as.numeric(par5)
if (par6 == 'White Noise') par6 <- 'white' else par6 <- 'ma'
par7 <- as.numeric(par7)
if (par8 != '') par8 <- as.numeric(par8)
ox <- x
if (par8 == '') {
if (par2 == 0) {
x <- log(x)
} else {
x <- (x ^ par2 - 1) / par2
}
} else {
x <- log(x,base=par8)
}
if (par3 > 0) x <- diff(x,lag=1,difference=par3)
if (par4 > 0) x <- diff(x,lag=par5,difference=par4)
bitmap(file='picts.png')
op <- par(mfrow=c(2,1))
plot(ox,type='l',main='Original Time Series',xlab='time',ylab='value')
if (par8=='') {
mytitle <- paste('Working Time Series (lambda=',par2,', d=',par3,', D=',par4,')',sep='')
mysub <- paste('(lambda=',par2,', d=',par3,', D=',par4,', CI=', par7, ', CI type=',par6,')',sep='')
} else {
mytitle <- paste('Working Time Series (base=',par8,', d=',par3,', D=',par4,')',sep='')
mysub <- paste('(base=',par8,', d=',par3,', D=',par4,', CI=', par7, ', CI type=',par6,')',sep='')
}
plot(x,type='l', main=mytitle,xlab='time',ylab='value')
par(op)
dev.off()
bitmap(file='pic1.png')
racf <- acf(x, par1, main='Autocorrelation', xlab='time lag', ylab='ACF', ci.type=par6, ci=par7, sub=mysub)
dev.off()
bitmap(file='pic2.png')
rpacf <- pacf(x,par1,main='Partial Autocorrelation',xlab='lags',ylab='PACF',sub=mysub)
dev.off()
(myacf <- c(racf$acf))
(mypacf <- c(rpacf$acf))
lengthx <- length(x)
sqrtn <- sqrt(lengthx)
load(file='createtable')
a<-table.start()
a<-table.row.start(a)
a<-table.element(a,'Autocorrelation Function',4,TRUE)
a<-table.row.end(a)
a<-table.row.start(a)
a<-table.element(a,'Time lag k',header=TRUE)
a<-table.element(a,hyperlink('basics.htm','ACF(k)','click here for more information about the Autocorrelation Function'),header=TRUE)
a<-table.element(a,'T-STAT',header=TRUE)
a<-table.element(a,'P-value',header=TRUE)
a<-table.row.end(a)
for (i in 2:(par1+1)) {
a<-table.row.start(a)
a<-table.element(a,i-1,header=TRUE)
a<-table.element(a,round(myacf[i],6))
mytstat <- myacf[i]*sqrtn
a<-table.element(a,round(mytstat,4))
a<-table.element(a,round(1-pt(abs(mytstat),lengthx),6))
a<-table.row.end(a)
}
a<-table.end(a)
table.save(a,file='mytable.tab')
a<-table.start()
a<-table.row.start(a)
a<-table.element(a,'Partial Autocorrelation Function',4,TRUE)
a<-table.row.end(a)
a<-table.row.start(a)
a<-table.element(a,'Time lag k',header=TRUE)
a<-table.element(a,hyperlink('basics.htm','PACF(k)','click here for more information about the Partial Autocorrelation Function'),header=TRUE)
a<-table.element(a,'T-STAT',header=TRUE)
a<-table.element(a,'P-value',header=TRUE)
a<-table.row.end(a)
for (i in 1:par1) {
a<-table.row.start(a)
a<-table.element(a,i,header=TRUE)
a<-table.element(a,round(mypacf[i],6))
mytstat <- mypacf[i]*sqrtn
a<-table.element(a,round(mytstat,4))
a<-table.element(a,round(1-pt(abs(mytstat),lengthx),6))
a<-table.row.end(a)
}
a<-table.end(a)
table.save(a,file='mytable1.tab')