Free Statistics

of Irreproducible Research!

Author's title

Author*Unverified author*
R Software Modulerwasp_smp.wasp
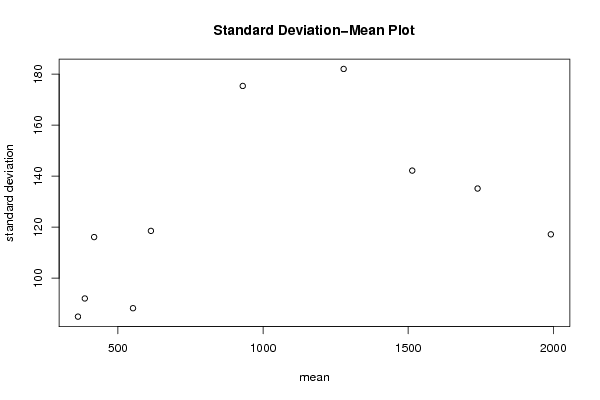
Title produced by softwareStandard Deviation-Mean Plot
Date of computationWed, 27 Jul 2011 10:24:23 -0400
Cite this page as followsStatistical Computations at FreeStatistics.org, Office for Research Development and Education, URL https://freestatistics.org/blog/index.php?v=date/2011/Jul/27/t13117767868ixz7dofvthvzos.htm/, Retrieved Wed, 15 May 2024 14:59:16 +0000
Statistical Computations at FreeStatistics.org, Office for Research Development and Education, URL https://freestatistics.org/blog/index.php?pk=123181, Retrieved Wed, 15 May 2024 14:59:16 +0000
QR Codes:

Original text written by user:
IsPrivate?No (this computation is public)
User-defined keywordsYannick De Pelsmaeker
Estimated Impact194
Family? (F = Feedback message, R = changed R code, M = changed R Module, P = changed Parameters, D = changed Data)
-       [Standard Deviation-Mean Plot] [tijdreeks A stap 26] [2011-07-27 14:24:23] [d41d8cd98f00b204e9800998ecf8427e] [Current]
Feedback Forum

Post a new message
Dataseries X:
567
557
547
527
729
719
567
466
476
476
486
507
446
385
335
335
527
547
395
223
314
314
385
426
416
314
365
345
517
476
314
193
304
335
365
405
324
254
284
294
557
557
405
385
446
416
497
598
618
476
436
395
669
689
638
689
679
598
689
790
831
709
628
689
952
1033
1013
1053
1043
942
1114
1155
1215
1033
962
1043
1236
1408
1367
1367
1387
1317
1499
1499
1468
1296
1327
1347
1479
1651
1529
1590
1539
1509
1742
1691
1620
1519
1620
1671
1732
1813
1732
1782
1721
1711
1964
1985
1904
1762
1883
1934
1995
2086
1995
2066
2035
1924
2157
2157


Summary of computational transaction
Raw Inputview raw input (R code)
Raw Outputview raw output of R engine
Computing time0 seconds
R Server'Herman Ole Andreas Wold' @ wold.wessa.net

\begin{tabular}{lllllllll}
\hline
Summary of computational transaction \tabularnewline
Raw Input & view raw input (R code)  \tabularnewline
Raw Output & view raw output of R engine  \tabularnewline
Computing time & 0 seconds \tabularnewline
R Server & 'Herman Ole Andreas Wold' @ wold.wessa.net \tabularnewline
\hline
\end{tabular}
%Source: https://freestatistics.org/blog/index.php?pk=123181&T=0

[TABLE]
[ROW][C]Summary of computational transaction[/C][/ROW]
[ROW][C]Raw Input[/C][C]view raw input (R code) [/C][/ROW]
[ROW][C]Raw Output[/C][C]view raw output of R engine [/C][/ROW]
[ROW][C]Computing time[/C][C]0 seconds[/C][/ROW]
[ROW][C]R Server[/C][C]'Herman Ole Andreas Wold' @ wold.wessa.net[/C][/ROW]
[/TABLE]
Source: https://freestatistics.org/blog/index.php?pk=123181&T=0

Globally Unique Identifier (entire table): ba.freestatistics.org/blog/index.php?pk=123181&T=0

As an alternative you can also use a QR Code:  

The GUIDs for individual cells are displayed in the table below:

Summary of computational transaction
Raw Inputview raw input (R code)
Raw Outputview raw output of R engine
Computing time0 seconds
R Server'Herman Ole Andreas Wold' @ wold.wessa.net


Standard Deviation-Mean Plot
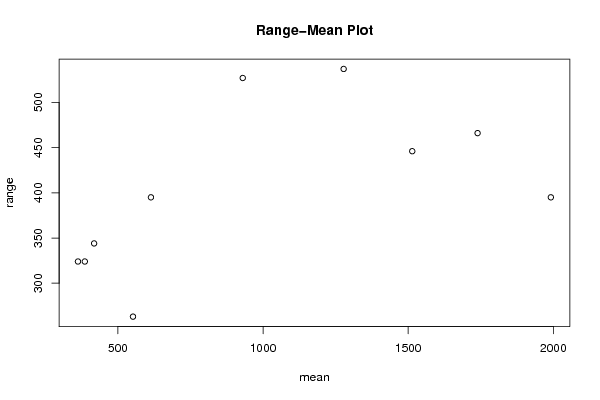
SectionMeanStandard DeviationRange
155288.2517061385424263
238692.0592694458797324
3362.41666666666784.9346897042164324
4418.083333333333116.147600713554344
5613.833333333333118.566309282906395
6930.166666666667175.403862989146527
71277.75182.074972070698537
81514142.208553636104446
91739.16666666667135.182592567732466
101991.5117.217358317397395

\begin{tabular}{lllllllll}
\hline
Standard Deviation-Mean Plot \tabularnewline
Section & Mean & Standard Deviation & Range \tabularnewline
1 & 552 & 88.2517061385424 & 263 \tabularnewline
2 & 386 & 92.0592694458797 & 324 \tabularnewline
3 & 362.416666666667 & 84.9346897042164 & 324 \tabularnewline
4 & 418.083333333333 & 116.147600713554 & 344 \tabularnewline
5 & 613.833333333333 & 118.566309282906 & 395 \tabularnewline
6 & 930.166666666667 & 175.403862989146 & 527 \tabularnewline
7 & 1277.75 & 182.074972070698 & 537 \tabularnewline
8 & 1514 & 142.208553636104 & 446 \tabularnewline
9 & 1739.16666666667 & 135.182592567732 & 466 \tabularnewline
10 & 1991.5 & 117.217358317397 & 395 \tabularnewline
\hline
\end{tabular}
%Source: https://freestatistics.org/blog/index.php?pk=123181&T=1

[TABLE]
[ROW][C]Standard Deviation-Mean Plot[/C][/ROW]
[ROW][C]Section[/C][C]Mean[/C][C]Standard Deviation[/C][C]Range[/C][/ROW]
[ROW][C]1[/C][C]552[/C][C]88.2517061385424[/C][C]263[/C][/ROW]
[ROW][C]2[/C][C]386[/C][C]92.0592694458797[/C][C]324[/C][/ROW]
[ROW][C]3[/C][C]362.416666666667[/C][C]84.9346897042164[/C][C]324[/C][/ROW]
[ROW][C]4[/C][C]418.083333333333[/C][C]116.147600713554[/C][C]344[/C][/ROW]
[ROW][C]5[/C][C]613.833333333333[/C][C]118.566309282906[/C][C]395[/C][/ROW]
[ROW][C]6[/C][C]930.166666666667[/C][C]175.403862989146[/C][C]527[/C][/ROW]
[ROW][C]7[/C][C]1277.75[/C][C]182.074972070698[/C][C]537[/C][/ROW]
[ROW][C]8[/C][C]1514[/C][C]142.208553636104[/C][C]446[/C][/ROW]
[ROW][C]9[/C][C]1739.16666666667[/C][C]135.182592567732[/C][C]466[/C][/ROW]
[ROW][C]10[/C][C]1991.5[/C][C]117.217358317397[/C][C]395[/C][/ROW]
[/TABLE]
Source: https://freestatistics.org/blog/index.php?pk=123181&T=1

Globally Unique Identifier (entire table): ba.freestatistics.org/blog/index.php?pk=123181&T=1

As an alternative you can also use a QR Code:  

The GUIDs for individual cells are displayed in the table below:

Standard Deviation-Mean Plot
SectionMeanStandard DeviationRange
155288.2517061385424263
238692.0592694458797324
3362.41666666666784.9346897042164324
4418.083333333333116.147600713554344
5613.833333333333118.566309282906395
6930.166666666667175.403862989146527
71277.75182.074972070698537
81514142.208553636104446
91739.16666666667135.182592567732466
101991.5117.217358317397395


Regression: S.E.(k) = alpha + beta * Mean(k)
alpha98.5978416377161
beta0.0271916979523601
S.D.0.0172378723592584
T-STAT1.57743933738757
p-value0.153345983317549

\begin{tabular}{lllllllll}
\hline
Regression: S.E.(k) = alpha + beta * Mean(k) \tabularnewline
alpha & 98.5978416377161 \tabularnewline
beta & 0.0271916979523601 \tabularnewline
S.D. & 0.0172378723592584 \tabularnewline
T-STAT & 1.57743933738757 \tabularnewline
p-value & 0.153345983317549 \tabularnewline
\hline
\end{tabular}
%Source: https://freestatistics.org/blog/index.php?pk=123181&T=2

[TABLE]
[ROW][C]Regression: S.E.(k) = alpha + beta * Mean(k)[/C][/ROW]
[ROW][C]alpha[/C][C]98.5978416377161[/C][/ROW]
[ROW][C]beta[/C][C]0.0271916979523601[/C][/ROW]
[ROW][C]S.D.[/C][C]0.0172378723592584[/C][/ROW]
[ROW][C]T-STAT[/C][C]1.57743933738757[/C][/ROW]
[ROW][C]p-value[/C][C]0.153345983317549[/C][/ROW]
[/TABLE]
Source: https://freestatistics.org/blog/index.php?pk=123181&T=2

Globally Unique Identifier (entire table): ba.freestatistics.org/blog/index.php?pk=123181&T=2

As an alternative you can also use a QR Code:  

The GUIDs for individual cells are displayed in the table below:

Regression: S.E.(k) = alpha + beta * Mean(k)
alpha98.5978416377161
beta0.0271916979523601
S.D.0.0172378723592584
T-STAT1.57743933738757
p-value0.153345983317549


Regression: ln S.E.(k) = alpha + beta * ln Mean(k)
alpha3.0041741192786
beta0.267705640056894
S.D.0.109128724139779
T-STAT2.45311802339044
p-value0.0397429998095877
Lambda0.732294359943106

\begin{tabular}{lllllllll}
\hline
Regression: ln S.E.(k) = alpha + beta * ln Mean(k) \tabularnewline
alpha & 3.0041741192786 \tabularnewline
beta & 0.267705640056894 \tabularnewline
S.D. & 0.109128724139779 \tabularnewline
T-STAT & 2.45311802339044 \tabularnewline
p-value & 0.0397429998095877 \tabularnewline
Lambda & 0.732294359943106 \tabularnewline
\hline
\end{tabular}
%Source: https://freestatistics.org/blog/index.php?pk=123181&T=3

[TABLE]
[ROW][C]Regression: ln S.E.(k) = alpha + beta * ln Mean(k)[/C][/ROW]
[ROW][C]alpha[/C][C]3.0041741192786[/C][/ROW]
[ROW][C]beta[/C][C]0.267705640056894[/C][/ROW]
[ROW][C]S.D.[/C][C]0.109128724139779[/C][/ROW]
[ROW][C]T-STAT[/C][C]2.45311802339044[/C][/ROW]
[ROW][C]p-value[/C][C]0.0397429998095877[/C][/ROW]
[ROW][C]Lambda[/C][C]0.732294359943106[/C][/ROW]
[/TABLE]
Source: https://freestatistics.org/blog/index.php?pk=123181&T=3

Globally Unique Identifier (entire table): ba.freestatistics.org/blog/index.php?pk=123181&T=3

As an alternative you can also use a QR Code:  

The GUIDs for individual cells are displayed in the table below:

Regression: ln S.E.(k) = alpha + beta * ln Mean(k)
alpha3.0041741192786
beta0.267705640056894
S.D.0.109128724139779
T-STAT2.45311802339044
p-value0.0397429998095877
Lambda0.732294359943106


Parameters (Session):
par1 = 12 ;
Parameters (R input):
par1 = 12 ;
R code (references can be found in the software module):
par1 <- as.numeric(par1)
(n <- length(x))
(np <- floor(n / par1))
arr <- array(NA,dim=c(par1,np))
j <- 0
k <- 1
for (i in 1:(np*par1))
{
j = j + 1
arr[j,k] <- x[i]
if (j == par1) {
j = 0
k=k+1
}
}
arr
arr.mean <- array(NA,dim=np)
arr.sd <- array(NA,dim=np)
arr.range <- array(NA,dim=np)
for (j in 1:np)
{
arr.mean[j] <- mean(arr[,j],na.rm=TRUE)
arr.sd[j] <- sd(arr[,j],na.rm=TRUE)
arr.range[j] <- max(arr[,j],na.rm=TRUE) - min(arr[,j],na.rm=TRUE)
}
arr.mean
arr.sd
arr.range
(lm1 <- lm(arr.sd~arr.mean))
(lnlm1 <- lm(log(arr.sd)~log(arr.mean)))
(lm2 <- lm(arr.range~arr.mean))
bitmap(file='test1.png')
plot(arr.mean,arr.sd,main='Standard Deviation-Mean Plot',xlab='mean',ylab='standard deviation')
dev.off()
bitmap(file='test2.png')
plot(arr.mean,arr.range,main='Range-Mean Plot',xlab='mean',ylab='range')
dev.off()
load(file='createtable')
a<-table.start()
a<-table.row.start(a)
a<-table.element(a,'Standard Deviation-Mean Plot',4,TRUE)
a<-table.row.end(a)
a<-table.row.start(a)
a<-table.element(a,'Section',header=TRUE)
a<-table.element(a,'Mean',header=TRUE)
a<-table.element(a,'Standard Deviation',header=TRUE)
a<-table.element(a,'Range',header=TRUE)
a<-table.row.end(a)
for (j in 1:np) {
a<-table.row.start(a)
a<-table.element(a,j,header=TRUE)
a<-table.element(a,arr.mean[j])
a<-table.element(a,arr.sd[j] )
a<-table.element(a,arr.range[j] )
a<-table.row.end(a)
}
a<-table.end(a)
table.save(a,file='mytable.tab')
a<-table.start()
a<-table.row.start(a)
a<-table.element(a,'Regression: S.E.(k) = alpha + beta * Mean(k)',2,TRUE)
a<-table.row.end(a)
a<-table.row.start(a)
a<-table.element(a,'alpha',header=TRUE)
a<-table.element(a,lm1$coefficients[[1]])
a<-table.row.end(a)
a<-table.row.start(a)
a<-table.element(a,'beta',header=TRUE)
a<-table.element(a,lm1$coefficients[[2]])
a<-table.row.end(a)
a<-table.row.start(a)
a<-table.element(a,'S.D.',header=TRUE)
a<-table.element(a,summary(lm1)$coefficients[2,2])
a<-table.row.end(a)
a<-table.row.start(a)
a<-table.element(a,'T-STAT',header=TRUE)
a<-table.element(a,summary(lm1)$coefficients[2,3])
a<-table.row.end(a)
a<-table.row.start(a)
a<-table.element(a,'p-value',header=TRUE)
a<-table.element(a,summary(lm1)$coefficients[2,4])
a<-table.row.end(a)
a<-table.end(a)
table.save(a,file='mytable1.tab')
a<-table.start()
a<-table.row.start(a)
a<-table.element(a,'Regression: ln S.E.(k) = alpha + beta * ln Mean(k)',2,TRUE)
a<-table.row.end(a)
a<-table.row.start(a)
a<-table.element(a,'alpha',header=TRUE)
a<-table.element(a,lnlm1$coefficients[[1]])
a<-table.row.end(a)
a<-table.row.start(a)
a<-table.element(a,'beta',header=TRUE)
a<-table.element(a,lnlm1$coefficients[[2]])
a<-table.row.end(a)
a<-table.row.start(a)
a<-table.element(a,'S.D.',header=TRUE)
a<-table.element(a,summary(lnlm1)$coefficients[2,2])
a<-table.row.end(a)
a<-table.row.start(a)
a<-table.element(a,'T-STAT',header=TRUE)
a<-table.element(a,summary(lnlm1)$coefficients[2,3])
a<-table.row.end(a)
a<-table.row.start(a)
a<-table.element(a,'p-value',header=TRUE)
a<-table.element(a,summary(lnlm1)$coefficients[2,4])
a<-table.row.end(a)
a<-table.row.start(a)
a<-table.element(a,'Lambda',header=TRUE)
a<-table.element(a,1-lnlm1$coefficients[[2]])
a<-table.row.end(a)
a<-table.end(a)
table.save(a,file='mytable2.tab')