Free Statistics

of Irreproducible Research!

Author's title

Author*Unverified author*
R Software Modulerwasp_autocorrelation.wasp
Title produced by software(Partial) Autocorrelation Function
Date of computationThu, 28 Jul 2011 05:34:41 -0400
Cite this page as followsStatistical Computations at FreeStatistics.org, Office for Research Development and Education, URL https://freestatistics.org/blog/index.php?v=date/2011/Jul/28/t13118457747un02uj9hnquc8v.htm/, Retrieved Thu, 16 May 2024 13:17:49 +0000
Statistical Computations at FreeStatistics.org, Office for Research Development and Education, URL https://freestatistics.org/blog/index.php?pk=123191, Retrieved Thu, 16 May 2024 13:17:49 +0000
QR Codes:

Original text written by user:
IsPrivate?No (this computation is public)
User-defined keywordsvicky koopmans
Estimated Impact201
Family? (F = Feedback message, R = changed R code, M = changed R Module, P = changed Parameters, D = changed Data)
-       [(Partial) Autocorrelation Function] [tijdreeks1-stap20] [2011-07-28 09:34:41] [30681199eb2b91d06bf445c1ee7d20a2] [Current]
Feedback Forum

Post a new message
Dataseries X:
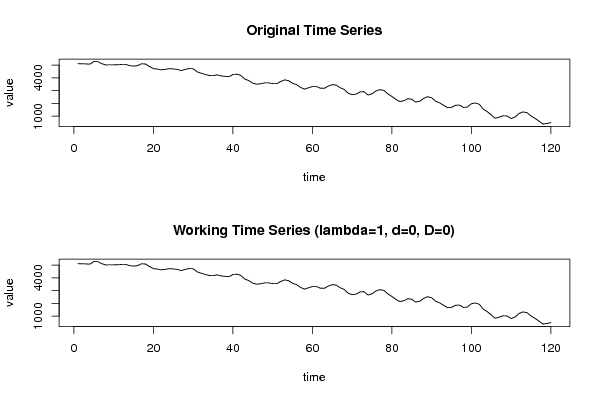
5115
5105
5094
5074
5280
5270
5115
5012
5022
5022
5032
5053
5053
4960
4919
4960
5105
5084
4888
4722
4691
4629
4671
4722
4702
4660
4578
4660
4733
4712
4474
4371
4268
4185
4175
4237
4154
4123
4092
4268
4288
4185
3906
3782
3586
3503
3544
3606
3606
3555
3544
3710
3844
3782
3575
3472
3255
3121
3224
3327
3327
3193
3183
3358
3472
3431
3224
3090
2800
2687
2728
2904
2914
2656
2749
2976
3079
3017
2738
2542
2315
2139
2211
2366
2325
2098
2170
2397
2521
2449
2170
2046
1860
1664
1695
1850
1870
1684
1715
1974
2036
1932
1550
1354
1095
837
920
1033
1013
816
930
1209
1333
1271
1023
827
620
382
424
496


Summary of computational transaction
Raw Inputview raw input (R code)
Raw Outputview raw output of R engine
Computing time1 seconds
R Server'Gwilym Jenkins' @ jenkins.wessa.net

\begin{tabular}{lllllllll}
\hline
Summary of computational transaction \tabularnewline
Raw Input & view raw input (R code)  \tabularnewline
Raw Output & view raw output of R engine  \tabularnewline
Computing time & 1 seconds \tabularnewline
R Server & 'Gwilym Jenkins' @ jenkins.wessa.net \tabularnewline
\hline
\end{tabular}
%Source: https://freestatistics.org/blog/index.php?pk=123191&T=0

[TABLE]
[ROW][C]Summary of computational transaction[/C][/ROW]
[ROW][C]Raw Input[/C][C]view raw input (R code) [/C][/ROW]
[ROW][C]Raw Output[/C][C]view raw output of R engine [/C][/ROW]
[ROW][C]Computing time[/C][C]1 seconds[/C][/ROW]
[ROW][C]R Server[/C][C]'Gwilym Jenkins' @ jenkins.wessa.net[/C][/ROW]
[/TABLE]
Source: https://freestatistics.org/blog/index.php?pk=123191&T=0

Globally Unique Identifier (entire table): ba.freestatistics.org/blog/index.php?pk=123191&T=0

As an alternative you can also use a QR Code:  

The GUIDs for individual cells are displayed in the table below:

Summary of computational transaction
Raw Inputview raw input (R code)
Raw Outputview raw output of R engine
Computing time1 seconds
R Server'Gwilym Jenkins' @ jenkins.wessa.net


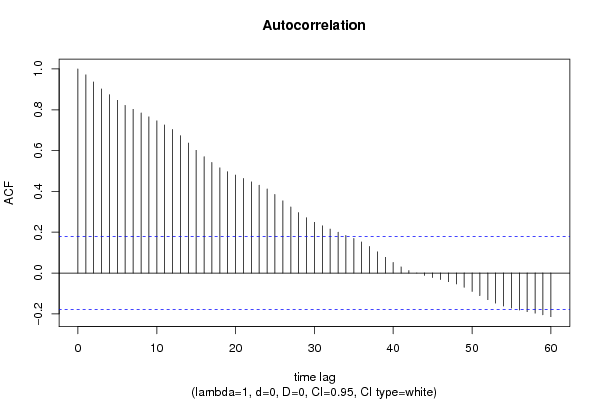
Autocorrelation Function
Time lag kACF(k)T-STATP-value
10.97090410.63570
20.93607810.25420
30.9019589.88050
40.8732699.56620
50.8459989.26740
60.8213668.99760
70.8018718.78410
80.7839948.58820
90.7650748.3810
100.7455138.16670
110.7257917.95060
120.7036067.70760
130.6726687.36870
140.6367776.97550
150.6011316.58510
160.5700296.24440
170.5413585.93030
180.5153575.64550
190.4962815.43650
200.4797175.2550
210.4632095.07421e-06
220.4465534.89172e-06
230.4302324.7133e-06
240.4114914.50778e-06
250.3852174.21982.4e-05
260.3537043.87468.7e-05
270.3232983.54160.000284
280.2961383.2440.000763
290.2712692.97160.00179
300.2482882.71990.003751
310.2310612.53110.006331
320.2153682.35920.009964
330.1996882.18750.015323
340.1843412.01940.022839
350.1690781.85220.033231
360.1522961.66830.04893
370.1304681.42920.077772
380.1037621.13670.128973
390.0768880.84230.200658
400.0518560.56810.285531
410.0300660.32940.371231
420.0118460.12980.448486
43-0.000505-0.00550.4978
44-0.011506-0.1260.449955
45-0.02153-0.23580.406976
46-0.031445-0.34450.365549
47-0.042089-0.46110.322796
48-0.053259-0.58340.280351
49-0.069407-0.76030.224279
50-0.089857-0.98430.163465
51-0.110541-1.21090.114154
52-0.130432-1.42880.077828
53-0.147323-1.61380.054595
54-0.161483-1.7690.039721
55-0.171538-1.87910.031328
56-0.180921-1.98190.024889
57-0.18923-2.07290.02016
58-0.196639-2.15410.016617
59-0.204317-2.23820.013527
60-0.213716-2.34110.010437

\begin{tabular}{lllllllll}
\hline
Autocorrelation Function \tabularnewline
Time lag k & ACF(k) & T-STAT & P-value \tabularnewline
1 & 0.970904 & 10.6357 & 0 \tabularnewline
2 & 0.936078 & 10.2542 & 0 \tabularnewline
3 & 0.901958 & 9.8805 & 0 \tabularnewline
4 & 0.873269 & 9.5662 & 0 \tabularnewline
5 & 0.845998 & 9.2674 & 0 \tabularnewline
6 & 0.821366 & 8.9976 & 0 \tabularnewline
7 & 0.801871 & 8.7841 & 0 \tabularnewline
8 & 0.783994 & 8.5882 & 0 \tabularnewline
9 & 0.765074 & 8.381 & 0 \tabularnewline
10 & 0.745513 & 8.1667 & 0 \tabularnewline
11 & 0.725791 & 7.9506 & 0 \tabularnewline
12 & 0.703606 & 7.7076 & 0 \tabularnewline
13 & 0.672668 & 7.3687 & 0 \tabularnewline
14 & 0.636777 & 6.9755 & 0 \tabularnewline
15 & 0.601131 & 6.5851 & 0 \tabularnewline
16 & 0.570029 & 6.2444 & 0 \tabularnewline
17 & 0.541358 & 5.9303 & 0 \tabularnewline
18 & 0.515357 & 5.6455 & 0 \tabularnewline
19 & 0.496281 & 5.4365 & 0 \tabularnewline
20 & 0.479717 & 5.255 & 0 \tabularnewline
21 & 0.463209 & 5.0742 & 1e-06 \tabularnewline
22 & 0.446553 & 4.8917 & 2e-06 \tabularnewline
23 & 0.430232 & 4.713 & 3e-06 \tabularnewline
24 & 0.411491 & 4.5077 & 8e-06 \tabularnewline
25 & 0.385217 & 4.2198 & 2.4e-05 \tabularnewline
26 & 0.353704 & 3.8746 & 8.7e-05 \tabularnewline
27 & 0.323298 & 3.5416 & 0.000284 \tabularnewline
28 & 0.296138 & 3.244 & 0.000763 \tabularnewline
29 & 0.271269 & 2.9716 & 0.00179 \tabularnewline
30 & 0.248288 & 2.7199 & 0.003751 \tabularnewline
31 & 0.231061 & 2.5311 & 0.006331 \tabularnewline
32 & 0.215368 & 2.3592 & 0.009964 \tabularnewline
33 & 0.199688 & 2.1875 & 0.015323 \tabularnewline
34 & 0.184341 & 2.0194 & 0.022839 \tabularnewline
35 & 0.169078 & 1.8522 & 0.033231 \tabularnewline
36 & 0.152296 & 1.6683 & 0.04893 \tabularnewline
37 & 0.130468 & 1.4292 & 0.077772 \tabularnewline
38 & 0.103762 & 1.1367 & 0.128973 \tabularnewline
39 & 0.076888 & 0.8423 & 0.200658 \tabularnewline
40 & 0.051856 & 0.5681 & 0.285531 \tabularnewline
41 & 0.030066 & 0.3294 & 0.371231 \tabularnewline
42 & 0.011846 & 0.1298 & 0.448486 \tabularnewline
43 & -0.000505 & -0.0055 & 0.4978 \tabularnewline
44 & -0.011506 & -0.126 & 0.449955 \tabularnewline
45 & -0.02153 & -0.2358 & 0.406976 \tabularnewline
46 & -0.031445 & -0.3445 & 0.365549 \tabularnewline
47 & -0.042089 & -0.4611 & 0.322796 \tabularnewline
48 & -0.053259 & -0.5834 & 0.280351 \tabularnewline
49 & -0.069407 & -0.7603 & 0.224279 \tabularnewline
50 & -0.089857 & -0.9843 & 0.163465 \tabularnewline
51 & -0.110541 & -1.2109 & 0.114154 \tabularnewline
52 & -0.130432 & -1.4288 & 0.077828 \tabularnewline
53 & -0.147323 & -1.6138 & 0.054595 \tabularnewline
54 & -0.161483 & -1.769 & 0.039721 \tabularnewline
55 & -0.171538 & -1.8791 & 0.031328 \tabularnewline
56 & -0.180921 & -1.9819 & 0.024889 \tabularnewline
57 & -0.18923 & -2.0729 & 0.02016 \tabularnewline
58 & -0.196639 & -2.1541 & 0.016617 \tabularnewline
59 & -0.204317 & -2.2382 & 0.013527 \tabularnewline
60 & -0.213716 & -2.3411 & 0.010437 \tabularnewline
\hline
\end{tabular}
%Source: https://freestatistics.org/blog/index.php?pk=123191&T=1

[TABLE]
[ROW][C]Autocorrelation Function[/C][/ROW]
[ROW][C]Time lag k[/C][C]ACF(k)[/C][C]T-STAT[/C][C]P-value[/C][/ROW]
[ROW][C]1[/C][C]0.970904[/C][C]10.6357[/C][C]0[/C][/ROW]
[ROW][C]2[/C][C]0.936078[/C][C]10.2542[/C][C]0[/C][/ROW]
[ROW][C]3[/C][C]0.901958[/C][C]9.8805[/C][C]0[/C][/ROW]
[ROW][C]4[/C][C]0.873269[/C][C]9.5662[/C][C]0[/C][/ROW]
[ROW][C]5[/C][C]0.845998[/C][C]9.2674[/C][C]0[/C][/ROW]
[ROW][C]6[/C][C]0.821366[/C][C]8.9976[/C][C]0[/C][/ROW]
[ROW][C]7[/C][C]0.801871[/C][C]8.7841[/C][C]0[/C][/ROW]
[ROW][C]8[/C][C]0.783994[/C][C]8.5882[/C][C]0[/C][/ROW]
[ROW][C]9[/C][C]0.765074[/C][C]8.381[/C][C]0[/C][/ROW]
[ROW][C]10[/C][C]0.745513[/C][C]8.1667[/C][C]0[/C][/ROW]
[ROW][C]11[/C][C]0.725791[/C][C]7.9506[/C][C]0[/C][/ROW]
[ROW][C]12[/C][C]0.703606[/C][C]7.7076[/C][C]0[/C][/ROW]
[ROW][C]13[/C][C]0.672668[/C][C]7.3687[/C][C]0[/C][/ROW]
[ROW][C]14[/C][C]0.636777[/C][C]6.9755[/C][C]0[/C][/ROW]
[ROW][C]15[/C][C]0.601131[/C][C]6.5851[/C][C]0[/C][/ROW]
[ROW][C]16[/C][C]0.570029[/C][C]6.2444[/C][C]0[/C][/ROW]
[ROW][C]17[/C][C]0.541358[/C][C]5.9303[/C][C]0[/C][/ROW]
[ROW][C]18[/C][C]0.515357[/C][C]5.6455[/C][C]0[/C][/ROW]
[ROW][C]19[/C][C]0.496281[/C][C]5.4365[/C][C]0[/C][/ROW]
[ROW][C]20[/C][C]0.479717[/C][C]5.255[/C][C]0[/C][/ROW]
[ROW][C]21[/C][C]0.463209[/C][C]5.0742[/C][C]1e-06[/C][/ROW]
[ROW][C]22[/C][C]0.446553[/C][C]4.8917[/C][C]2e-06[/C][/ROW]
[ROW][C]23[/C][C]0.430232[/C][C]4.713[/C][C]3e-06[/C][/ROW]
[ROW][C]24[/C][C]0.411491[/C][C]4.5077[/C][C]8e-06[/C][/ROW]
[ROW][C]25[/C][C]0.385217[/C][C]4.2198[/C][C]2.4e-05[/C][/ROW]
[ROW][C]26[/C][C]0.353704[/C][C]3.8746[/C][C]8.7e-05[/C][/ROW]
[ROW][C]27[/C][C]0.323298[/C][C]3.5416[/C][C]0.000284[/C][/ROW]
[ROW][C]28[/C][C]0.296138[/C][C]3.244[/C][C]0.000763[/C][/ROW]
[ROW][C]29[/C][C]0.271269[/C][C]2.9716[/C][C]0.00179[/C][/ROW]
[ROW][C]30[/C][C]0.248288[/C][C]2.7199[/C][C]0.003751[/C][/ROW]
[ROW][C]31[/C][C]0.231061[/C][C]2.5311[/C][C]0.006331[/C][/ROW]
[ROW][C]32[/C][C]0.215368[/C][C]2.3592[/C][C]0.009964[/C][/ROW]
[ROW][C]33[/C][C]0.199688[/C][C]2.1875[/C][C]0.015323[/C][/ROW]
[ROW][C]34[/C][C]0.184341[/C][C]2.0194[/C][C]0.022839[/C][/ROW]
[ROW][C]35[/C][C]0.169078[/C][C]1.8522[/C][C]0.033231[/C][/ROW]
[ROW][C]36[/C][C]0.152296[/C][C]1.6683[/C][C]0.04893[/C][/ROW]
[ROW][C]37[/C][C]0.130468[/C][C]1.4292[/C][C]0.077772[/C][/ROW]
[ROW][C]38[/C][C]0.103762[/C][C]1.1367[/C][C]0.128973[/C][/ROW]
[ROW][C]39[/C][C]0.076888[/C][C]0.8423[/C][C]0.200658[/C][/ROW]
[ROW][C]40[/C][C]0.051856[/C][C]0.5681[/C][C]0.285531[/C][/ROW]
[ROW][C]41[/C][C]0.030066[/C][C]0.3294[/C][C]0.371231[/C][/ROW]
[ROW][C]42[/C][C]0.011846[/C][C]0.1298[/C][C]0.448486[/C][/ROW]
[ROW][C]43[/C][C]-0.000505[/C][C]-0.0055[/C][C]0.4978[/C][/ROW]
[ROW][C]44[/C][C]-0.011506[/C][C]-0.126[/C][C]0.449955[/C][/ROW]
[ROW][C]45[/C][C]-0.02153[/C][C]-0.2358[/C][C]0.406976[/C][/ROW]
[ROW][C]46[/C][C]-0.031445[/C][C]-0.3445[/C][C]0.365549[/C][/ROW]
[ROW][C]47[/C][C]-0.042089[/C][C]-0.4611[/C][C]0.322796[/C][/ROW]
[ROW][C]48[/C][C]-0.053259[/C][C]-0.5834[/C][C]0.280351[/C][/ROW]
[ROW][C]49[/C][C]-0.069407[/C][C]-0.7603[/C][C]0.224279[/C][/ROW]
[ROW][C]50[/C][C]-0.089857[/C][C]-0.9843[/C][C]0.163465[/C][/ROW]
[ROW][C]51[/C][C]-0.110541[/C][C]-1.2109[/C][C]0.114154[/C][/ROW]
[ROW][C]52[/C][C]-0.130432[/C][C]-1.4288[/C][C]0.077828[/C][/ROW]
[ROW][C]53[/C][C]-0.147323[/C][C]-1.6138[/C][C]0.054595[/C][/ROW]
[ROW][C]54[/C][C]-0.161483[/C][C]-1.769[/C][C]0.039721[/C][/ROW]
[ROW][C]55[/C][C]-0.171538[/C][C]-1.8791[/C][C]0.031328[/C][/ROW]
[ROW][C]56[/C][C]-0.180921[/C][C]-1.9819[/C][C]0.024889[/C][/ROW]
[ROW][C]57[/C][C]-0.18923[/C][C]-2.0729[/C][C]0.02016[/C][/ROW]
[ROW][C]58[/C][C]-0.196639[/C][C]-2.1541[/C][C]0.016617[/C][/ROW]
[ROW][C]59[/C][C]-0.204317[/C][C]-2.2382[/C][C]0.013527[/C][/ROW]
[ROW][C]60[/C][C]-0.213716[/C][C]-2.3411[/C][C]0.010437[/C][/ROW]
[/TABLE]
Source: https://freestatistics.org/blog/index.php?pk=123191&T=1

Globally Unique Identifier (entire table): ba.freestatistics.org/blog/index.php?pk=123191&T=1

As an alternative you can also use a QR Code:  

The GUIDs for individual cells are displayed in the table below:

Autocorrelation Function
Time lag kACF(k)T-STATP-value
10.97090410.63570
20.93607810.25420
30.9019589.88050
40.8732699.56620
50.8459989.26740
60.8213668.99760
70.8018718.78410
80.7839948.58820
90.7650748.3810
100.7455138.16670
110.7257917.95060
120.7036067.70760
130.6726687.36870
140.6367776.97550
150.6011316.58510
160.5700296.24440
170.5413585.93030
180.5153575.64550
190.4962815.43650
200.4797175.2550
210.4632095.07421e-06
220.4465534.89172e-06
230.4302324.7133e-06
240.4114914.50778e-06
250.3852174.21982.4e-05
260.3537043.87468.7e-05
270.3232983.54160.000284
280.2961383.2440.000763
290.2712692.97160.00179
300.2482882.71990.003751
310.2310612.53110.006331
320.2153682.35920.009964
330.1996882.18750.015323
340.1843412.01940.022839
350.1690781.85220.033231
360.1522961.66830.04893
370.1304681.42920.077772
380.1037621.13670.128973
390.0768880.84230.200658
400.0518560.56810.285531
410.0300660.32940.371231
420.0118460.12980.448486
43-0.000505-0.00550.4978
44-0.011506-0.1260.449955
45-0.02153-0.23580.406976
46-0.031445-0.34450.365549
47-0.042089-0.46110.322796
48-0.053259-0.58340.280351
49-0.069407-0.76030.224279
50-0.089857-0.98430.163465
51-0.110541-1.21090.114154
52-0.130432-1.42880.077828
53-0.147323-1.61380.054595
54-0.161483-1.7690.039721
55-0.171538-1.87910.031328
56-0.180921-1.98190.024889
57-0.18923-2.07290.02016
58-0.196639-2.15410.016617
59-0.204317-2.23820.013527
60-0.213716-2.34110.010437


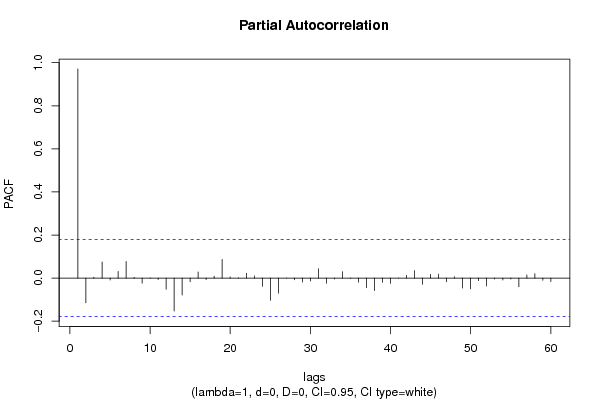
Partial Autocorrelation Function
Time lag kPACF(k)T-STATP-value
10.97090410.63570
2-0.114677-1.25620.105738
30.0041250.04520.482018
40.0746330.81760.207614
5-0.008501-0.09310.46298
60.0310510.34010.367171
70.0773580.84740.199225
80.0034250.03750.485066
9-0.023318-0.25540.399413
10-0.001088-0.01190.495254
11-0.00638-0.06990.472197
12-0.051302-0.5620.287589
13-0.152868-1.67460.04831
14-0.078842-0.86370.194746
15-0.017273-0.18920.425121
160.0282390.30930.378799
17-0.006931-0.07590.469801
180.0090140.09870.460751
190.0860530.94270.173874
200.0056190.06160.475508
210.0006180.00680.497305
220.0227780.24950.401692
230.0100260.10980.456366
24-0.037809-0.41420.339741
25-0.102881-1.1270.130995
26-0.069691-0.76340.223353
27-0.000415-0.00450.49819
28-0.007977-0.08740.465254
29-0.017754-0.19450.423063
30-0.013449-0.14730.441562
310.0433660.47510.317807
32-0.023579-0.25830.398311
33-0.003986-0.04370.482623
340.0292570.32050.374575
35-0.001532-0.01680.493319
36-0.01869-0.20470.419061
37-0.0441-0.48310.314957
38-0.058005-0.63540.263185
39-0.019723-0.21610.414655
40-0.024537-0.26880.394277
410.0002120.00230.499074
420.0127390.13960.444623
430.0348990.38230.351459
44-0.028258-0.30950.378721
450.0173930.19050.424606
460.0185610.20330.41961
47-0.016588-0.18170.428056
480.0065670.07190.471386
49-0.045677-0.50040.308865
50-0.049855-0.54610.292996
51-0.011711-0.12830.449067
52-0.036307-0.39770.34577
53-0.004326-0.04740.48114
54-0.008753-0.09590.461887
55-0.00419-0.04590.481731
56-0.039856-0.43660.331593
570.0141780.15530.438419
580.0203390.22280.412034
59-0.010051-0.11010.456255
60-0.015484-0.16960.432796

\begin{tabular}{lllllllll}
\hline
Partial Autocorrelation Function \tabularnewline
Time lag k & PACF(k) & T-STAT & P-value \tabularnewline
1 & 0.970904 & 10.6357 & 0 \tabularnewline
2 & -0.114677 & -1.2562 & 0.105738 \tabularnewline
3 & 0.004125 & 0.0452 & 0.482018 \tabularnewline
4 & 0.074633 & 0.8176 & 0.207614 \tabularnewline
5 & -0.008501 & -0.0931 & 0.46298 \tabularnewline
6 & 0.031051 & 0.3401 & 0.367171 \tabularnewline
7 & 0.077358 & 0.8474 & 0.199225 \tabularnewline
8 & 0.003425 & 0.0375 & 0.485066 \tabularnewline
9 & -0.023318 & -0.2554 & 0.399413 \tabularnewline
10 & -0.001088 & -0.0119 & 0.495254 \tabularnewline
11 & -0.00638 & -0.0699 & 0.472197 \tabularnewline
12 & -0.051302 & -0.562 & 0.287589 \tabularnewline
13 & -0.152868 & -1.6746 & 0.04831 \tabularnewline
14 & -0.078842 & -0.8637 & 0.194746 \tabularnewline
15 & -0.017273 & -0.1892 & 0.425121 \tabularnewline
16 & 0.028239 & 0.3093 & 0.378799 \tabularnewline
17 & -0.006931 & -0.0759 & 0.469801 \tabularnewline
18 & 0.009014 & 0.0987 & 0.460751 \tabularnewline
19 & 0.086053 & 0.9427 & 0.173874 \tabularnewline
20 & 0.005619 & 0.0616 & 0.475508 \tabularnewline
21 & 0.000618 & 0.0068 & 0.497305 \tabularnewline
22 & 0.022778 & 0.2495 & 0.401692 \tabularnewline
23 & 0.010026 & 0.1098 & 0.456366 \tabularnewline
24 & -0.037809 & -0.4142 & 0.339741 \tabularnewline
25 & -0.102881 & -1.127 & 0.130995 \tabularnewline
26 & -0.069691 & -0.7634 & 0.223353 \tabularnewline
27 & -0.000415 & -0.0045 & 0.49819 \tabularnewline
28 & -0.007977 & -0.0874 & 0.465254 \tabularnewline
29 & -0.017754 & -0.1945 & 0.423063 \tabularnewline
30 & -0.013449 & -0.1473 & 0.441562 \tabularnewline
31 & 0.043366 & 0.4751 & 0.317807 \tabularnewline
32 & -0.023579 & -0.2583 & 0.398311 \tabularnewline
33 & -0.003986 & -0.0437 & 0.482623 \tabularnewline
34 & 0.029257 & 0.3205 & 0.374575 \tabularnewline
35 & -0.001532 & -0.0168 & 0.493319 \tabularnewline
36 & -0.01869 & -0.2047 & 0.419061 \tabularnewline
37 & -0.0441 & -0.4831 & 0.314957 \tabularnewline
38 & -0.058005 & -0.6354 & 0.263185 \tabularnewline
39 & -0.019723 & -0.2161 & 0.414655 \tabularnewline
40 & -0.024537 & -0.2688 & 0.394277 \tabularnewline
41 & 0.000212 & 0.0023 & 0.499074 \tabularnewline
42 & 0.012739 & 0.1396 & 0.444623 \tabularnewline
43 & 0.034899 & 0.3823 & 0.351459 \tabularnewline
44 & -0.028258 & -0.3095 & 0.378721 \tabularnewline
45 & 0.017393 & 0.1905 & 0.424606 \tabularnewline
46 & 0.018561 & 0.2033 & 0.41961 \tabularnewline
47 & -0.016588 & -0.1817 & 0.428056 \tabularnewline
48 & 0.006567 & 0.0719 & 0.471386 \tabularnewline
49 & -0.045677 & -0.5004 & 0.308865 \tabularnewline
50 & -0.049855 & -0.5461 & 0.292996 \tabularnewline
51 & -0.011711 & -0.1283 & 0.449067 \tabularnewline
52 & -0.036307 & -0.3977 & 0.34577 \tabularnewline
53 & -0.004326 & -0.0474 & 0.48114 \tabularnewline
54 & -0.008753 & -0.0959 & 0.461887 \tabularnewline
55 & -0.00419 & -0.0459 & 0.481731 \tabularnewline
56 & -0.039856 & -0.4366 & 0.331593 \tabularnewline
57 & 0.014178 & 0.1553 & 0.438419 \tabularnewline
58 & 0.020339 & 0.2228 & 0.412034 \tabularnewline
59 & -0.010051 & -0.1101 & 0.456255 \tabularnewline
60 & -0.015484 & -0.1696 & 0.432796 \tabularnewline
\hline
\end{tabular}
%Source: https://freestatistics.org/blog/index.php?pk=123191&T=2

[TABLE]
[ROW][C]Partial Autocorrelation Function[/C][/ROW]
[ROW][C]Time lag k[/C][C]PACF(k)[/C][C]T-STAT[/C][C]P-value[/C][/ROW]
[ROW][C]1[/C][C]0.970904[/C][C]10.6357[/C][C]0[/C][/ROW]
[ROW][C]2[/C][C]-0.114677[/C][C]-1.2562[/C][C]0.105738[/C][/ROW]
[ROW][C]3[/C][C]0.004125[/C][C]0.0452[/C][C]0.482018[/C][/ROW]
[ROW][C]4[/C][C]0.074633[/C][C]0.8176[/C][C]0.207614[/C][/ROW]
[ROW][C]5[/C][C]-0.008501[/C][C]-0.0931[/C][C]0.46298[/C][/ROW]
[ROW][C]6[/C][C]0.031051[/C][C]0.3401[/C][C]0.367171[/C][/ROW]
[ROW][C]7[/C][C]0.077358[/C][C]0.8474[/C][C]0.199225[/C][/ROW]
[ROW][C]8[/C][C]0.003425[/C][C]0.0375[/C][C]0.485066[/C][/ROW]
[ROW][C]9[/C][C]-0.023318[/C][C]-0.2554[/C][C]0.399413[/C][/ROW]
[ROW][C]10[/C][C]-0.001088[/C][C]-0.0119[/C][C]0.495254[/C][/ROW]
[ROW][C]11[/C][C]-0.00638[/C][C]-0.0699[/C][C]0.472197[/C][/ROW]
[ROW][C]12[/C][C]-0.051302[/C][C]-0.562[/C][C]0.287589[/C][/ROW]
[ROW][C]13[/C][C]-0.152868[/C][C]-1.6746[/C][C]0.04831[/C][/ROW]
[ROW][C]14[/C][C]-0.078842[/C][C]-0.8637[/C][C]0.194746[/C][/ROW]
[ROW][C]15[/C][C]-0.017273[/C][C]-0.1892[/C][C]0.425121[/C][/ROW]
[ROW][C]16[/C][C]0.028239[/C][C]0.3093[/C][C]0.378799[/C][/ROW]
[ROW][C]17[/C][C]-0.006931[/C][C]-0.0759[/C][C]0.469801[/C][/ROW]
[ROW][C]18[/C][C]0.009014[/C][C]0.0987[/C][C]0.460751[/C][/ROW]
[ROW][C]19[/C][C]0.086053[/C][C]0.9427[/C][C]0.173874[/C][/ROW]
[ROW][C]20[/C][C]0.005619[/C][C]0.0616[/C][C]0.475508[/C][/ROW]
[ROW][C]21[/C][C]0.000618[/C][C]0.0068[/C][C]0.497305[/C][/ROW]
[ROW][C]22[/C][C]0.022778[/C][C]0.2495[/C][C]0.401692[/C][/ROW]
[ROW][C]23[/C][C]0.010026[/C][C]0.1098[/C][C]0.456366[/C][/ROW]
[ROW][C]24[/C][C]-0.037809[/C][C]-0.4142[/C][C]0.339741[/C][/ROW]
[ROW][C]25[/C][C]-0.102881[/C][C]-1.127[/C][C]0.130995[/C][/ROW]
[ROW][C]26[/C][C]-0.069691[/C][C]-0.7634[/C][C]0.223353[/C][/ROW]
[ROW][C]27[/C][C]-0.000415[/C][C]-0.0045[/C][C]0.49819[/C][/ROW]
[ROW][C]28[/C][C]-0.007977[/C][C]-0.0874[/C][C]0.465254[/C][/ROW]
[ROW][C]29[/C][C]-0.017754[/C][C]-0.1945[/C][C]0.423063[/C][/ROW]
[ROW][C]30[/C][C]-0.013449[/C][C]-0.1473[/C][C]0.441562[/C][/ROW]
[ROW][C]31[/C][C]0.043366[/C][C]0.4751[/C][C]0.317807[/C][/ROW]
[ROW][C]32[/C][C]-0.023579[/C][C]-0.2583[/C][C]0.398311[/C][/ROW]
[ROW][C]33[/C][C]-0.003986[/C][C]-0.0437[/C][C]0.482623[/C][/ROW]
[ROW][C]34[/C][C]0.029257[/C][C]0.3205[/C][C]0.374575[/C][/ROW]
[ROW][C]35[/C][C]-0.001532[/C][C]-0.0168[/C][C]0.493319[/C][/ROW]
[ROW][C]36[/C][C]-0.01869[/C][C]-0.2047[/C][C]0.419061[/C][/ROW]
[ROW][C]37[/C][C]-0.0441[/C][C]-0.4831[/C][C]0.314957[/C][/ROW]
[ROW][C]38[/C][C]-0.058005[/C][C]-0.6354[/C][C]0.263185[/C][/ROW]
[ROW][C]39[/C][C]-0.019723[/C][C]-0.2161[/C][C]0.414655[/C][/ROW]
[ROW][C]40[/C][C]-0.024537[/C][C]-0.2688[/C][C]0.394277[/C][/ROW]
[ROW][C]41[/C][C]0.000212[/C][C]0.0023[/C][C]0.499074[/C][/ROW]
[ROW][C]42[/C][C]0.012739[/C][C]0.1396[/C][C]0.444623[/C][/ROW]
[ROW][C]43[/C][C]0.034899[/C][C]0.3823[/C][C]0.351459[/C][/ROW]
[ROW][C]44[/C][C]-0.028258[/C][C]-0.3095[/C][C]0.378721[/C][/ROW]
[ROW][C]45[/C][C]0.017393[/C][C]0.1905[/C][C]0.424606[/C][/ROW]
[ROW][C]46[/C][C]0.018561[/C][C]0.2033[/C][C]0.41961[/C][/ROW]
[ROW][C]47[/C][C]-0.016588[/C][C]-0.1817[/C][C]0.428056[/C][/ROW]
[ROW][C]48[/C][C]0.006567[/C][C]0.0719[/C][C]0.471386[/C][/ROW]
[ROW][C]49[/C][C]-0.045677[/C][C]-0.5004[/C][C]0.308865[/C][/ROW]
[ROW][C]50[/C][C]-0.049855[/C][C]-0.5461[/C][C]0.292996[/C][/ROW]
[ROW][C]51[/C][C]-0.011711[/C][C]-0.1283[/C][C]0.449067[/C][/ROW]
[ROW][C]52[/C][C]-0.036307[/C][C]-0.3977[/C][C]0.34577[/C][/ROW]
[ROW][C]53[/C][C]-0.004326[/C][C]-0.0474[/C][C]0.48114[/C][/ROW]
[ROW][C]54[/C][C]-0.008753[/C][C]-0.0959[/C][C]0.461887[/C][/ROW]
[ROW][C]55[/C][C]-0.00419[/C][C]-0.0459[/C][C]0.481731[/C][/ROW]
[ROW][C]56[/C][C]-0.039856[/C][C]-0.4366[/C][C]0.331593[/C][/ROW]
[ROW][C]57[/C][C]0.014178[/C][C]0.1553[/C][C]0.438419[/C][/ROW]
[ROW][C]58[/C][C]0.020339[/C][C]0.2228[/C][C]0.412034[/C][/ROW]
[ROW][C]59[/C][C]-0.010051[/C][C]-0.1101[/C][C]0.456255[/C][/ROW]
[ROW][C]60[/C][C]-0.015484[/C][C]-0.1696[/C][C]0.432796[/C][/ROW]
[/TABLE]
Source: https://freestatistics.org/blog/index.php?pk=123191&T=2

Globally Unique Identifier (entire table): ba.freestatistics.org/blog/index.php?pk=123191&T=2

As an alternative you can also use a QR Code:  

The GUIDs for individual cells are displayed in the table below:

Partial Autocorrelation Function
Time lag kPACF(k)T-STATP-value
10.97090410.63570
2-0.114677-1.25620.105738
30.0041250.04520.482018
40.0746330.81760.207614
5-0.008501-0.09310.46298
60.0310510.34010.367171
70.0773580.84740.199225
80.0034250.03750.485066
9-0.023318-0.25540.399413
10-0.001088-0.01190.495254
11-0.00638-0.06990.472197
12-0.051302-0.5620.287589
13-0.152868-1.67460.04831
14-0.078842-0.86370.194746
15-0.017273-0.18920.425121
160.0282390.30930.378799
17-0.006931-0.07590.469801
180.0090140.09870.460751
190.0860530.94270.173874
200.0056190.06160.475508
210.0006180.00680.497305
220.0227780.24950.401692
230.0100260.10980.456366
24-0.037809-0.41420.339741
25-0.102881-1.1270.130995
26-0.069691-0.76340.223353
27-0.000415-0.00450.49819
28-0.007977-0.08740.465254
29-0.017754-0.19450.423063
30-0.013449-0.14730.441562
310.0433660.47510.317807
32-0.023579-0.25830.398311
33-0.003986-0.04370.482623
340.0292570.32050.374575
35-0.001532-0.01680.493319
36-0.01869-0.20470.419061
37-0.0441-0.48310.314957
38-0.058005-0.63540.263185
39-0.019723-0.21610.414655
40-0.024537-0.26880.394277
410.0002120.00230.499074
420.0127390.13960.444623
430.0348990.38230.351459
44-0.028258-0.30950.378721
450.0173930.19050.424606
460.0185610.20330.41961
47-0.016588-0.18170.428056
480.0065670.07190.471386
49-0.045677-0.50040.308865
50-0.049855-0.54610.292996
51-0.011711-0.12830.449067
52-0.036307-0.39770.34577
53-0.004326-0.04740.48114
54-0.008753-0.09590.461887
55-0.00419-0.04590.481731
56-0.039856-0.43660.331593
570.0141780.15530.438419
580.0203390.22280.412034
59-0.010051-0.11010.456255
60-0.015484-0.16960.432796


Parameters (Session):
par1 = 60 ; par2 = 1 ; par3 = 0 ; par4 = 0 ; par5 = 12 ; par6 = White Noise ; par7 = 0.95 ;
Parameters (R input):
par1 = 60 ; par2 = 1 ; par3 = 0 ; par4 = 0 ; par5 = 12 ; par6 = White Noise ; par7 = 0.95 ; par8 = ;
R code (references can be found in the software module):
if (par1 == 'Default') {
par1 = 10*log10(length(x))
} else {
par1 <- as.numeric(par1)
}
par2 <- as.numeric(par2)
par3 <- as.numeric(par3)
par4 <- as.numeric(par4)
par5 <- as.numeric(par5)
if (par6 == 'White Noise') par6 <- 'white' else par6 <- 'ma'
par7 <- as.numeric(par7)
if (par8 != '') par8 <- as.numeric(par8)
ox <- x
if (par8 == '') {
if (par2 == 0) {
x <- log(x)
} else {
x <- (x ^ par2 - 1) / par2
}
} else {
x <- log(x,base=par8)
}
if (par3 > 0) x <- diff(x,lag=1,difference=par3)
if (par4 > 0) x <- diff(x,lag=par5,difference=par4)
bitmap(file='picts.png')
op <- par(mfrow=c(2,1))
plot(ox,type='l',main='Original Time Series',xlab='time',ylab='value')
if (par8=='') {
mytitle <- paste('Working Time Series (lambda=',par2,', d=',par3,', D=',par4,')',sep='')
mysub <- paste('(lambda=',par2,', d=',par3,', D=',par4,', CI=', par7, ', CI type=',par6,')',sep='')
} else {
mytitle <- paste('Working Time Series (base=',par8,', d=',par3,', D=',par4,')',sep='')
mysub <- paste('(base=',par8,', d=',par3,', D=',par4,', CI=', par7, ', CI type=',par6,')',sep='')
}
plot(x,type='l', main=mytitle,xlab='time',ylab='value')
par(op)
dev.off()
bitmap(file='pic1.png')
racf <- acf(x, par1, main='Autocorrelation', xlab='time lag', ylab='ACF', ci.type=par6, ci=par7, sub=mysub)
dev.off()
bitmap(file='pic2.png')
rpacf <- pacf(x,par1,main='Partial Autocorrelation',xlab='lags',ylab='PACF',sub=mysub)
dev.off()
(myacf <- c(racf$acf))
(mypacf <- c(rpacf$acf))
lengthx <- length(x)
sqrtn <- sqrt(lengthx)
load(file='createtable')
a<-table.start()
a<-table.row.start(a)
a<-table.element(a,'Autocorrelation Function',4,TRUE)
a<-table.row.end(a)
a<-table.row.start(a)
a<-table.element(a,'Time lag k',header=TRUE)
a<-table.element(a,hyperlink('basics.htm','ACF(k)','click here for more information about the Autocorrelation Function'),header=TRUE)
a<-table.element(a,'T-STAT',header=TRUE)
a<-table.element(a,'P-value',header=TRUE)
a<-table.row.end(a)
for (i in 2:(par1+1)) {
a<-table.row.start(a)
a<-table.element(a,i-1,header=TRUE)
a<-table.element(a,round(myacf[i],6))
mytstat <- myacf[i]*sqrtn
a<-table.element(a,round(mytstat,4))
a<-table.element(a,round(1-pt(abs(mytstat),lengthx),6))
a<-table.row.end(a)
}
a<-table.end(a)
table.save(a,file='mytable.tab')
a<-table.start()
a<-table.row.start(a)
a<-table.element(a,'Partial Autocorrelation Function',4,TRUE)
a<-table.row.end(a)
a<-table.row.start(a)
a<-table.element(a,'Time lag k',header=TRUE)
a<-table.element(a,hyperlink('basics.htm','PACF(k)','click here for more information about the Partial Autocorrelation Function'),header=TRUE)
a<-table.element(a,'T-STAT',header=TRUE)
a<-table.element(a,'P-value',header=TRUE)
a<-table.row.end(a)
for (i in 1:par1) {
a<-table.row.start(a)
a<-table.element(a,i,header=TRUE)
a<-table.element(a,round(mypacf[i],6))
mytstat <- mypacf[i]*sqrtn
a<-table.element(a,round(mytstat,4))
a<-table.element(a,round(1-pt(abs(mytstat),lengthx),6))
a<-table.row.end(a)
}
a<-table.end(a)
table.save(a,file='mytable1.tab')