Free Statistics

of Irreproducible Research!

Author's title

Author*Unverified author*
R Software Modulerwasp_autocorrelation.wasp
Title produced by software(Partial) Autocorrelation Function
Date of computationThu, 28 Jul 2011 05:49:38 -0400
Cite this page as followsStatistical Computations at FreeStatistics.org, Office for Research Development and Education, URL https://freestatistics.org/blog/index.php?v=date/2011/Jul/28/t1311846741pxuzwe9293gjy5m.htm/, Retrieved Thu, 16 May 2024 07:21:53 +0000
Statistical Computations at FreeStatistics.org, Office for Research Development and Education, URL https://freestatistics.org/blog/index.php?pk=123192, Retrieved Thu, 16 May 2024 07:21:53 +0000
QR Codes:

Original text written by user:
IsPrivate?No (this computation is public)
User-defined keywordsvicky koopmans
Estimated Impact191
Family? (F = Feedback message, R = changed R code, M = changed R Module, P = changed Parameters, D = changed Data)
-       [(Partial) Autocorrelation Function] [tijdreeks1-stap21] [2011-07-28 09:49:38] [30681199eb2b91d06bf445c1ee7d20a2] [Current]
Feedback Forum

Post a new message
Dataseries X:
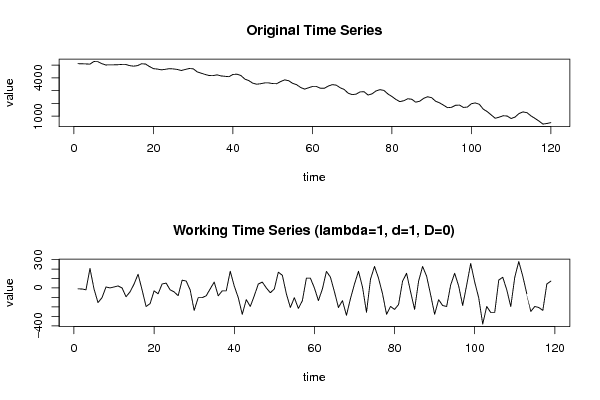
5115
5105
5094
5074
5280
5270
5115
5012
5022
5022
5032
5053
5053
4960
4919
4960
5105
5084
4888
4722
4691
4629
4671
4722
4702
4660
4578
4660
4733
4712
4474
4371
4268
4185
4175
4237
4154
4123
4092
4268
4288
4185
3906
3782
3586
3503
3544
3606
3606
3555
3544
3710
3844
3782
3575
3472
3255
3121
3224
3327
3327
3193
3183
3358
3472
3431
3224
3090
2800
2687
2728
2904
2914
2656
2749
2976
3079
3017
2738
2542
2315
2139
2211
2366
2325
2098
2170
2397
2521
2449
2170
2046
1860
1664
1695
1850
1870
1684
1715
1974
2036
1932
1550
1354
1095
837
920
1033
1013
816
930
1209
1333
1271
1023
827
620
382
424
496


Summary of computational transaction
Raw Inputview raw input (R code)
Raw Outputview raw output of R engine
Computing time1 seconds
R Server'Herman Ole Andreas Wold' @ wold.wessa.net

\begin{tabular}{lllllllll}
\hline
Summary of computational transaction \tabularnewline
Raw Input & view raw input (R code)  \tabularnewline
Raw Output & view raw output of R engine  \tabularnewline
Computing time & 1 seconds \tabularnewline
R Server & 'Herman Ole Andreas Wold' @ wold.wessa.net \tabularnewline
\hline
\end{tabular}
%Source: https://freestatistics.org/blog/index.php?pk=123192&T=0

[TABLE]
[ROW][C]Summary of computational transaction[/C][/ROW]
[ROW][C]Raw Input[/C][C]view raw input (R code) [/C][/ROW]
[ROW][C]Raw Output[/C][C]view raw output of R engine [/C][/ROW]
[ROW][C]Computing time[/C][C]1 seconds[/C][/ROW]
[ROW][C]R Server[/C][C]'Herman Ole Andreas Wold' @ wold.wessa.net[/C][/ROW]
[/TABLE]
Source: https://freestatistics.org/blog/index.php?pk=123192&T=0

Globally Unique Identifier (entire table): ba.freestatistics.org/blog/index.php?pk=123192&T=0

As an alternative you can also use a QR Code:  

The GUIDs for individual cells are displayed in the table below:

Summary of computational transaction
Raw Inputview raw input (R code)
Raw Outputview raw output of R engine
Computing time1 seconds
R Server'Herman Ole Andreas Wold' @ wold.wessa.net


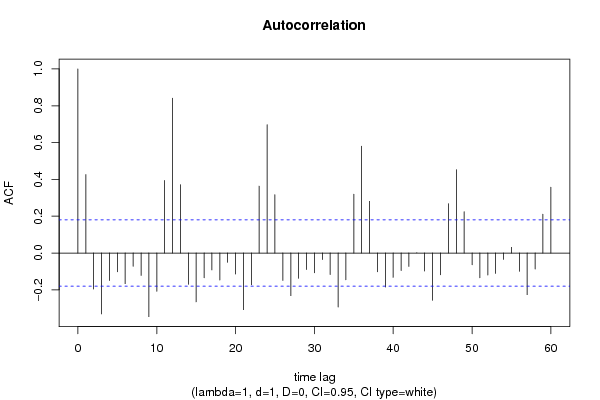
Autocorrelation Function
Time lag kACF(k)T-STATP-value
10.4261364.64864e-06
2-0.195492-2.13260.017508
3-0.330551-3.60590.000228
4-0.14919-1.62750.053141
5-0.102221-1.11510.133526
6-0.166149-1.81250.036217
7-0.071828-0.78360.21743
8-0.121667-1.32720.093486
9-0.345673-3.77080.000127
10-0.207859-2.26750.012583
110.3936314.2941.8e-05
120.8408569.17270
130.3706634.04354.7e-05
14-0.169613-1.85030.033378
15-0.265255-2.89360.002266
16-0.134758-1.470.072096
17-0.091684-1.00020.159633
18-0.146283-1.59580.056597
19-0.050395-0.54970.291764
20-0.114083-1.24450.10788
21-0.30758-3.35530.000532
22-0.172858-1.88570.03089
230.3632753.96296.3e-05
240.6970927.60440
250.3169663.45770.000378
26-0.14855-1.62050.053887
27-0.23146-2.52490.006444
28-0.137059-1.49510.068762
29-0.089274-0.97390.166049
30-0.10692-1.16640.1229
31-0.035683-0.38930.34889
32-0.11691-1.27530.102337
33-0.293063-3.19690.00089
34-0.144885-1.58050.058323
350.3191463.48150.000349
360.5798776.32570
370.2807683.06280.001356
38-0.101951-1.11220.134156
39-0.184815-2.01610.023021
40-0.132168-1.44180.075995
41-0.094632-1.03230.152009
42-0.072607-0.7920.214955
430.0005150.00560.497764
44-0.098028-1.06940.143536
45-0.256506-2.79820.002998
46-0.117825-1.28530.100588
470.2680932.92450.002066
480.4522914.93391e-06
490.2243052.44690.007936
50-0.064225-0.70060.242456
51-0.1348-1.47050.072033
52-0.119022-1.29840.098334
53-0.110637-1.20690.114931
54-0.034595-0.37740.353281
550.0306080.33390.369524
56-0.098947-1.07940.1413
57-0.226088-2.46630.007538
58-0.086488-0.94350.173675
590.2104362.29560.011725
600.3573663.89848e-05

\begin{tabular}{lllllllll}
\hline
Autocorrelation Function \tabularnewline
Time lag k & ACF(k) & T-STAT & P-value \tabularnewline
1 & 0.426136 & 4.6486 & 4e-06 \tabularnewline
2 & -0.195492 & -2.1326 & 0.017508 \tabularnewline
3 & -0.330551 & -3.6059 & 0.000228 \tabularnewline
4 & -0.14919 & -1.6275 & 0.053141 \tabularnewline
5 & -0.102221 & -1.1151 & 0.133526 \tabularnewline
6 & -0.166149 & -1.8125 & 0.036217 \tabularnewline
7 & -0.071828 & -0.7836 & 0.21743 \tabularnewline
8 & -0.121667 & -1.3272 & 0.093486 \tabularnewline
9 & -0.345673 & -3.7708 & 0.000127 \tabularnewline
10 & -0.207859 & -2.2675 & 0.012583 \tabularnewline
11 & 0.393631 & 4.294 & 1.8e-05 \tabularnewline
12 & 0.840856 & 9.1727 & 0 \tabularnewline
13 & 0.370663 & 4.0435 & 4.7e-05 \tabularnewline
14 & -0.169613 & -1.8503 & 0.033378 \tabularnewline
15 & -0.265255 & -2.8936 & 0.002266 \tabularnewline
16 & -0.134758 & -1.47 & 0.072096 \tabularnewline
17 & -0.091684 & -1.0002 & 0.159633 \tabularnewline
18 & -0.146283 & -1.5958 & 0.056597 \tabularnewline
19 & -0.050395 & -0.5497 & 0.291764 \tabularnewline
20 & -0.114083 & -1.2445 & 0.10788 \tabularnewline
21 & -0.30758 & -3.3553 & 0.000532 \tabularnewline
22 & -0.172858 & -1.8857 & 0.03089 \tabularnewline
23 & 0.363275 & 3.9629 & 6.3e-05 \tabularnewline
24 & 0.697092 & 7.6044 & 0 \tabularnewline
25 & 0.316966 & 3.4577 & 0.000378 \tabularnewline
26 & -0.14855 & -1.6205 & 0.053887 \tabularnewline
27 & -0.23146 & -2.5249 & 0.006444 \tabularnewline
28 & -0.137059 & -1.4951 & 0.068762 \tabularnewline
29 & -0.089274 & -0.9739 & 0.166049 \tabularnewline
30 & -0.10692 & -1.1664 & 0.1229 \tabularnewline
31 & -0.035683 & -0.3893 & 0.34889 \tabularnewline
32 & -0.11691 & -1.2753 & 0.102337 \tabularnewline
33 & -0.293063 & -3.1969 & 0.00089 \tabularnewline
34 & -0.144885 & -1.5805 & 0.058323 \tabularnewline
35 & 0.319146 & 3.4815 & 0.000349 \tabularnewline
36 & 0.579877 & 6.3257 & 0 \tabularnewline
37 & 0.280768 & 3.0628 & 0.001356 \tabularnewline
38 & -0.101951 & -1.1122 & 0.134156 \tabularnewline
39 & -0.184815 & -2.0161 & 0.023021 \tabularnewline
40 & -0.132168 & -1.4418 & 0.075995 \tabularnewline
41 & -0.094632 & -1.0323 & 0.152009 \tabularnewline
42 & -0.072607 & -0.792 & 0.214955 \tabularnewline
43 & 0.000515 & 0.0056 & 0.497764 \tabularnewline
44 & -0.098028 & -1.0694 & 0.143536 \tabularnewline
45 & -0.256506 & -2.7982 & 0.002998 \tabularnewline
46 & -0.117825 & -1.2853 & 0.100588 \tabularnewline
47 & 0.268093 & 2.9245 & 0.002066 \tabularnewline
48 & 0.452291 & 4.9339 & 1e-06 \tabularnewline
49 & 0.224305 & 2.4469 & 0.007936 \tabularnewline
50 & -0.064225 & -0.7006 & 0.242456 \tabularnewline
51 & -0.1348 & -1.4705 & 0.072033 \tabularnewline
52 & -0.119022 & -1.2984 & 0.098334 \tabularnewline
53 & -0.110637 & -1.2069 & 0.114931 \tabularnewline
54 & -0.034595 & -0.3774 & 0.353281 \tabularnewline
55 & 0.030608 & 0.3339 & 0.369524 \tabularnewline
56 & -0.098947 & -1.0794 & 0.1413 \tabularnewline
57 & -0.226088 & -2.4663 & 0.007538 \tabularnewline
58 & -0.086488 & -0.9435 & 0.173675 \tabularnewline
59 & 0.210436 & 2.2956 & 0.011725 \tabularnewline
60 & 0.357366 & 3.8984 & 8e-05 \tabularnewline
\hline
\end{tabular}
%Source: https://freestatistics.org/blog/index.php?pk=123192&T=1

[TABLE]
[ROW][C]Autocorrelation Function[/C][/ROW]
[ROW][C]Time lag k[/C][C]ACF(k)[/C][C]T-STAT[/C][C]P-value[/C][/ROW]
[ROW][C]1[/C][C]0.426136[/C][C]4.6486[/C][C]4e-06[/C][/ROW]
[ROW][C]2[/C][C]-0.195492[/C][C]-2.1326[/C][C]0.017508[/C][/ROW]
[ROW][C]3[/C][C]-0.330551[/C][C]-3.6059[/C][C]0.000228[/C][/ROW]
[ROW][C]4[/C][C]-0.14919[/C][C]-1.6275[/C][C]0.053141[/C][/ROW]
[ROW][C]5[/C][C]-0.102221[/C][C]-1.1151[/C][C]0.133526[/C][/ROW]
[ROW][C]6[/C][C]-0.166149[/C][C]-1.8125[/C][C]0.036217[/C][/ROW]
[ROW][C]7[/C][C]-0.071828[/C][C]-0.7836[/C][C]0.21743[/C][/ROW]
[ROW][C]8[/C][C]-0.121667[/C][C]-1.3272[/C][C]0.093486[/C][/ROW]
[ROW][C]9[/C][C]-0.345673[/C][C]-3.7708[/C][C]0.000127[/C][/ROW]
[ROW][C]10[/C][C]-0.207859[/C][C]-2.2675[/C][C]0.012583[/C][/ROW]
[ROW][C]11[/C][C]0.393631[/C][C]4.294[/C][C]1.8e-05[/C][/ROW]
[ROW][C]12[/C][C]0.840856[/C][C]9.1727[/C][C]0[/C][/ROW]
[ROW][C]13[/C][C]0.370663[/C][C]4.0435[/C][C]4.7e-05[/C][/ROW]
[ROW][C]14[/C][C]-0.169613[/C][C]-1.8503[/C][C]0.033378[/C][/ROW]
[ROW][C]15[/C][C]-0.265255[/C][C]-2.8936[/C][C]0.002266[/C][/ROW]
[ROW][C]16[/C][C]-0.134758[/C][C]-1.47[/C][C]0.072096[/C][/ROW]
[ROW][C]17[/C][C]-0.091684[/C][C]-1.0002[/C][C]0.159633[/C][/ROW]
[ROW][C]18[/C][C]-0.146283[/C][C]-1.5958[/C][C]0.056597[/C][/ROW]
[ROW][C]19[/C][C]-0.050395[/C][C]-0.5497[/C][C]0.291764[/C][/ROW]
[ROW][C]20[/C][C]-0.114083[/C][C]-1.2445[/C][C]0.10788[/C][/ROW]
[ROW][C]21[/C][C]-0.30758[/C][C]-3.3553[/C][C]0.000532[/C][/ROW]
[ROW][C]22[/C][C]-0.172858[/C][C]-1.8857[/C][C]0.03089[/C][/ROW]
[ROW][C]23[/C][C]0.363275[/C][C]3.9629[/C][C]6.3e-05[/C][/ROW]
[ROW][C]24[/C][C]0.697092[/C][C]7.6044[/C][C]0[/C][/ROW]
[ROW][C]25[/C][C]0.316966[/C][C]3.4577[/C][C]0.000378[/C][/ROW]
[ROW][C]26[/C][C]-0.14855[/C][C]-1.6205[/C][C]0.053887[/C][/ROW]
[ROW][C]27[/C][C]-0.23146[/C][C]-2.5249[/C][C]0.006444[/C][/ROW]
[ROW][C]28[/C][C]-0.137059[/C][C]-1.4951[/C][C]0.068762[/C][/ROW]
[ROW][C]29[/C][C]-0.089274[/C][C]-0.9739[/C][C]0.166049[/C][/ROW]
[ROW][C]30[/C][C]-0.10692[/C][C]-1.1664[/C][C]0.1229[/C][/ROW]
[ROW][C]31[/C][C]-0.035683[/C][C]-0.3893[/C][C]0.34889[/C][/ROW]
[ROW][C]32[/C][C]-0.11691[/C][C]-1.2753[/C][C]0.102337[/C][/ROW]
[ROW][C]33[/C][C]-0.293063[/C][C]-3.1969[/C][C]0.00089[/C][/ROW]
[ROW][C]34[/C][C]-0.144885[/C][C]-1.5805[/C][C]0.058323[/C][/ROW]
[ROW][C]35[/C][C]0.319146[/C][C]3.4815[/C][C]0.000349[/C][/ROW]
[ROW][C]36[/C][C]0.579877[/C][C]6.3257[/C][C]0[/C][/ROW]
[ROW][C]37[/C][C]0.280768[/C][C]3.0628[/C][C]0.001356[/C][/ROW]
[ROW][C]38[/C][C]-0.101951[/C][C]-1.1122[/C][C]0.134156[/C][/ROW]
[ROW][C]39[/C][C]-0.184815[/C][C]-2.0161[/C][C]0.023021[/C][/ROW]
[ROW][C]40[/C][C]-0.132168[/C][C]-1.4418[/C][C]0.075995[/C][/ROW]
[ROW][C]41[/C][C]-0.094632[/C][C]-1.0323[/C][C]0.152009[/C][/ROW]
[ROW][C]42[/C][C]-0.072607[/C][C]-0.792[/C][C]0.214955[/C][/ROW]
[ROW][C]43[/C][C]0.000515[/C][C]0.0056[/C][C]0.497764[/C][/ROW]
[ROW][C]44[/C][C]-0.098028[/C][C]-1.0694[/C][C]0.143536[/C][/ROW]
[ROW][C]45[/C][C]-0.256506[/C][C]-2.7982[/C][C]0.002998[/C][/ROW]
[ROW][C]46[/C][C]-0.117825[/C][C]-1.2853[/C][C]0.100588[/C][/ROW]
[ROW][C]47[/C][C]0.268093[/C][C]2.9245[/C][C]0.002066[/C][/ROW]
[ROW][C]48[/C][C]0.452291[/C][C]4.9339[/C][C]1e-06[/C][/ROW]
[ROW][C]49[/C][C]0.224305[/C][C]2.4469[/C][C]0.007936[/C][/ROW]
[ROW][C]50[/C][C]-0.064225[/C][C]-0.7006[/C][C]0.242456[/C][/ROW]
[ROW][C]51[/C][C]-0.1348[/C][C]-1.4705[/C][C]0.072033[/C][/ROW]
[ROW][C]52[/C][C]-0.119022[/C][C]-1.2984[/C][C]0.098334[/C][/ROW]
[ROW][C]53[/C][C]-0.110637[/C][C]-1.2069[/C][C]0.114931[/C][/ROW]
[ROW][C]54[/C][C]-0.034595[/C][C]-0.3774[/C][C]0.353281[/C][/ROW]
[ROW][C]55[/C][C]0.030608[/C][C]0.3339[/C][C]0.369524[/C][/ROW]
[ROW][C]56[/C][C]-0.098947[/C][C]-1.0794[/C][C]0.1413[/C][/ROW]
[ROW][C]57[/C][C]-0.226088[/C][C]-2.4663[/C][C]0.007538[/C][/ROW]
[ROW][C]58[/C][C]-0.086488[/C][C]-0.9435[/C][C]0.173675[/C][/ROW]
[ROW][C]59[/C][C]0.210436[/C][C]2.2956[/C][C]0.011725[/C][/ROW]
[ROW][C]60[/C][C]0.357366[/C][C]3.8984[/C][C]8e-05[/C][/ROW]
[/TABLE]
Source: https://freestatistics.org/blog/index.php?pk=123192&T=1

Globally Unique Identifier (entire table): ba.freestatistics.org/blog/index.php?pk=123192&T=1

As an alternative you can also use a QR Code:  

The GUIDs for individual cells are displayed in the table below:

Autocorrelation Function
Time lag kACF(k)T-STATP-value
10.4261364.64864e-06
2-0.195492-2.13260.017508
3-0.330551-3.60590.000228
4-0.14919-1.62750.053141
5-0.102221-1.11510.133526
6-0.166149-1.81250.036217
7-0.071828-0.78360.21743
8-0.121667-1.32720.093486
9-0.345673-3.77080.000127
10-0.207859-2.26750.012583
110.3936314.2941.8e-05
120.8408569.17270
130.3706634.04354.7e-05
14-0.169613-1.85030.033378
15-0.265255-2.89360.002266
16-0.134758-1.470.072096
17-0.091684-1.00020.159633
18-0.146283-1.59580.056597
19-0.050395-0.54970.291764
20-0.114083-1.24450.10788
21-0.30758-3.35530.000532
22-0.172858-1.88570.03089
230.3632753.96296.3e-05
240.6970927.60440
250.3169663.45770.000378
26-0.14855-1.62050.053887
27-0.23146-2.52490.006444
28-0.137059-1.49510.068762
29-0.089274-0.97390.166049
30-0.10692-1.16640.1229
31-0.035683-0.38930.34889
32-0.11691-1.27530.102337
33-0.293063-3.19690.00089
34-0.144885-1.58050.058323
350.3191463.48150.000349
360.5798776.32570
370.2807683.06280.001356
38-0.101951-1.11220.134156
39-0.184815-2.01610.023021
40-0.132168-1.44180.075995
41-0.094632-1.03230.152009
42-0.072607-0.7920.214955
430.0005150.00560.497764
44-0.098028-1.06940.143536
45-0.256506-2.79820.002998
46-0.117825-1.28530.100588
470.2680932.92450.002066
480.4522914.93391e-06
490.2243052.44690.007936
50-0.064225-0.70060.242456
51-0.1348-1.47050.072033
52-0.119022-1.29840.098334
53-0.110637-1.20690.114931
54-0.034595-0.37740.353281
550.0306080.33390.369524
56-0.098947-1.07940.1413
57-0.226088-2.46630.007538
58-0.086488-0.94350.173675
590.2104362.29560.011725
600.3573663.89848e-05


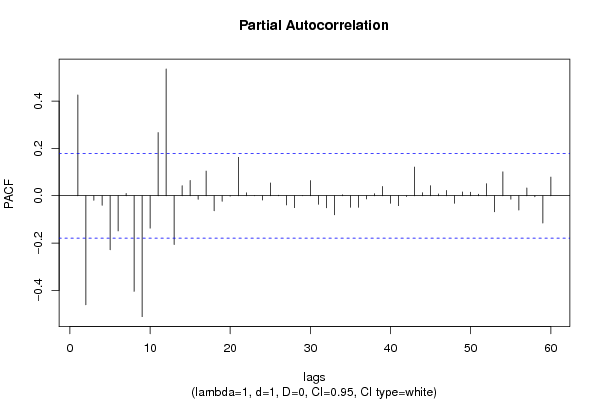
Partial Autocorrelation Function
Time lag kPACF(k)T-STATP-value
10.4261364.64864e-06
2-0.460752-5.02621e-06
3-0.019419-0.21180.416298
4-0.040069-0.43710.331416
5-0.228431-2.49190.007042
6-0.148481-1.61970.053968
70.0095520.10420.458595
8-0.40431-4.41051.1e-05
9-0.511308-5.57770
10-0.136999-1.49450.068849
110.2670222.91290.002139
120.5362125.84940
13-0.20642-2.25180.013085
140.0424620.46320.32203
150.0646140.70490.24114
16-0.015223-0.16610.434193
170.1043221.1380.128699
18-0.063453-0.69220.245084
19-0.023286-0.2540.399961
20-0.001677-0.01830.492716
210.1623481.7710.03956
220.0120920.13190.44764
23-7.3e-05-8e-040.499685
24-0.017919-0.19550.422677
250.0537490.58630.279382
260.0020190.0220.491233
27-0.038741-0.42260.336671
28-0.050451-0.55040.291554
29-6.2e-05-7e-040.499731
300.0640650.69890.243001
31-0.036043-0.39320.347443
32-0.051085-0.55730.289194
33-0.080621-0.87950.190458
340.0036890.04020.483982
35-0.048938-0.53380.297222
36-0.048381-0.52780.29932
37-0.013287-0.14490.4425
380.0087670.09560.461984
390.0391770.42740.334941
40-0.032069-0.34980.363542
41-0.041714-0.4550.324953
42-0.003001-0.03270.486968
430.1212141.32230.094304
440.0129430.14120.44398
450.0421510.45980.323246
460.0077520.08460.466374
470.0224740.24520.403377
48-0.031571-0.34440.365578
490.0159360.17380.431142
500.0148130.16160.435949
510.0060330.06580.473819
520.050580.55180.291072
53-0.067621-0.73770.231087
540.1009451.10120.13652
55-0.014289-0.15590.438196
56-0.06058-0.66090.254992
570.0328590.35850.360319
58-0.004026-0.04390.482521
59-0.115291-1.25770.105487
600.0787680.85930.195964

\begin{tabular}{lllllllll}
\hline
Partial Autocorrelation Function \tabularnewline
Time lag k & PACF(k) & T-STAT & P-value \tabularnewline
1 & 0.426136 & 4.6486 & 4e-06 \tabularnewline
2 & -0.460752 & -5.0262 & 1e-06 \tabularnewline
3 & -0.019419 & -0.2118 & 0.416298 \tabularnewline
4 & -0.040069 & -0.4371 & 0.331416 \tabularnewline
5 & -0.228431 & -2.4919 & 0.007042 \tabularnewline
6 & -0.148481 & -1.6197 & 0.053968 \tabularnewline
7 & 0.009552 & 0.1042 & 0.458595 \tabularnewline
8 & -0.40431 & -4.4105 & 1.1e-05 \tabularnewline
9 & -0.511308 & -5.5777 & 0 \tabularnewline
10 & -0.136999 & -1.4945 & 0.068849 \tabularnewline
11 & 0.267022 & 2.9129 & 0.002139 \tabularnewline
12 & 0.536212 & 5.8494 & 0 \tabularnewline
13 & -0.20642 & -2.2518 & 0.013085 \tabularnewline
14 & 0.042462 & 0.4632 & 0.32203 \tabularnewline
15 & 0.064614 & 0.7049 & 0.24114 \tabularnewline
16 & -0.015223 & -0.1661 & 0.434193 \tabularnewline
17 & 0.104322 & 1.138 & 0.128699 \tabularnewline
18 & -0.063453 & -0.6922 & 0.245084 \tabularnewline
19 & -0.023286 & -0.254 & 0.399961 \tabularnewline
20 & -0.001677 & -0.0183 & 0.492716 \tabularnewline
21 & 0.162348 & 1.771 & 0.03956 \tabularnewline
22 & 0.012092 & 0.1319 & 0.44764 \tabularnewline
23 & -7.3e-05 & -8e-04 & 0.499685 \tabularnewline
24 & -0.017919 & -0.1955 & 0.422677 \tabularnewline
25 & 0.053749 & 0.5863 & 0.279382 \tabularnewline
26 & 0.002019 & 0.022 & 0.491233 \tabularnewline
27 & -0.038741 & -0.4226 & 0.336671 \tabularnewline
28 & -0.050451 & -0.5504 & 0.291554 \tabularnewline
29 & -6.2e-05 & -7e-04 & 0.499731 \tabularnewline
30 & 0.064065 & 0.6989 & 0.243001 \tabularnewline
31 & -0.036043 & -0.3932 & 0.347443 \tabularnewline
32 & -0.051085 & -0.5573 & 0.289194 \tabularnewline
33 & -0.080621 & -0.8795 & 0.190458 \tabularnewline
34 & 0.003689 & 0.0402 & 0.483982 \tabularnewline
35 & -0.048938 & -0.5338 & 0.297222 \tabularnewline
36 & -0.048381 & -0.5278 & 0.29932 \tabularnewline
37 & -0.013287 & -0.1449 & 0.4425 \tabularnewline
38 & 0.008767 & 0.0956 & 0.461984 \tabularnewline
39 & 0.039177 & 0.4274 & 0.334941 \tabularnewline
40 & -0.032069 & -0.3498 & 0.363542 \tabularnewline
41 & -0.041714 & -0.455 & 0.324953 \tabularnewline
42 & -0.003001 & -0.0327 & 0.486968 \tabularnewline
43 & 0.121214 & 1.3223 & 0.094304 \tabularnewline
44 & 0.012943 & 0.1412 & 0.44398 \tabularnewline
45 & 0.042151 & 0.4598 & 0.323246 \tabularnewline
46 & 0.007752 & 0.0846 & 0.466374 \tabularnewline
47 & 0.022474 & 0.2452 & 0.403377 \tabularnewline
48 & -0.031571 & -0.3444 & 0.365578 \tabularnewline
49 & 0.015936 & 0.1738 & 0.431142 \tabularnewline
50 & 0.014813 & 0.1616 & 0.435949 \tabularnewline
51 & 0.006033 & 0.0658 & 0.473819 \tabularnewline
52 & 0.05058 & 0.5518 & 0.291072 \tabularnewline
53 & -0.067621 & -0.7377 & 0.231087 \tabularnewline
54 & 0.100945 & 1.1012 & 0.13652 \tabularnewline
55 & -0.014289 & -0.1559 & 0.438196 \tabularnewline
56 & -0.06058 & -0.6609 & 0.254992 \tabularnewline
57 & 0.032859 & 0.3585 & 0.360319 \tabularnewline
58 & -0.004026 & -0.0439 & 0.482521 \tabularnewline
59 & -0.115291 & -1.2577 & 0.105487 \tabularnewline
60 & 0.078768 & 0.8593 & 0.195964 \tabularnewline
\hline
\end{tabular}
%Source: https://freestatistics.org/blog/index.php?pk=123192&T=2

[TABLE]
[ROW][C]Partial Autocorrelation Function[/C][/ROW]
[ROW][C]Time lag k[/C][C]PACF(k)[/C][C]T-STAT[/C][C]P-value[/C][/ROW]
[ROW][C]1[/C][C]0.426136[/C][C]4.6486[/C][C]4e-06[/C][/ROW]
[ROW][C]2[/C][C]-0.460752[/C][C]-5.0262[/C][C]1e-06[/C][/ROW]
[ROW][C]3[/C][C]-0.019419[/C][C]-0.2118[/C][C]0.416298[/C][/ROW]
[ROW][C]4[/C][C]-0.040069[/C][C]-0.4371[/C][C]0.331416[/C][/ROW]
[ROW][C]5[/C][C]-0.228431[/C][C]-2.4919[/C][C]0.007042[/C][/ROW]
[ROW][C]6[/C][C]-0.148481[/C][C]-1.6197[/C][C]0.053968[/C][/ROW]
[ROW][C]7[/C][C]0.009552[/C][C]0.1042[/C][C]0.458595[/C][/ROW]
[ROW][C]8[/C][C]-0.40431[/C][C]-4.4105[/C][C]1.1e-05[/C][/ROW]
[ROW][C]9[/C][C]-0.511308[/C][C]-5.5777[/C][C]0[/C][/ROW]
[ROW][C]10[/C][C]-0.136999[/C][C]-1.4945[/C][C]0.068849[/C][/ROW]
[ROW][C]11[/C][C]0.267022[/C][C]2.9129[/C][C]0.002139[/C][/ROW]
[ROW][C]12[/C][C]0.536212[/C][C]5.8494[/C][C]0[/C][/ROW]
[ROW][C]13[/C][C]-0.20642[/C][C]-2.2518[/C][C]0.013085[/C][/ROW]
[ROW][C]14[/C][C]0.042462[/C][C]0.4632[/C][C]0.32203[/C][/ROW]
[ROW][C]15[/C][C]0.064614[/C][C]0.7049[/C][C]0.24114[/C][/ROW]
[ROW][C]16[/C][C]-0.015223[/C][C]-0.1661[/C][C]0.434193[/C][/ROW]
[ROW][C]17[/C][C]0.104322[/C][C]1.138[/C][C]0.128699[/C][/ROW]
[ROW][C]18[/C][C]-0.063453[/C][C]-0.6922[/C][C]0.245084[/C][/ROW]
[ROW][C]19[/C][C]-0.023286[/C][C]-0.254[/C][C]0.399961[/C][/ROW]
[ROW][C]20[/C][C]-0.001677[/C][C]-0.0183[/C][C]0.492716[/C][/ROW]
[ROW][C]21[/C][C]0.162348[/C][C]1.771[/C][C]0.03956[/C][/ROW]
[ROW][C]22[/C][C]0.012092[/C][C]0.1319[/C][C]0.44764[/C][/ROW]
[ROW][C]23[/C][C]-7.3e-05[/C][C]-8e-04[/C][C]0.499685[/C][/ROW]
[ROW][C]24[/C][C]-0.017919[/C][C]-0.1955[/C][C]0.422677[/C][/ROW]
[ROW][C]25[/C][C]0.053749[/C][C]0.5863[/C][C]0.279382[/C][/ROW]
[ROW][C]26[/C][C]0.002019[/C][C]0.022[/C][C]0.491233[/C][/ROW]
[ROW][C]27[/C][C]-0.038741[/C][C]-0.4226[/C][C]0.336671[/C][/ROW]
[ROW][C]28[/C][C]-0.050451[/C][C]-0.5504[/C][C]0.291554[/C][/ROW]
[ROW][C]29[/C][C]-6.2e-05[/C][C]-7e-04[/C][C]0.499731[/C][/ROW]
[ROW][C]30[/C][C]0.064065[/C][C]0.6989[/C][C]0.243001[/C][/ROW]
[ROW][C]31[/C][C]-0.036043[/C][C]-0.3932[/C][C]0.347443[/C][/ROW]
[ROW][C]32[/C][C]-0.051085[/C][C]-0.5573[/C][C]0.289194[/C][/ROW]
[ROW][C]33[/C][C]-0.080621[/C][C]-0.8795[/C][C]0.190458[/C][/ROW]
[ROW][C]34[/C][C]0.003689[/C][C]0.0402[/C][C]0.483982[/C][/ROW]
[ROW][C]35[/C][C]-0.048938[/C][C]-0.5338[/C][C]0.297222[/C][/ROW]
[ROW][C]36[/C][C]-0.048381[/C][C]-0.5278[/C][C]0.29932[/C][/ROW]
[ROW][C]37[/C][C]-0.013287[/C][C]-0.1449[/C][C]0.4425[/C][/ROW]
[ROW][C]38[/C][C]0.008767[/C][C]0.0956[/C][C]0.461984[/C][/ROW]
[ROW][C]39[/C][C]0.039177[/C][C]0.4274[/C][C]0.334941[/C][/ROW]
[ROW][C]40[/C][C]-0.032069[/C][C]-0.3498[/C][C]0.363542[/C][/ROW]
[ROW][C]41[/C][C]-0.041714[/C][C]-0.455[/C][C]0.324953[/C][/ROW]
[ROW][C]42[/C][C]-0.003001[/C][C]-0.0327[/C][C]0.486968[/C][/ROW]
[ROW][C]43[/C][C]0.121214[/C][C]1.3223[/C][C]0.094304[/C][/ROW]
[ROW][C]44[/C][C]0.012943[/C][C]0.1412[/C][C]0.44398[/C][/ROW]
[ROW][C]45[/C][C]0.042151[/C][C]0.4598[/C][C]0.323246[/C][/ROW]
[ROW][C]46[/C][C]0.007752[/C][C]0.0846[/C][C]0.466374[/C][/ROW]
[ROW][C]47[/C][C]0.022474[/C][C]0.2452[/C][C]0.403377[/C][/ROW]
[ROW][C]48[/C][C]-0.031571[/C][C]-0.3444[/C][C]0.365578[/C][/ROW]
[ROW][C]49[/C][C]0.015936[/C][C]0.1738[/C][C]0.431142[/C][/ROW]
[ROW][C]50[/C][C]0.014813[/C][C]0.1616[/C][C]0.435949[/C][/ROW]
[ROW][C]51[/C][C]0.006033[/C][C]0.0658[/C][C]0.473819[/C][/ROW]
[ROW][C]52[/C][C]0.05058[/C][C]0.5518[/C][C]0.291072[/C][/ROW]
[ROW][C]53[/C][C]-0.067621[/C][C]-0.7377[/C][C]0.231087[/C][/ROW]
[ROW][C]54[/C][C]0.100945[/C][C]1.1012[/C][C]0.13652[/C][/ROW]
[ROW][C]55[/C][C]-0.014289[/C][C]-0.1559[/C][C]0.438196[/C][/ROW]
[ROW][C]56[/C][C]-0.06058[/C][C]-0.6609[/C][C]0.254992[/C][/ROW]
[ROW][C]57[/C][C]0.032859[/C][C]0.3585[/C][C]0.360319[/C][/ROW]
[ROW][C]58[/C][C]-0.004026[/C][C]-0.0439[/C][C]0.482521[/C][/ROW]
[ROW][C]59[/C][C]-0.115291[/C][C]-1.2577[/C][C]0.105487[/C][/ROW]
[ROW][C]60[/C][C]0.078768[/C][C]0.8593[/C][C]0.195964[/C][/ROW]
[/TABLE]
Source: https://freestatistics.org/blog/index.php?pk=123192&T=2

Globally Unique Identifier (entire table): ba.freestatistics.org/blog/index.php?pk=123192&T=2

As an alternative you can also use a QR Code:  

The GUIDs for individual cells are displayed in the table below:

Partial Autocorrelation Function
Time lag kPACF(k)T-STATP-value
10.4261364.64864e-06
2-0.460752-5.02621e-06
3-0.019419-0.21180.416298
4-0.040069-0.43710.331416
5-0.228431-2.49190.007042
6-0.148481-1.61970.053968
70.0095520.10420.458595
8-0.40431-4.41051.1e-05
9-0.511308-5.57770
10-0.136999-1.49450.068849
110.2670222.91290.002139
120.5362125.84940
13-0.20642-2.25180.013085
140.0424620.46320.32203
150.0646140.70490.24114
16-0.015223-0.16610.434193
170.1043221.1380.128699
18-0.063453-0.69220.245084
19-0.023286-0.2540.399961
20-0.001677-0.01830.492716
210.1623481.7710.03956
220.0120920.13190.44764
23-7.3e-05-8e-040.499685
24-0.017919-0.19550.422677
250.0537490.58630.279382
260.0020190.0220.491233
27-0.038741-0.42260.336671
28-0.050451-0.55040.291554
29-6.2e-05-7e-040.499731
300.0640650.69890.243001
31-0.036043-0.39320.347443
32-0.051085-0.55730.289194
33-0.080621-0.87950.190458
340.0036890.04020.483982
35-0.048938-0.53380.297222
36-0.048381-0.52780.29932
37-0.013287-0.14490.4425
380.0087670.09560.461984
390.0391770.42740.334941
40-0.032069-0.34980.363542
41-0.041714-0.4550.324953
42-0.003001-0.03270.486968
430.1212141.32230.094304
440.0129430.14120.44398
450.0421510.45980.323246
460.0077520.08460.466374
470.0224740.24520.403377
48-0.031571-0.34440.365578
490.0159360.17380.431142
500.0148130.16160.435949
510.0060330.06580.473819
520.050580.55180.291072
53-0.067621-0.73770.231087
540.1009451.10120.13652
55-0.014289-0.15590.438196
56-0.06058-0.66090.254992
570.0328590.35850.360319
58-0.004026-0.04390.482521
59-0.115291-1.25770.105487
600.0787680.85930.195964


Parameters (Session):
par1 = 60 ; par2 = 1 ; par3 = 1 ; par4 = 0 ; par5 = 12 ; par6 = White Noise ; par7 = 0.95 ;
Parameters (R input):
par1 = 60 ; par2 = 1 ; par3 = 1 ; par4 = 0 ; par5 = 12 ; par6 = White Noise ; par7 = 0.95 ; par8 = ;
R code (references can be found in the software module):
if (par1 == 'Default') {
par1 = 10*log10(length(x))
} else {
par1 <- as.numeric(par1)
}
par2 <- as.numeric(par2)
par3 <- as.numeric(par3)
par4 <- as.numeric(par4)
par5 <- as.numeric(par5)
if (par6 == 'White Noise') par6 <- 'white' else par6 <- 'ma'
par7 <- as.numeric(par7)
if (par8 != '') par8 <- as.numeric(par8)
ox <- x
if (par8 == '') {
if (par2 == 0) {
x <- log(x)
} else {
x <- (x ^ par2 - 1) / par2
}
} else {
x <- log(x,base=par8)
}
if (par3 > 0) x <- diff(x,lag=1,difference=par3)
if (par4 > 0) x <- diff(x,lag=par5,difference=par4)
bitmap(file='picts.png')
op <- par(mfrow=c(2,1))
plot(ox,type='l',main='Original Time Series',xlab='time',ylab='value')
if (par8=='') {
mytitle <- paste('Working Time Series (lambda=',par2,', d=',par3,', D=',par4,')',sep='')
mysub <- paste('(lambda=',par2,', d=',par3,', D=',par4,', CI=', par7, ', CI type=',par6,')',sep='')
} else {
mytitle <- paste('Working Time Series (base=',par8,', d=',par3,', D=',par4,')',sep='')
mysub <- paste('(base=',par8,', d=',par3,', D=',par4,', CI=', par7, ', CI type=',par6,')',sep='')
}
plot(x,type='l', main=mytitle,xlab='time',ylab='value')
par(op)
dev.off()
bitmap(file='pic1.png')
racf <- acf(x, par1, main='Autocorrelation', xlab='time lag', ylab='ACF', ci.type=par6, ci=par7, sub=mysub)
dev.off()
bitmap(file='pic2.png')
rpacf <- pacf(x,par1,main='Partial Autocorrelation',xlab='lags',ylab='PACF',sub=mysub)
dev.off()
(myacf <- c(racf$acf))
(mypacf <- c(rpacf$acf))
lengthx <- length(x)
sqrtn <- sqrt(lengthx)
load(file='createtable')
a<-table.start()
a<-table.row.start(a)
a<-table.element(a,'Autocorrelation Function',4,TRUE)
a<-table.row.end(a)
a<-table.row.start(a)
a<-table.element(a,'Time lag k',header=TRUE)
a<-table.element(a,hyperlink('basics.htm','ACF(k)','click here for more information about the Autocorrelation Function'),header=TRUE)
a<-table.element(a,'T-STAT',header=TRUE)
a<-table.element(a,'P-value',header=TRUE)
a<-table.row.end(a)
for (i in 2:(par1+1)) {
a<-table.row.start(a)
a<-table.element(a,i-1,header=TRUE)
a<-table.element(a,round(myacf[i],6))
mytstat <- myacf[i]*sqrtn
a<-table.element(a,round(mytstat,4))
a<-table.element(a,round(1-pt(abs(mytstat),lengthx),6))
a<-table.row.end(a)
}
a<-table.end(a)
table.save(a,file='mytable.tab')
a<-table.start()
a<-table.row.start(a)
a<-table.element(a,'Partial Autocorrelation Function',4,TRUE)
a<-table.row.end(a)
a<-table.row.start(a)
a<-table.element(a,'Time lag k',header=TRUE)
a<-table.element(a,hyperlink('basics.htm','PACF(k)','click here for more information about the Partial Autocorrelation Function'),header=TRUE)
a<-table.element(a,'T-STAT',header=TRUE)
a<-table.element(a,'P-value',header=TRUE)
a<-table.row.end(a)
for (i in 1:par1) {
a<-table.row.start(a)
a<-table.element(a,i,header=TRUE)
a<-table.element(a,round(mypacf[i],6))
mytstat <- mypacf[i]*sqrtn
a<-table.element(a,round(mytstat,4))
a<-table.element(a,round(1-pt(abs(mytstat),lengthx),6))
a<-table.row.end(a)
}
a<-table.end(a)
table.save(a,file='mytable1.tab')