Free Statistics

of Irreproducible Research!

Author's title

Author*Unverified author*
R Software Modulerwasp_smp.wasp
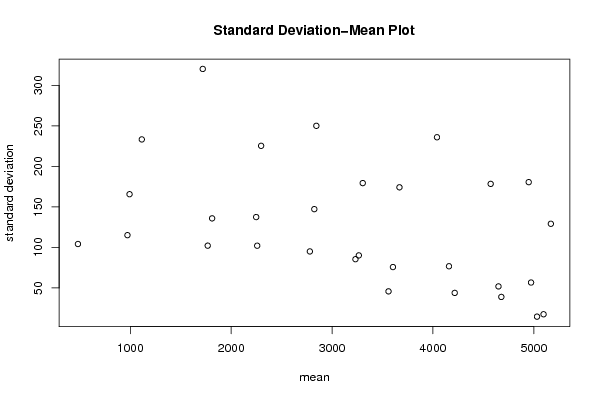
Title produced by softwareStandard Deviation-Mean Plot
Date of computationThu, 28 Jul 2011 06:27:55 -0400
Cite this page as followsStatistical Computations at FreeStatistics.org, Office for Research Development and Education, URL https://freestatistics.org/blog/index.php?v=date/2011/Jul/28/t1311848915dgs5gsot2qjthuu.htm/, Retrieved Thu, 16 May 2024 22:20:35 +0000
Statistical Computations at FreeStatistics.org, Office for Research Development and Education, URL https://freestatistics.org/blog/index.php?pk=123194, Retrieved Thu, 16 May 2024 22:20:35 +0000
QR Codes:

Original text written by user:
IsPrivate?No (this computation is public)
User-defined keywordsvicky koopmans
Estimated Impact204
Family? (F = Feedback message, R = changed R code, M = changed R Module, P = changed Parameters, D = changed Data)
-       [Standard Deviation-Mean Plot] [tijdreeks1-stap26] [2011-07-28 10:27:55] [30681199eb2b91d06bf445c1ee7d20a2] [Current]
Feedback Forum

Post a new message
Dataseries X:
5115
5105
5094
5074
5280
5270
5115
5012
5022
5022
5032
5053
5053
4960
4919
4960
5105
5084
4888
4722
4691
4629
4671
4722
4702
4660
4578
4660
4733
4712
4474
4371
4268
4185
4175
4237
4154
4123
4092
4268
4288
4185
3906
3782
3586
3503
3544
3606
3606
3555
3544
3710
3844
3782
3575
3472
3255
3121
3224
3327
3327
3193
3183
3358
3472
3431
3224
3090
2800
2687
2728
2904
2914
2656
2749
2976
3079
3017
2738
2542
2315
2139
2211
2366
2325
2098
2170
2397
2521
2449
2170
2046
1860
1664
1695
1850
1870
1684
1715
1974
2036
1932
1550
1354
1095
837
920
1033
1013
816
930
1209
1333
1271
1023
827
620
382
424
496


Summary of computational transaction
Raw Inputview raw input (R code)
Raw Outputview raw output of R engine
Computing time1 seconds
R Server'Herman Ole Andreas Wold' @ wold.wessa.net

\begin{tabular}{lllllllll}
\hline
Summary of computational transaction \tabularnewline
Raw Input & view raw input (R code)  \tabularnewline
Raw Output & view raw output of R engine  \tabularnewline
Computing time & 1 seconds \tabularnewline
R Server & 'Herman Ole Andreas Wold' @ wold.wessa.net \tabularnewline
\hline
\end{tabular}
%Source: https://freestatistics.org/blog/index.php?pk=123194&T=0

[TABLE]
[ROW][C]Summary of computational transaction[/C][/ROW]
[ROW][C]Raw Input[/C][C]view raw input (R code) [/C][/ROW]
[ROW][C]Raw Output[/C][C]view raw output of R engine [/C][/ROW]
[ROW][C]Computing time[/C][C]1 seconds[/C][/ROW]
[ROW][C]R Server[/C][C]'Herman Ole Andreas Wold' @ wold.wessa.net[/C][/ROW]
[/TABLE]
Source: https://freestatistics.org/blog/index.php?pk=123194&T=0

Globally Unique Identifier (entire table): ba.freestatistics.org/blog/index.php?pk=123194&T=0

As an alternative you can also use a QR Code:  

The GUIDs for individual cells are displayed in the table below:

Summary of computational transaction
Raw Inputview raw input (R code)
Raw Outputview raw output of R engine
Computing time1 seconds
R Server'Herman Ole Andreas Wold' @ wold.wessa.net


Standard Deviation-Mean Plot
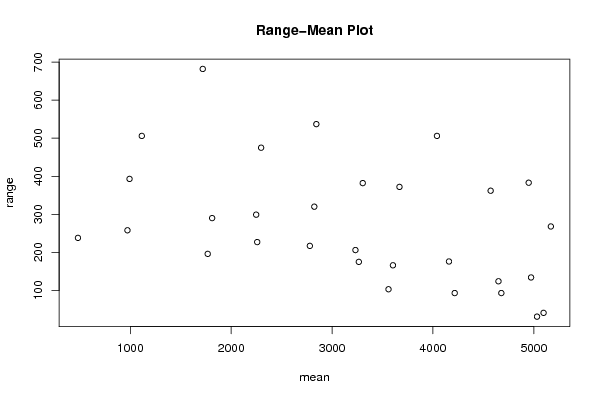
SectionMeanStandard DeviationRange
1509717.568911937472641
25169.25129.211390106807268
35032.2514.614490525958631
4497356.7274184147313134
54949.75180.562777633339383
64678.2538.96472763923893
7465051.9230199429887124
84572.5178.442334289447362
94216.2543.919433815415693
104159.2576.7913840653147176
114040.25235.972279445418506
123559.7545.8139352890217103
133603.7575.8084208163359166
143668.25174.199837351627372
153231.7585.5155931200075206
163265.2590.1863810856902175
173304.25179.395977286746382
182779.7595.0942514911741217
192823.75147.255729939449320
202844250.062658814413537
212257.75102.115539137456227
222247.5137.493030126379299
232296.5225.395208467261475
241767.25102.193851739394196
251810.75135.885674986978290
261718320.229084667003682
27971.25115.147369343232258
28992165.680415257809393
291113.5233.280232052925506
30480.5104.235310715707238

\begin{tabular}{lllllllll}
\hline
Standard Deviation-Mean Plot \tabularnewline
Section & Mean & Standard Deviation & Range \tabularnewline
1 & 5097 & 17.5689119374726 & 41 \tabularnewline
2 & 5169.25 & 129.211390106807 & 268 \tabularnewline
3 & 5032.25 & 14.6144905259586 & 31 \tabularnewline
4 & 4973 & 56.7274184147313 & 134 \tabularnewline
5 & 4949.75 & 180.562777633339 & 383 \tabularnewline
6 & 4678.25 & 38.964727639238 & 93 \tabularnewline
7 & 4650 & 51.9230199429887 & 124 \tabularnewline
8 & 4572.5 & 178.442334289447 & 362 \tabularnewline
9 & 4216.25 & 43.9194338154156 & 93 \tabularnewline
10 & 4159.25 & 76.7913840653147 & 176 \tabularnewline
11 & 4040.25 & 235.972279445418 & 506 \tabularnewline
12 & 3559.75 & 45.8139352890217 & 103 \tabularnewline
13 & 3603.75 & 75.8084208163359 & 166 \tabularnewline
14 & 3668.25 & 174.199837351627 & 372 \tabularnewline
15 & 3231.75 & 85.5155931200075 & 206 \tabularnewline
16 & 3265.25 & 90.1863810856902 & 175 \tabularnewline
17 & 3304.25 & 179.395977286746 & 382 \tabularnewline
18 & 2779.75 & 95.0942514911741 & 217 \tabularnewline
19 & 2823.75 & 147.255729939449 & 320 \tabularnewline
20 & 2844 & 250.062658814413 & 537 \tabularnewline
21 & 2257.75 & 102.115539137456 & 227 \tabularnewline
22 & 2247.5 & 137.493030126379 & 299 \tabularnewline
23 & 2296.5 & 225.395208467261 & 475 \tabularnewline
24 & 1767.25 & 102.193851739394 & 196 \tabularnewline
25 & 1810.75 & 135.885674986978 & 290 \tabularnewline
26 & 1718 & 320.229084667003 & 682 \tabularnewline
27 & 971.25 & 115.147369343232 & 258 \tabularnewline
28 & 992 & 165.680415257809 & 393 \tabularnewline
29 & 1113.5 & 233.280232052925 & 506 \tabularnewline
30 & 480.5 & 104.235310715707 & 238 \tabularnewline
\hline
\end{tabular}
%Source: https://freestatistics.org/blog/index.php?pk=123194&T=1

[TABLE]
[ROW][C]Standard Deviation-Mean Plot[/C][/ROW]
[ROW][C]Section[/C][C]Mean[/C][C]Standard Deviation[/C][C]Range[/C][/ROW]
[ROW][C]1[/C][C]5097[/C][C]17.5689119374726[/C][C]41[/C][/ROW]
[ROW][C]2[/C][C]5169.25[/C][C]129.211390106807[/C][C]268[/C][/ROW]
[ROW][C]3[/C][C]5032.25[/C][C]14.6144905259586[/C][C]31[/C][/ROW]
[ROW][C]4[/C][C]4973[/C][C]56.7274184147313[/C][C]134[/C][/ROW]
[ROW][C]5[/C][C]4949.75[/C][C]180.562777633339[/C][C]383[/C][/ROW]
[ROW][C]6[/C][C]4678.25[/C][C]38.964727639238[/C][C]93[/C][/ROW]
[ROW][C]7[/C][C]4650[/C][C]51.9230199429887[/C][C]124[/C][/ROW]
[ROW][C]8[/C][C]4572.5[/C][C]178.442334289447[/C][C]362[/C][/ROW]
[ROW][C]9[/C][C]4216.25[/C][C]43.9194338154156[/C][C]93[/C][/ROW]
[ROW][C]10[/C][C]4159.25[/C][C]76.7913840653147[/C][C]176[/C][/ROW]
[ROW][C]11[/C][C]4040.25[/C][C]235.972279445418[/C][C]506[/C][/ROW]
[ROW][C]12[/C][C]3559.75[/C][C]45.8139352890217[/C][C]103[/C][/ROW]
[ROW][C]13[/C][C]3603.75[/C][C]75.8084208163359[/C][C]166[/C][/ROW]
[ROW][C]14[/C][C]3668.25[/C][C]174.199837351627[/C][C]372[/C][/ROW]
[ROW][C]15[/C][C]3231.75[/C][C]85.5155931200075[/C][C]206[/C][/ROW]
[ROW][C]16[/C][C]3265.25[/C][C]90.1863810856902[/C][C]175[/C][/ROW]
[ROW][C]17[/C][C]3304.25[/C][C]179.395977286746[/C][C]382[/C][/ROW]
[ROW][C]18[/C][C]2779.75[/C][C]95.0942514911741[/C][C]217[/C][/ROW]
[ROW][C]19[/C][C]2823.75[/C][C]147.255729939449[/C][C]320[/C][/ROW]
[ROW][C]20[/C][C]2844[/C][C]250.062658814413[/C][C]537[/C][/ROW]
[ROW][C]21[/C][C]2257.75[/C][C]102.115539137456[/C][C]227[/C][/ROW]
[ROW][C]22[/C][C]2247.5[/C][C]137.493030126379[/C][C]299[/C][/ROW]
[ROW][C]23[/C][C]2296.5[/C][C]225.395208467261[/C][C]475[/C][/ROW]
[ROW][C]24[/C][C]1767.25[/C][C]102.193851739394[/C][C]196[/C][/ROW]
[ROW][C]25[/C][C]1810.75[/C][C]135.885674986978[/C][C]290[/C][/ROW]
[ROW][C]26[/C][C]1718[/C][C]320.229084667003[/C][C]682[/C][/ROW]
[ROW][C]27[/C][C]971.25[/C][C]115.147369343232[/C][C]258[/C][/ROW]
[ROW][C]28[/C][C]992[/C][C]165.680415257809[/C][C]393[/C][/ROW]
[ROW][C]29[/C][C]1113.5[/C][C]233.280232052925[/C][C]506[/C][/ROW]
[ROW][C]30[/C][C]480.5[/C][C]104.235310715707[/C][C]238[/C][/ROW]
[/TABLE]
Source: https://freestatistics.org/blog/index.php?pk=123194&T=1

Globally Unique Identifier (entire table): ba.freestatistics.org/blog/index.php?pk=123194&T=1

As an alternative you can also use a QR Code:  

The GUIDs for individual cells are displayed in the table below:

Standard Deviation-Mean Plot
SectionMeanStandard DeviationRange
1509717.568911937472641
25169.25129.211390106807268
35032.2514.614490525958631
4497356.7274184147313134
54949.75180.562777633339383
64678.2538.96472763923893
7465051.9230199429887124
84572.5178.442334289447362
94216.2543.919433815415693
104159.2576.7913840653147176
114040.25235.972279445418506
123559.7545.8139352890217103
133603.7575.8084208163359166
143668.25174.199837351627372
153231.7585.5155931200075206
163265.2590.1863810856902175
173304.25179.395977286746382
182779.7595.0942514911741217
192823.75147.255729939449320
202844250.062658814413537
212257.75102.115539137456227
222247.5137.493030126379299
232296.5225.395208467261475
241767.25102.193851739394196
251810.75135.885674986978290
261718320.229084667003682
27971.25115.147369343232258
28992165.680415257809393
291113.5233.280232052925506
30480.5104.235310715707238


Regression: S.E.(k) = alpha + beta * Mean(k)
alpha198.267049179984
beta-0.0222109963660185
S.D.0.00925532112547739
T-STAT-2.39980829026857
p-value0.0232994460349838

\begin{tabular}{lllllllll}
\hline
Regression: S.E.(k) = alpha + beta * Mean(k) \tabularnewline
alpha & 198.267049179984 \tabularnewline
beta & -0.0222109963660185 \tabularnewline
S.D. & 0.00925532112547739 \tabularnewline
T-STAT & -2.39980829026857 \tabularnewline
p-value & 0.0232994460349838 \tabularnewline
\hline
\end{tabular}
%Source: https://freestatistics.org/blog/index.php?pk=123194&T=2

[TABLE]
[ROW][C]Regression: S.E.(k) = alpha + beta * Mean(k)[/C][/ROW]
[ROW][C]alpha[/C][C]198.267049179984[/C][/ROW]
[ROW][C]beta[/C][C]-0.0222109963660185[/C][/ROW]
[ROW][C]S.D.[/C][C]0.00925532112547739[/C][/ROW]
[ROW][C]T-STAT[/C][C]-2.39980829026857[/C][/ROW]
[ROW][C]p-value[/C][C]0.0232994460349838[/C][/ROW]
[/TABLE]
Source: https://freestatistics.org/blog/index.php?pk=123194&T=2

Globally Unique Identifier (entire table): ba.freestatistics.org/blog/index.php?pk=123194&T=2

As an alternative you can also use a QR Code:  

The GUIDs for individual cells are displayed in the table below:

Regression: S.E.(k) = alpha + beta * Mean(k)
alpha198.267049179984
beta-0.0222109963660185
S.D.0.00925532112547739
T-STAT-2.39980829026857
p-value0.0232994460349838


Regression: ln S.E.(k) = alpha + beta * ln Mean(k)
alpha8.66892480913111
beta-0.509206265097767
S.D.0.218136435139374
T-STAT-2.33434760576527
p-value0.026977529104012
Lambda1.50920626509777

\begin{tabular}{lllllllll}
\hline
Regression: ln S.E.(k) = alpha + beta * ln Mean(k) \tabularnewline
alpha & 8.66892480913111 \tabularnewline
beta & -0.509206265097767 \tabularnewline
S.D. & 0.218136435139374 \tabularnewline
T-STAT & -2.33434760576527 \tabularnewline
p-value & 0.026977529104012 \tabularnewline
Lambda & 1.50920626509777 \tabularnewline
\hline
\end{tabular}
%Source: https://freestatistics.org/blog/index.php?pk=123194&T=3

[TABLE]
[ROW][C]Regression: ln S.E.(k) = alpha + beta * ln Mean(k)[/C][/ROW]
[ROW][C]alpha[/C][C]8.66892480913111[/C][/ROW]
[ROW][C]beta[/C][C]-0.509206265097767[/C][/ROW]
[ROW][C]S.D.[/C][C]0.218136435139374[/C][/ROW]
[ROW][C]T-STAT[/C][C]-2.33434760576527[/C][/ROW]
[ROW][C]p-value[/C][C]0.026977529104012[/C][/ROW]
[ROW][C]Lambda[/C][C]1.50920626509777[/C][/ROW]
[/TABLE]
Source: https://freestatistics.org/blog/index.php?pk=123194&T=3

Globally Unique Identifier (entire table): ba.freestatistics.org/blog/index.php?pk=123194&T=3

As an alternative you can also use a QR Code:  

The GUIDs for individual cells are displayed in the table below:

Regression: ln S.E.(k) = alpha + beta * ln Mean(k)
alpha8.66892480913111
beta-0.509206265097767
S.D.0.218136435139374
T-STAT-2.33434760576527
p-value0.026977529104012
Lambda1.50920626509777


Parameters (Session):
par1 = 4 ;
Parameters (R input):
par1 = 4 ;
R code (references can be found in the software module):
par1 <- as.numeric(par1)
(n <- length(x))
(np <- floor(n / par1))
arr <- array(NA,dim=c(par1,np))
j <- 0
k <- 1
for (i in 1:(np*par1))
{
j = j + 1
arr[j,k] <- x[i]
if (j == par1) {
j = 0
k=k+1
}
}
arr
arr.mean <- array(NA,dim=np)
arr.sd <- array(NA,dim=np)
arr.range <- array(NA,dim=np)
for (j in 1:np)
{
arr.mean[j] <- mean(arr[,j],na.rm=TRUE)
arr.sd[j] <- sd(arr[,j],na.rm=TRUE)
arr.range[j] <- max(arr[,j],na.rm=TRUE) - min(arr[,j],na.rm=TRUE)
}
arr.mean
arr.sd
arr.range
(lm1 <- lm(arr.sd~arr.mean))
(lnlm1 <- lm(log(arr.sd)~log(arr.mean)))
(lm2 <- lm(arr.range~arr.mean))
bitmap(file='test1.png')
plot(arr.mean,arr.sd,main='Standard Deviation-Mean Plot',xlab='mean',ylab='standard deviation')
dev.off()
bitmap(file='test2.png')
plot(arr.mean,arr.range,main='Range-Mean Plot',xlab='mean',ylab='range')
dev.off()
load(file='createtable')
a<-table.start()
a<-table.row.start(a)
a<-table.element(a,'Standard Deviation-Mean Plot',4,TRUE)
a<-table.row.end(a)
a<-table.row.start(a)
a<-table.element(a,'Section',header=TRUE)
a<-table.element(a,'Mean',header=TRUE)
a<-table.element(a,'Standard Deviation',header=TRUE)
a<-table.element(a,'Range',header=TRUE)
a<-table.row.end(a)
for (j in 1:np) {
a<-table.row.start(a)
a<-table.element(a,j,header=TRUE)
a<-table.element(a,arr.mean[j])
a<-table.element(a,arr.sd[j] )
a<-table.element(a,arr.range[j] )
a<-table.row.end(a)
}
a<-table.end(a)
table.save(a,file='mytable.tab')
a<-table.start()
a<-table.row.start(a)
a<-table.element(a,'Regression: S.E.(k) = alpha + beta * Mean(k)',2,TRUE)
a<-table.row.end(a)
a<-table.row.start(a)
a<-table.element(a,'alpha',header=TRUE)
a<-table.element(a,lm1$coefficients[[1]])
a<-table.row.end(a)
a<-table.row.start(a)
a<-table.element(a,'beta',header=TRUE)
a<-table.element(a,lm1$coefficients[[2]])
a<-table.row.end(a)
a<-table.row.start(a)
a<-table.element(a,'S.D.',header=TRUE)
a<-table.element(a,summary(lm1)$coefficients[2,2])
a<-table.row.end(a)
a<-table.row.start(a)
a<-table.element(a,'T-STAT',header=TRUE)
a<-table.element(a,summary(lm1)$coefficients[2,3])
a<-table.row.end(a)
a<-table.row.start(a)
a<-table.element(a,'p-value',header=TRUE)
a<-table.element(a,summary(lm1)$coefficients[2,4])
a<-table.row.end(a)
a<-table.end(a)
table.save(a,file='mytable1.tab')
a<-table.start()
a<-table.row.start(a)
a<-table.element(a,'Regression: ln S.E.(k) = alpha + beta * ln Mean(k)',2,TRUE)
a<-table.row.end(a)
a<-table.row.start(a)
a<-table.element(a,'alpha',header=TRUE)
a<-table.element(a,lnlm1$coefficients[[1]])
a<-table.row.end(a)
a<-table.row.start(a)
a<-table.element(a,'beta',header=TRUE)
a<-table.element(a,lnlm1$coefficients[[2]])
a<-table.row.end(a)
a<-table.row.start(a)
a<-table.element(a,'S.D.',header=TRUE)
a<-table.element(a,summary(lnlm1)$coefficients[2,2])
a<-table.row.end(a)
a<-table.row.start(a)
a<-table.element(a,'T-STAT',header=TRUE)
a<-table.element(a,summary(lnlm1)$coefficients[2,3])
a<-table.row.end(a)
a<-table.row.start(a)
a<-table.element(a,'p-value',header=TRUE)
a<-table.element(a,summary(lnlm1)$coefficients[2,4])
a<-table.row.end(a)
a<-table.row.start(a)
a<-table.element(a,'Lambda',header=TRUE)
a<-table.element(a,1-lnlm1$coefficients[[2]])
a<-table.row.end(a)
a<-table.end(a)
table.save(a,file='mytable2.tab')