Free Statistics
of Irreproducible Research!
Description of Statistical Computation | ||||||||||||||||||||||||||||||
|---|---|---|---|---|---|---|---|---|---|---|---|---|---|---|---|---|---|---|---|---|---|---|---|---|---|---|---|---|---|---|
| Author's title | ||||||||||||||||||||||||||||||
| Author | *The author of this computation has been verified* | |||||||||||||||||||||||||||||
| R Software Module | rwasp_Distributional Plots.wasp | |||||||||||||||||||||||||||||
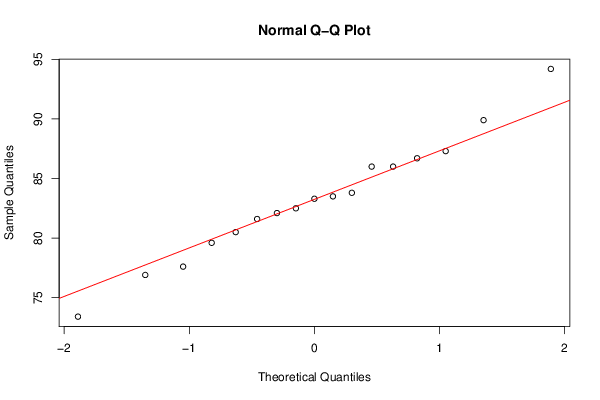
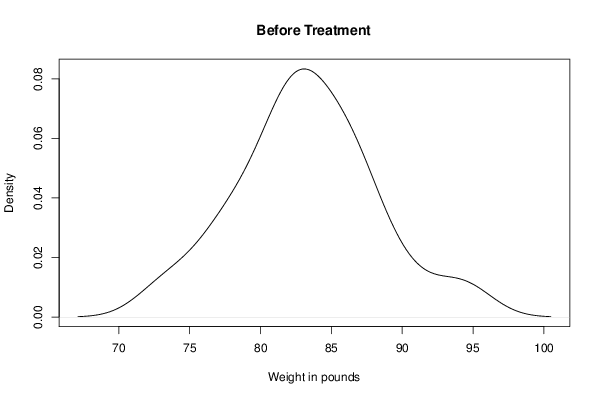
| Title produced by software | Histogram, QQplot and Density | |||||||||||||||||||||||||||||
| Date of computation | Tue, 30 Apr 2013 12:53:36 -0400 | |||||||||||||||||||||||||||||
| Cite this page as follows | Statistical Computations at FreeStatistics.org, Office for Research Development and Education, URL https://freestatistics.org/blog/index.php?v=date/2013/Apr/30/t1367340840zukqjwr06vd30us.htm/, Retrieved Sun, 05 May 2024 20:11:53 +0000 | |||||||||||||||||||||||||||||
| Statistical Computations at FreeStatistics.org, Office for Research Development and Education, URL https://freestatistics.org/blog/index.php?pk=208617, Retrieved Sun, 05 May 2024 20:11:53 +0000 | ||||||||||||||||||||||||||||||
| QR Codes: | ||||||||||||||||||||||||||||||
|
| ||||||||||||||||||||||||||||||
| Original text written by user: | ||||||||||||||||||||||||||||||
| IsPrivate? | No (this computation is public) | |||||||||||||||||||||||||||||
| User-defined keywords | ||||||||||||||||||||||||||||||
| Estimated Impact | 126 | |||||||||||||||||||||||||||||
Tree of Dependent Computations | ||||||||||||||||||||||||||||||
| Family? (F = Feedback message, R = changed R code, M = changed R Module, P = changed Parameters, D = changed Data) | ||||||||||||||||||||||||||||||
| - [Histogram, QQplot and Density] [] [2013-04-30 16:53:36] [0b0dba78d6906383d09f0ee03b825a5b] [Current] - D [Histogram, QQplot and Density] [] [2013-04-30 16:57:37] [180e044edce56e655340260fe3c965df] - RMPD [Wilcoxon-Mann-Whitney Test] [] [2013-04-30 17:20:31] [180e044edce56e655340260fe3c965df] - D [Histogram, QQplot and Density] [] [2013-04-30 18:05:41] [180e044edce56e655340260fe3c965df] - D [Histogram, QQplot and Density] [] [2013-04-30 18:08:45] [180e044edce56e655340260fe3c965df] - RMPD [CARE Data - Boxplots and Scatterplot Matrix] [] [2013-04-30 18:13:33] [180e044edce56e655340260fe3c965df] - RMPD [Kolmogorov-Smirnov Test] [] [2013-04-30 18:34:32] [180e044edce56e655340260fe3c965df] - RMPD [Wilcoxon-Mann-Whitney Test] [] [2013-04-30 18:42:39] [180e044edce56e655340260fe3c965df] - RMPD [Wilcoxon-Mann-Whitney Test] [] [2013-04-30 20:18:09] [180e044edce56e655340260fe3c965df] - RMPD [CARE Data - Boxplots and Scatterplot Matrix] [] [2013-04-30 21:07:01] [180e044edce56e655340260fe3c965df] - RMPD [T-Tests] [] [2013-04-30 21:11:20] [180e044edce56e655340260fe3c965df] | ||||||||||||||||||||||||||||||
| Feedback Forum | ||||||||||||||||||||||||||||||
Post a new message | ||||||||||||||||||||||||||||||
Dataset | ||||||||||||||||||||||||||||||
| Dataseries X: | ||||||||||||||||||||||||||||||
83.8 83.3 86 82.5 86.7 79.6 76.9 94.2 73.4 80.5 81.6 82.1 77.6 83.5 89.9 86 87.3 | ||||||||||||||||||||||||||||||
Tables (Output of Computation) | ||||||||||||||||||||||||||||||
| ||||||||||||||||||||||||||||||
Figures (Output of Computation) | ||||||||||||||||||||||||||||||
Input Parameters & R Code | ||||||||||||||||||||||||||||||
| Parameters (Session): | ||||||||||||||||||||||||||||||
| par1 = 10 ; | ||||||||||||||||||||||||||||||
| Parameters (R input): | ||||||||||||||||||||||||||||||
| par1 = 10 ; | ||||||||||||||||||||||||||||||
| R code (references can be found in the software module): | ||||||||||||||||||||||||||||||
x <- x[!is.na(x)] | ||||||||||||||||||||||||||||||