Free Statistics

of Irreproducible Research!

Author's title

Author*Unverified author*
R Software Modulerwasp_notchedbox1.wasp
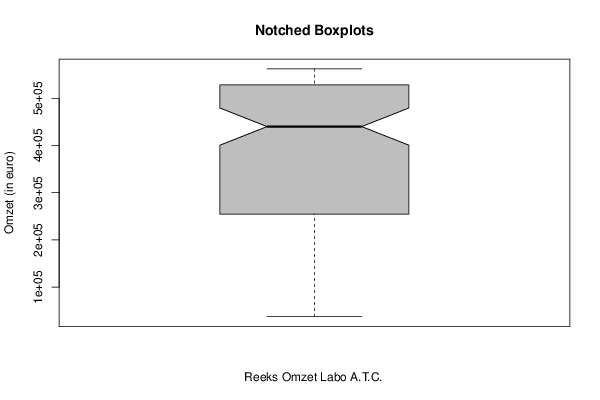
Title produced by softwareNotched Boxplots
Date of computationSat, 03 Aug 2013 11:16:20 -0400
Cite this page as followsStatistical Computations at FreeStatistics.org, Office for Research Development and Education, URL https://freestatistics.org/blog/index.php?v=date/2013/Aug/03/t1375543211glub517i1dlekud.htm/, Retrieved Mon, 29 Apr 2024 12:16:45 +0000
Statistical Computations at FreeStatistics.org, Office for Research Development and Education, URL https://freestatistics.org/blog/index.php?pk=210913, Retrieved Mon, 29 Apr 2024 12:16:45 +0000
QR Codes:

Original text written by user:
IsPrivate?No (this computation is public)
User-defined keywordsOngenae Olivier
Estimated Impact189
Family? (F = Feedback message, R = changed R code, M = changed R Module, P = changed Parameters, D = changed Data)
-       [Notched Boxplots] [TIJDREEKS A - STAP 9] [2013-08-03 15:16:20] [a14baeeafb42bd31c8e1f231a0a4996d] [Current]
- RMPD    [] [nkxsvfng] [1970-01-01 00:00:00] [74be16979710d4c4e7c6647856088456]
Feedback Forum

Post a new message
Dataseries X:
545688
544740
543702
541794
561369
560421
545688
535914
536862
536862
537807
539808
544740
538848
544740
539808
555474
562407
532968
525075
531915
530967
525075
526035
537807
535914
537807
537807
550635
552528
517194
517194
530967
524127
512355
517194
528981
523089
522141
509409
528021
531915
493635
492687
512355
501528
482901
490794
499527
501528
495636
483861
508368
508368
465234
462303
474075
452514
430848
437796
452514
440730
432849
416130
438741
439689
396570
395517
403410
378903
352395
363129
377850
362184
361236
345462
371010
375957
327798
317064
323904
297396
269943
278784
295410
275838
278784
267012
291516
294450
235572
231663
242397
213999
188451
197292
218850
193386
191397
171732
193386
200226
139344
139344
148173
124626
98118
111891
136398
109893
120732
105999
129558
137439
74559
69720
79506
55947
37332
45120


Summary of computational transaction
Raw Inputview raw input (R code)
Raw Outputview raw output of R engine
Computing time1 seconds
R Server'Sir Maurice George Kendall' @ kendall.wessa.net

\begin{tabular}{lllllllll}
\hline
Summary of computational transaction \tabularnewline
Raw Input & view raw input (R code)  \tabularnewline
Raw Output & view raw output of R engine  \tabularnewline
Computing time & 1 seconds \tabularnewline
R Server & 'Sir Maurice George Kendall' @ kendall.wessa.net \tabularnewline
\hline
\end{tabular}
%Source: https://freestatistics.org/blog/index.php?pk=210913&T=0

[TABLE]
[ROW][C]Summary of computational transaction[/C][/ROW]
[ROW][C]Raw Input[/C][C]view raw input (R code) [/C][/ROW]
[ROW][C]Raw Output[/C][C]view raw output of R engine [/C][/ROW]
[ROW][C]Computing time[/C][C]1 seconds[/C][/ROW]
[ROW][C]R Server[/C][C]'Sir Maurice George Kendall' @ kendall.wessa.net[/C][/ROW]
[/TABLE]
Source: https://freestatistics.org/blog/index.php?pk=210913&T=0

Globally Unique Identifier (entire table): ba.freestatistics.org/blog/index.php?pk=210913&T=0

As an alternative you can also use a QR Code:  

The GUIDs for individual cells are displayed in the table below:

Summary of computational transaction
Raw Inputview raw input (R code)
Raw Outputview raw output of R engine
Computing time1 seconds
R Server'Sir Maurice George Kendall' @ kendall.wessa.net


\begin{tabular}{lllllllll}
\hline
Boxplot statistics \tabularnewline
Variable & lower whisker & lower hinge & median & upper hinge & upper whisker \tabularnewline
A & 37332 & 254704.5 & 440209.5 & 528501 & 562407 \tabularnewline
\hline
\end{tabular}
%Source: https://freestatistics.org/blog/index.php?pk=210913&T=1

[TABLE]
[ROW][C]Boxplot statistics[/C][/ROW]
[ROW][C]Variable[/C][C]lower whisker[/C][C]lower hinge[/C][C]median[/C][C]upper hinge[/C][C]upper whisker[/C][/ROW]
[ROW][C]A[/C][C]37332[/C][C]254704.5[/C][C]440209.5[/C][C]528501[/C][C]562407[/C][/ROW]
[/TABLE]
Source: https://freestatistics.org/blog/index.php?pk=210913&T=1

Globally Unique Identifier (entire table): ba.freestatistics.org/blog/index.php?pk=210913&T=1

As an alternative you can also use a QR Code:  

The GUIDs for individual cells are displayed in the table below:

Boxplot statistics
Variablelower whiskerlower hingemedianupper hingeupper whisker
A37332254704.5440209.5528501562407


Boxplot Notches
Variablelower boundmedianupper bound
A400718.84327313440209.5479700.15672687

\begin{tabular}{lllllllll}
\hline
Boxplot Notches \tabularnewline
Variable & lower bound & median & upper bound \tabularnewline
A & 400718.84327313 & 440209.5 & 479700.15672687 \tabularnewline
\hline
\end{tabular}
%Source: https://freestatistics.org/blog/index.php?pk=210913&T=2

[TABLE]
[ROW][C]Boxplot Notches[/C][/ROW]
[ROW][C]Variable[/C][C]lower bound[/C][C]median[/C][C]upper bound[/C][/ROW]
[ROW][C]A[/C][C]400718.84327313[/C][C]440209.5[/C][C]479700.15672687[/C][/ROW]
[/TABLE]
Source: https://freestatistics.org/blog/index.php?pk=210913&T=2

Globally Unique Identifier (entire table): ba.freestatistics.org/blog/index.php?pk=210913&T=2

As an alternative you can also use a QR Code:  

The GUIDs for individual cells are displayed in the table below:

Boxplot Notches
Variablelower boundmedianupper bound
A400718.84327313440209.5479700.15672687


Parameters (Session):
par1 = 48 ; par2 = grey ; par3 = FALSE ; par4 = Unknown ;
Parameters (R input):
par1 = grey ;
R code (references can be found in the software module):
z <- as.data.frame(t(y))
bitmap(file='test1.png')
(r<-boxplot(z ,xlab=xlab,ylab=ylab,main=main,notch=TRUE,col=par1))
dev.off()
load(file='createtable')
a<-table.start()
a<-table.row.start(a)
a<-table.element(a,hyperlink('overview.htm','Boxplot statistics','Boxplot overview'),6,TRUE)
a<-table.row.end(a)
a<-table.row.start(a)
a<-table.element(a,'Variable',1,TRUE)
a<-table.element(a,hyperlink('lower_whisker.htm','lower whisker','definition of lower whisker'),1,TRUE)
a<-table.element(a,hyperlink('lower_hinge.htm','lower hinge','definition of lower hinge'),1,TRUE)
a<-table.element(a,hyperlink('central_tendency.htm','median','definitions about measures of central tendency'),1,TRUE)
a<-table.element(a,hyperlink('upper_hinge.htm','upper hinge','definition of upper hinge'),1,TRUE)
a<-table.element(a,hyperlink('upper_whisker.htm','upper whisker','definition of upper whisker'),1,TRUE)
a<-table.row.end(a)
for (i in 1:length(y[,1]))
{
a<-table.row.start(a)
a<-table.element(a,dimnames(t(x))[[2]][i],1,TRUE)
for (j in 1:5)
{
a<-table.element(a,r$stats[j,i])
}
a<-table.row.end(a)
}
a<-table.end(a)
table.save(a,file='mytable.tab')
a<-table.start()
a<-table.row.start(a)
a<-table.element(a,'Boxplot Notches',4,TRUE)
a<-table.row.end(a)
a<-table.row.start(a)
a<-table.element(a,'Variable',1,TRUE)
a<-table.element(a,'lower bound',1,TRUE)
a<-table.element(a,'median',1,TRUE)
a<-table.element(a,'upper bound',1,TRUE)
a<-table.row.end(a)
for (i in 1:length(y[,1]))
{
a<-table.row.start(a)
a<-table.element(a,dimnames(t(x))[[2]][i],1,TRUE)
a<-table.element(a,r$conf[1,i])
a<-table.element(a,r$stats[3,i])
a<-table.element(a,r$conf[2,i])
a<-table.row.end(a)
}
a<-table.end(a)
table.save(a,file='mytable1.tab')