Free Statistics

of Irreproducible Research!

Author's title

Author*Unverified author*
R Software Modulerwasp_autocorrelation.wasp
Title produced by software(Partial) Autocorrelation Function
Date of computationSun, 04 Aug 2013 13:04:08 -0400
Cite this page as followsStatistical Computations at FreeStatistics.org, Office for Research Development and Education, URL https://freestatistics.org/blog/index.php?v=date/2013/Aug/04/t1375635904dkgpvhj01joy04u.htm/, Retrieved Sat, 04 May 2024 18:12:26 +0000
Statistical Computations at FreeStatistics.org, Office for Research Development and Education, URL https://freestatistics.org/blog/index.php?pk=210933, Retrieved Sat, 04 May 2024 18:12:26 +0000
QR Codes:

Original text written by user:
IsPrivate?No (this computation is public)
User-defined keywordsOngenae Olivier
Estimated Impact163
Family? (F = Feedback message, R = changed R code, M = changed R Module, P = changed Parameters, D = changed Data)
-       [(Partial) Autocorrelation Function] [TIJDREEKS B - STA...] [2013-08-04 17:04:08] [a14baeeafb42bd31c8e1f231a0a4996d] [Current]
Feedback Forum

Post a new message
Dataseries X:
990
1050
1000
1040
1030
980
990
940
1050
990
980
1110
1000
1000
1080
1010
960
990
900
920
1080
950
950
1060
1070
970
1070
980
970
1050
950
960
1170
990
870
1090
1070
990
1080
890
920
1100
930
950
1240
950
830
1220
1040
1080
1160
900
790
1100
1000
990
1250
970
840
1220
1100
1030
1210
830
810
1100
1020
950
1280
950
720
1150
1030
1030
1200
870
880
1090
950
1060
1280
920
630
1110
1020
1130
1160
930
930
1110
930
1070
1250
840
680
1110
990
1210
1130
920
1030
1120
880
1050
1260
790
640
1110


Summary of computational transaction
Raw Inputview raw input (R code)
Raw Outputview raw output of R engine
Computing time2 seconds
R Server'Sir Ronald Aylmer Fisher' @ fisher.wessa.net

\begin{tabular}{lllllllll}
\hline
Summary of computational transaction \tabularnewline
Raw Input & view raw input (R code)  \tabularnewline
Raw Output & view raw output of R engine  \tabularnewline
Computing time & 2 seconds \tabularnewline
R Server & 'Sir Ronald Aylmer Fisher' @ fisher.wessa.net \tabularnewline
\hline
\end{tabular}
%Source: https://freestatistics.org/blog/index.php?pk=210933&T=0

[TABLE]
[ROW][C]Summary of computational transaction[/C][/ROW]
[ROW][C]Raw Input[/C][C]view raw input (R code) [/C][/ROW]
[ROW][C]Raw Output[/C][C]view raw output of R engine [/C][/ROW]
[ROW][C]Computing time[/C][C]2 seconds[/C][/ROW]
[ROW][C]R Server[/C][C]'Sir Ronald Aylmer Fisher' @ fisher.wessa.net[/C][/ROW]
[/TABLE]
Source: https://freestatistics.org/blog/index.php?pk=210933&T=0

Globally Unique Identifier (entire table): ba.freestatistics.org/blog/index.php?pk=210933&T=0

As an alternative you can also use a QR Code:  

The GUIDs for individual cells are displayed in the table below:

Summary of computational transaction
Raw Inputview raw input (R code)
Raw Outputview raw output of R engine
Computing time2 seconds
R Server'Sir Ronald Aylmer Fisher' @ fisher.wessa.net


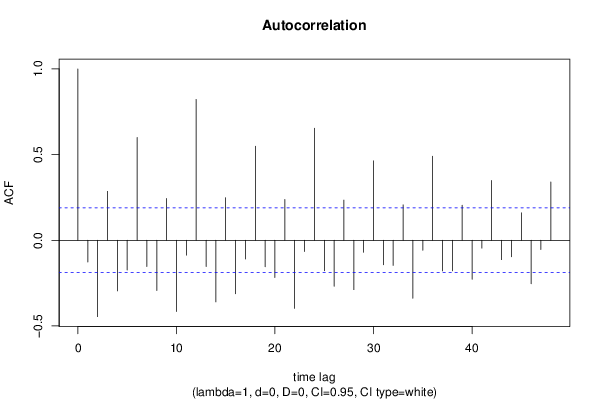
Autocorrelation Function
Time lag kACF(k)T-STATP-value
1-0.126801-1.31780.095188
2-0.445935-4.63435e-06
30.2853982.96590.001858
4-0.295691-3.07290.001342
5-0.173351-1.80150.037206
60.6000246.23560
7-0.152888-1.58890.057508
8-0.293019-3.04510.001461
90.2437642.53330.006368
10-0.416238-4.32571.7e-05
11-0.087026-0.90440.183897
120.8222218.54480
13-0.153252-1.59260.057081
14-0.359868-3.73990.000148
150.2477952.57520.005686
16-0.312426-3.24680.000777
17-0.109148-1.13430.129591
180.5487535.70280
19-0.154475-1.60530.055669
20-0.217742-2.26280.012823
210.2384292.47780.007384
22-0.397759-4.13363.5e-05
23-0.066122-0.68720.246729
240.6536026.79240
25-0.177584-1.84550.033852
26-0.268625-2.79160.003102
270.2343462.43540.008256
28-0.288293-2.9960.001696
29-0.069706-0.72440.235191
300.4636674.81862e-06
31-0.143047-1.48660.070019
32-0.146686-1.52440.065165
330.2068142.14930.016923
34-0.338302-3.51570.000321
35-0.057889-0.60160.27435
360.490755.11e-06
37-0.178867-1.85880.032886
38-0.1786-1.85610.033085
390.2044072.12430.017965
40-0.227644-2.36570.009889
41-0.045899-0.4770.317163
420.3487653.62450.000222
43-0.11321-1.17650.120989
44-0.096224-10.159776
450.1599131.66190.04972
46-0.254016-2.63980.004762
47-0.054482-0.56620.28622
480.3400193.53360.000302

\begin{tabular}{lllllllll}
\hline
Autocorrelation Function \tabularnewline
Time lag k & ACF(k) & T-STAT & P-value \tabularnewline
1 & -0.126801 & -1.3178 & 0.095188 \tabularnewline
2 & -0.445935 & -4.6343 & 5e-06 \tabularnewline
3 & 0.285398 & 2.9659 & 0.001858 \tabularnewline
4 & -0.295691 & -3.0729 & 0.001342 \tabularnewline
5 & -0.173351 & -1.8015 & 0.037206 \tabularnewline
6 & 0.600024 & 6.2356 & 0 \tabularnewline
7 & -0.152888 & -1.5889 & 0.057508 \tabularnewline
8 & -0.293019 & -3.0451 & 0.001461 \tabularnewline
9 & 0.243764 & 2.5333 & 0.006368 \tabularnewline
10 & -0.416238 & -4.3257 & 1.7e-05 \tabularnewline
11 & -0.087026 & -0.9044 & 0.183897 \tabularnewline
12 & 0.822221 & 8.5448 & 0 \tabularnewline
13 & -0.153252 & -1.5926 & 0.057081 \tabularnewline
14 & -0.359868 & -3.7399 & 0.000148 \tabularnewline
15 & 0.247795 & 2.5752 & 0.005686 \tabularnewline
16 & -0.312426 & -3.2468 & 0.000777 \tabularnewline
17 & -0.109148 & -1.1343 & 0.129591 \tabularnewline
18 & 0.548753 & 5.7028 & 0 \tabularnewline
19 & -0.154475 & -1.6053 & 0.055669 \tabularnewline
20 & -0.217742 & -2.2628 & 0.012823 \tabularnewline
21 & 0.238429 & 2.4778 & 0.007384 \tabularnewline
22 & -0.397759 & -4.1336 & 3.5e-05 \tabularnewline
23 & -0.066122 & -0.6872 & 0.246729 \tabularnewline
24 & 0.653602 & 6.7924 & 0 \tabularnewline
25 & -0.177584 & -1.8455 & 0.033852 \tabularnewline
26 & -0.268625 & -2.7916 & 0.003102 \tabularnewline
27 & 0.234346 & 2.4354 & 0.008256 \tabularnewline
28 & -0.288293 & -2.996 & 0.001696 \tabularnewline
29 & -0.069706 & -0.7244 & 0.235191 \tabularnewline
30 & 0.463667 & 4.8186 & 2e-06 \tabularnewline
31 & -0.143047 & -1.4866 & 0.070019 \tabularnewline
32 & -0.146686 & -1.5244 & 0.065165 \tabularnewline
33 & 0.206814 & 2.1493 & 0.016923 \tabularnewline
34 & -0.338302 & -3.5157 & 0.000321 \tabularnewline
35 & -0.057889 & -0.6016 & 0.27435 \tabularnewline
36 & 0.49075 & 5.1 & 1e-06 \tabularnewline
37 & -0.178867 & -1.8588 & 0.032886 \tabularnewline
38 & -0.1786 & -1.8561 & 0.033085 \tabularnewline
39 & 0.204407 & 2.1243 & 0.017965 \tabularnewline
40 & -0.227644 & -2.3657 & 0.009889 \tabularnewline
41 & -0.045899 & -0.477 & 0.317163 \tabularnewline
42 & 0.348765 & 3.6245 & 0.000222 \tabularnewline
43 & -0.11321 & -1.1765 & 0.120989 \tabularnewline
44 & -0.096224 & -1 & 0.159776 \tabularnewline
45 & 0.159913 & 1.6619 & 0.04972 \tabularnewline
46 & -0.254016 & -2.6398 & 0.004762 \tabularnewline
47 & -0.054482 & -0.5662 & 0.28622 \tabularnewline
48 & 0.340019 & 3.5336 & 0.000302 \tabularnewline
\hline
\end{tabular}
%Source: https://freestatistics.org/blog/index.php?pk=210933&T=1

[TABLE]
[ROW][C]Autocorrelation Function[/C][/ROW]
[ROW][C]Time lag k[/C][C]ACF(k)[/C][C]T-STAT[/C][C]P-value[/C][/ROW]
[ROW][C]1[/C][C]-0.126801[/C][C]-1.3178[/C][C]0.095188[/C][/ROW]
[ROW][C]2[/C][C]-0.445935[/C][C]-4.6343[/C][C]5e-06[/C][/ROW]
[ROW][C]3[/C][C]0.285398[/C][C]2.9659[/C][C]0.001858[/C][/ROW]
[ROW][C]4[/C][C]-0.295691[/C][C]-3.0729[/C][C]0.001342[/C][/ROW]
[ROW][C]5[/C][C]-0.173351[/C][C]-1.8015[/C][C]0.037206[/C][/ROW]
[ROW][C]6[/C][C]0.600024[/C][C]6.2356[/C][C]0[/C][/ROW]
[ROW][C]7[/C][C]-0.152888[/C][C]-1.5889[/C][C]0.057508[/C][/ROW]
[ROW][C]8[/C][C]-0.293019[/C][C]-3.0451[/C][C]0.001461[/C][/ROW]
[ROW][C]9[/C][C]0.243764[/C][C]2.5333[/C][C]0.006368[/C][/ROW]
[ROW][C]10[/C][C]-0.416238[/C][C]-4.3257[/C][C]1.7e-05[/C][/ROW]
[ROW][C]11[/C][C]-0.087026[/C][C]-0.9044[/C][C]0.183897[/C][/ROW]
[ROW][C]12[/C][C]0.822221[/C][C]8.5448[/C][C]0[/C][/ROW]
[ROW][C]13[/C][C]-0.153252[/C][C]-1.5926[/C][C]0.057081[/C][/ROW]
[ROW][C]14[/C][C]-0.359868[/C][C]-3.7399[/C][C]0.000148[/C][/ROW]
[ROW][C]15[/C][C]0.247795[/C][C]2.5752[/C][C]0.005686[/C][/ROW]
[ROW][C]16[/C][C]-0.312426[/C][C]-3.2468[/C][C]0.000777[/C][/ROW]
[ROW][C]17[/C][C]-0.109148[/C][C]-1.1343[/C][C]0.129591[/C][/ROW]
[ROW][C]18[/C][C]0.548753[/C][C]5.7028[/C][C]0[/C][/ROW]
[ROW][C]19[/C][C]-0.154475[/C][C]-1.6053[/C][C]0.055669[/C][/ROW]
[ROW][C]20[/C][C]-0.217742[/C][C]-2.2628[/C][C]0.012823[/C][/ROW]
[ROW][C]21[/C][C]0.238429[/C][C]2.4778[/C][C]0.007384[/C][/ROW]
[ROW][C]22[/C][C]-0.397759[/C][C]-4.1336[/C][C]3.5e-05[/C][/ROW]
[ROW][C]23[/C][C]-0.066122[/C][C]-0.6872[/C][C]0.246729[/C][/ROW]
[ROW][C]24[/C][C]0.653602[/C][C]6.7924[/C][C]0[/C][/ROW]
[ROW][C]25[/C][C]-0.177584[/C][C]-1.8455[/C][C]0.033852[/C][/ROW]
[ROW][C]26[/C][C]-0.268625[/C][C]-2.7916[/C][C]0.003102[/C][/ROW]
[ROW][C]27[/C][C]0.234346[/C][C]2.4354[/C][C]0.008256[/C][/ROW]
[ROW][C]28[/C][C]-0.288293[/C][C]-2.996[/C][C]0.001696[/C][/ROW]
[ROW][C]29[/C][C]-0.069706[/C][C]-0.7244[/C][C]0.235191[/C][/ROW]
[ROW][C]30[/C][C]0.463667[/C][C]4.8186[/C][C]2e-06[/C][/ROW]
[ROW][C]31[/C][C]-0.143047[/C][C]-1.4866[/C][C]0.070019[/C][/ROW]
[ROW][C]32[/C][C]-0.146686[/C][C]-1.5244[/C][C]0.065165[/C][/ROW]
[ROW][C]33[/C][C]0.206814[/C][C]2.1493[/C][C]0.016923[/C][/ROW]
[ROW][C]34[/C][C]-0.338302[/C][C]-3.5157[/C][C]0.000321[/C][/ROW]
[ROW][C]35[/C][C]-0.057889[/C][C]-0.6016[/C][C]0.27435[/C][/ROW]
[ROW][C]36[/C][C]0.49075[/C][C]5.1[/C][C]1e-06[/C][/ROW]
[ROW][C]37[/C][C]-0.178867[/C][C]-1.8588[/C][C]0.032886[/C][/ROW]
[ROW][C]38[/C][C]-0.1786[/C][C]-1.8561[/C][C]0.033085[/C][/ROW]
[ROW][C]39[/C][C]0.204407[/C][C]2.1243[/C][C]0.017965[/C][/ROW]
[ROW][C]40[/C][C]-0.227644[/C][C]-2.3657[/C][C]0.009889[/C][/ROW]
[ROW][C]41[/C][C]-0.045899[/C][C]-0.477[/C][C]0.317163[/C][/ROW]
[ROW][C]42[/C][C]0.348765[/C][C]3.6245[/C][C]0.000222[/C][/ROW]
[ROW][C]43[/C][C]-0.11321[/C][C]-1.1765[/C][C]0.120989[/C][/ROW]
[ROW][C]44[/C][C]-0.096224[/C][C]-1[/C][C]0.159776[/C][/ROW]
[ROW][C]45[/C][C]0.159913[/C][C]1.6619[/C][C]0.04972[/C][/ROW]
[ROW][C]46[/C][C]-0.254016[/C][C]-2.6398[/C][C]0.004762[/C][/ROW]
[ROW][C]47[/C][C]-0.054482[/C][C]-0.5662[/C][C]0.28622[/C][/ROW]
[ROW][C]48[/C][C]0.340019[/C][C]3.5336[/C][C]0.000302[/C][/ROW]
[/TABLE]
Source: https://freestatistics.org/blog/index.php?pk=210933&T=1

Globally Unique Identifier (entire table): ba.freestatistics.org/blog/index.php?pk=210933&T=1

As an alternative you can also use a QR Code:  

The GUIDs for individual cells are displayed in the table below:

Autocorrelation Function
Time lag kACF(k)T-STATP-value
1-0.126801-1.31780.095188
2-0.445935-4.63435e-06
30.2853982.96590.001858
4-0.295691-3.07290.001342
5-0.173351-1.80150.037206
60.6000246.23560
7-0.152888-1.58890.057508
8-0.293019-3.04510.001461
90.2437642.53330.006368
10-0.416238-4.32571.7e-05
11-0.087026-0.90440.183897
120.8222218.54480
13-0.153252-1.59260.057081
14-0.359868-3.73990.000148
150.2477952.57520.005686
16-0.312426-3.24680.000777
17-0.109148-1.13430.129591
180.5487535.70280
19-0.154475-1.60530.055669
20-0.217742-2.26280.012823
210.2384292.47780.007384
22-0.397759-4.13363.5e-05
23-0.066122-0.68720.246729
240.6536026.79240
25-0.177584-1.84550.033852
26-0.268625-2.79160.003102
270.2343462.43540.008256
28-0.288293-2.9960.001696
29-0.069706-0.72440.235191
300.4636674.81862e-06
31-0.143047-1.48660.070019
32-0.146686-1.52440.065165
330.2068142.14930.016923
34-0.338302-3.51570.000321
35-0.057889-0.60160.27435
360.490755.11e-06
37-0.178867-1.85880.032886
38-0.1786-1.85610.033085
390.2044072.12430.017965
40-0.227644-2.36570.009889
41-0.045899-0.4770.317163
420.3487653.62450.000222
43-0.11321-1.17650.120989
44-0.096224-10.159776
450.1599131.66190.04972
46-0.254016-2.63980.004762
47-0.054482-0.56620.28622
480.3400193.53360.000302


Partial Autocorrelation Function
Time lag kPACF(k)T-STATP-value
1-0.126801-1.31780.095188
2-0.469563-4.87982e-06
30.1861351.93440.027842
4-0.59127-6.14470
50.0194720.20240.420008
60.2015542.09460.019272
7-0.150394-1.56290.060496
80.0666280.69240.245081
9-0.178062-1.85050.033489
10-0.490786-5.10041e-06
110.0172190.17890.429157
120.4864735.05561e-06
130.0074980.07790.469016
140.1498821.55760.061124
15-0.194891-2.02540.022648
16-0.002202-0.02290.490891
170.0449730.46740.320587
18-0.127697-1.32710.093642
190.0433390.45040.326667
200.032910.3420.366502
210.1399681.45460.074341
220.0330250.34320.366056
23-0.068666-0.71360.238507
24-0.16526-1.71740.044383
25-0.073313-0.76190.223894
26-0.053139-0.55220.290965
270.0602930.62660.266129
280.1142381.18720.118877
290.0136640.1420.443672
30-0.025243-0.26230.396783
310.0006540.00680.497295
32-0.078539-0.81620.20809
33-0.049259-0.51190.304877
340.0669690.6960.243973
35-0.058357-0.60650.272741
360.0498360.51790.30279
37-0.0534-0.55490.29004
38-0.033253-0.34560.365168
39-0.05126-0.53270.297664
400.0593030.61630.269499
41-0.035193-0.36570.357639
420.0044370.04610.481655
430.0704820.73250.232734
44-0.079412-0.82530.205518
450.0123470.12830.449069
46-0.025632-0.26640.39523
47-0.078754-0.81840.207456
480.0190250.19770.421819

\begin{tabular}{lllllllll}
\hline
Partial Autocorrelation Function \tabularnewline
Time lag k & PACF(k) & T-STAT & P-value \tabularnewline
1 & -0.126801 & -1.3178 & 0.095188 \tabularnewline
2 & -0.469563 & -4.8798 & 2e-06 \tabularnewline
3 & 0.186135 & 1.9344 & 0.027842 \tabularnewline
4 & -0.59127 & -6.1447 & 0 \tabularnewline
5 & 0.019472 & 0.2024 & 0.420008 \tabularnewline
6 & 0.201554 & 2.0946 & 0.019272 \tabularnewline
7 & -0.150394 & -1.5629 & 0.060496 \tabularnewline
8 & 0.066628 & 0.6924 & 0.245081 \tabularnewline
9 & -0.178062 & -1.8505 & 0.033489 \tabularnewline
10 & -0.490786 & -5.1004 & 1e-06 \tabularnewline
11 & 0.017219 & 0.1789 & 0.429157 \tabularnewline
12 & 0.486473 & 5.0556 & 1e-06 \tabularnewline
13 & 0.007498 & 0.0779 & 0.469016 \tabularnewline
14 & 0.149882 & 1.5576 & 0.061124 \tabularnewline
15 & -0.194891 & -2.0254 & 0.022648 \tabularnewline
16 & -0.002202 & -0.0229 & 0.490891 \tabularnewline
17 & 0.044973 & 0.4674 & 0.320587 \tabularnewline
18 & -0.127697 & -1.3271 & 0.093642 \tabularnewline
19 & 0.043339 & 0.4504 & 0.326667 \tabularnewline
20 & 0.03291 & 0.342 & 0.366502 \tabularnewline
21 & 0.139968 & 1.4546 & 0.074341 \tabularnewline
22 & 0.033025 & 0.3432 & 0.366056 \tabularnewline
23 & -0.068666 & -0.7136 & 0.238507 \tabularnewline
24 & -0.16526 & -1.7174 & 0.044383 \tabularnewline
25 & -0.073313 & -0.7619 & 0.223894 \tabularnewline
26 & -0.053139 & -0.5522 & 0.290965 \tabularnewline
27 & 0.060293 & 0.6266 & 0.266129 \tabularnewline
28 & 0.114238 & 1.1872 & 0.118877 \tabularnewline
29 & 0.013664 & 0.142 & 0.443672 \tabularnewline
30 & -0.025243 & -0.2623 & 0.396783 \tabularnewline
31 & 0.000654 & 0.0068 & 0.497295 \tabularnewline
32 & -0.078539 & -0.8162 & 0.20809 \tabularnewline
33 & -0.049259 & -0.5119 & 0.304877 \tabularnewline
34 & 0.066969 & 0.696 & 0.243973 \tabularnewline
35 & -0.058357 & -0.6065 & 0.272741 \tabularnewline
36 & 0.049836 & 0.5179 & 0.30279 \tabularnewline
37 & -0.0534 & -0.5549 & 0.29004 \tabularnewline
38 & -0.033253 & -0.3456 & 0.365168 \tabularnewline
39 & -0.05126 & -0.5327 & 0.297664 \tabularnewline
40 & 0.059303 & 0.6163 & 0.269499 \tabularnewline
41 & -0.035193 & -0.3657 & 0.357639 \tabularnewline
42 & 0.004437 & 0.0461 & 0.481655 \tabularnewline
43 & 0.070482 & 0.7325 & 0.232734 \tabularnewline
44 & -0.079412 & -0.8253 & 0.205518 \tabularnewline
45 & 0.012347 & 0.1283 & 0.449069 \tabularnewline
46 & -0.025632 & -0.2664 & 0.39523 \tabularnewline
47 & -0.078754 & -0.8184 & 0.207456 \tabularnewline
48 & 0.019025 & 0.1977 & 0.421819 \tabularnewline
\hline
\end{tabular}
%Source: https://freestatistics.org/blog/index.php?pk=210933&T=2

[TABLE]
[ROW][C]Partial Autocorrelation Function[/C][/ROW]
[ROW][C]Time lag k[/C][C]PACF(k)[/C][C]T-STAT[/C][C]P-value[/C][/ROW]
[ROW][C]1[/C][C]-0.126801[/C][C]-1.3178[/C][C]0.095188[/C][/ROW]
[ROW][C]2[/C][C]-0.469563[/C][C]-4.8798[/C][C]2e-06[/C][/ROW]
[ROW][C]3[/C][C]0.186135[/C][C]1.9344[/C][C]0.027842[/C][/ROW]
[ROW][C]4[/C][C]-0.59127[/C][C]-6.1447[/C][C]0[/C][/ROW]
[ROW][C]5[/C][C]0.019472[/C][C]0.2024[/C][C]0.420008[/C][/ROW]
[ROW][C]6[/C][C]0.201554[/C][C]2.0946[/C][C]0.019272[/C][/ROW]
[ROW][C]7[/C][C]-0.150394[/C][C]-1.5629[/C][C]0.060496[/C][/ROW]
[ROW][C]8[/C][C]0.066628[/C][C]0.6924[/C][C]0.245081[/C][/ROW]
[ROW][C]9[/C][C]-0.178062[/C][C]-1.8505[/C][C]0.033489[/C][/ROW]
[ROW][C]10[/C][C]-0.490786[/C][C]-5.1004[/C][C]1e-06[/C][/ROW]
[ROW][C]11[/C][C]0.017219[/C][C]0.1789[/C][C]0.429157[/C][/ROW]
[ROW][C]12[/C][C]0.486473[/C][C]5.0556[/C][C]1e-06[/C][/ROW]
[ROW][C]13[/C][C]0.007498[/C][C]0.0779[/C][C]0.469016[/C][/ROW]
[ROW][C]14[/C][C]0.149882[/C][C]1.5576[/C][C]0.061124[/C][/ROW]
[ROW][C]15[/C][C]-0.194891[/C][C]-2.0254[/C][C]0.022648[/C][/ROW]
[ROW][C]16[/C][C]-0.002202[/C][C]-0.0229[/C][C]0.490891[/C][/ROW]
[ROW][C]17[/C][C]0.044973[/C][C]0.4674[/C][C]0.320587[/C][/ROW]
[ROW][C]18[/C][C]-0.127697[/C][C]-1.3271[/C][C]0.093642[/C][/ROW]
[ROW][C]19[/C][C]0.043339[/C][C]0.4504[/C][C]0.326667[/C][/ROW]
[ROW][C]20[/C][C]0.03291[/C][C]0.342[/C][C]0.366502[/C][/ROW]
[ROW][C]21[/C][C]0.139968[/C][C]1.4546[/C][C]0.074341[/C][/ROW]
[ROW][C]22[/C][C]0.033025[/C][C]0.3432[/C][C]0.366056[/C][/ROW]
[ROW][C]23[/C][C]-0.068666[/C][C]-0.7136[/C][C]0.238507[/C][/ROW]
[ROW][C]24[/C][C]-0.16526[/C][C]-1.7174[/C][C]0.044383[/C][/ROW]
[ROW][C]25[/C][C]-0.073313[/C][C]-0.7619[/C][C]0.223894[/C][/ROW]
[ROW][C]26[/C][C]-0.053139[/C][C]-0.5522[/C][C]0.290965[/C][/ROW]
[ROW][C]27[/C][C]0.060293[/C][C]0.6266[/C][C]0.266129[/C][/ROW]
[ROW][C]28[/C][C]0.114238[/C][C]1.1872[/C][C]0.118877[/C][/ROW]
[ROW][C]29[/C][C]0.013664[/C][C]0.142[/C][C]0.443672[/C][/ROW]
[ROW][C]30[/C][C]-0.025243[/C][C]-0.2623[/C][C]0.396783[/C][/ROW]
[ROW][C]31[/C][C]0.000654[/C][C]0.0068[/C][C]0.497295[/C][/ROW]
[ROW][C]32[/C][C]-0.078539[/C][C]-0.8162[/C][C]0.20809[/C][/ROW]
[ROW][C]33[/C][C]-0.049259[/C][C]-0.5119[/C][C]0.304877[/C][/ROW]
[ROW][C]34[/C][C]0.066969[/C][C]0.696[/C][C]0.243973[/C][/ROW]
[ROW][C]35[/C][C]-0.058357[/C][C]-0.6065[/C][C]0.272741[/C][/ROW]
[ROW][C]36[/C][C]0.049836[/C][C]0.5179[/C][C]0.30279[/C][/ROW]
[ROW][C]37[/C][C]-0.0534[/C][C]-0.5549[/C][C]0.29004[/C][/ROW]
[ROW][C]38[/C][C]-0.033253[/C][C]-0.3456[/C][C]0.365168[/C][/ROW]
[ROW][C]39[/C][C]-0.05126[/C][C]-0.5327[/C][C]0.297664[/C][/ROW]
[ROW][C]40[/C][C]0.059303[/C][C]0.6163[/C][C]0.269499[/C][/ROW]
[ROW][C]41[/C][C]-0.035193[/C][C]-0.3657[/C][C]0.357639[/C][/ROW]
[ROW][C]42[/C][C]0.004437[/C][C]0.0461[/C][C]0.481655[/C][/ROW]
[ROW][C]43[/C][C]0.070482[/C][C]0.7325[/C][C]0.232734[/C][/ROW]
[ROW][C]44[/C][C]-0.079412[/C][C]-0.8253[/C][C]0.205518[/C][/ROW]
[ROW][C]45[/C][C]0.012347[/C][C]0.1283[/C][C]0.449069[/C][/ROW]
[ROW][C]46[/C][C]-0.025632[/C][C]-0.2664[/C][C]0.39523[/C][/ROW]
[ROW][C]47[/C][C]-0.078754[/C][C]-0.8184[/C][C]0.207456[/C][/ROW]
[ROW][C]48[/C][C]0.019025[/C][C]0.1977[/C][C]0.421819[/C][/ROW]
[/TABLE]
Source: https://freestatistics.org/blog/index.php?pk=210933&T=2

Globally Unique Identifier (entire table): ba.freestatistics.org/blog/index.php?pk=210933&T=2

As an alternative you can also use a QR Code:  

The GUIDs for individual cells are displayed in the table below:

Partial Autocorrelation Function
Time lag kPACF(k)T-STATP-value
1-0.126801-1.31780.095188
2-0.469563-4.87982e-06
30.1861351.93440.027842
4-0.59127-6.14470
50.0194720.20240.420008
60.2015542.09460.019272
7-0.150394-1.56290.060496
80.0666280.69240.245081
9-0.178062-1.85050.033489
10-0.490786-5.10041e-06
110.0172190.17890.429157
120.4864735.05561e-06
130.0074980.07790.469016
140.1498821.55760.061124
15-0.194891-2.02540.022648
16-0.002202-0.02290.490891
170.0449730.46740.320587
18-0.127697-1.32710.093642
190.0433390.45040.326667
200.032910.3420.366502
210.1399681.45460.074341
220.0330250.34320.366056
23-0.068666-0.71360.238507
24-0.16526-1.71740.044383
25-0.073313-0.76190.223894
26-0.053139-0.55220.290965
270.0602930.62660.266129
280.1142381.18720.118877
290.0136640.1420.443672
30-0.025243-0.26230.396783
310.0006540.00680.497295
32-0.078539-0.81620.20809
33-0.049259-0.51190.304877
340.0669690.6960.243973
35-0.058357-0.60650.272741
360.0498360.51790.30279
37-0.0534-0.55490.29004
38-0.033253-0.34560.365168
39-0.05126-0.53270.297664
400.0593030.61630.269499
41-0.035193-0.36570.357639
420.0044370.04610.481655
430.0704820.73250.232734
44-0.079412-0.82530.205518
450.0123470.12830.449069
46-0.025632-0.26640.39523
47-0.078754-0.81840.207456
480.0190250.19770.421819


Parameters (Session):
par1 = 48 ; par2 = 1 ; par3 = 0 ; par4 = 0 ; par5 = 12 ; par6 = White Noise ; par7 = 0.95 ;
Parameters (R input):
par1 = 48 ; par2 = 1 ; par3 = 0 ; par4 = 0 ; par5 = 12 ; par6 = White Noise ; par7 = 0.95 ; par8 = ;
R code (references can be found in the software module):
if (par1 == 'Default') {
par1 = 10*log10(length(x))
} else {
par1 <- as.numeric(par1)
}
par2 <- as.numeric(par2)
par3 <- as.numeric(par3)
par4 <- as.numeric(par4)
par5 <- as.numeric(par5)
if (par6 == 'White Noise') par6 <- 'white' else par6 <- 'ma'
par7 <- as.numeric(par7)
if (par8 != '') par8 <- as.numeric(par8)
ox <- x
if (par8 == '') {
if (par2 == 0) {
x <- log(x)
} else {
x <- (x ^ par2 - 1) / par2
}
} else {
x <- log(x,base=par8)
}
if (par3 > 0) x <- diff(x,lag=1,difference=par3)
if (par4 > 0) x <- diff(x,lag=par5,difference=par4)
bitmap(file='picts.png')
op <- par(mfrow=c(2,1))
plot(ox,type='l',main='Original Time Series',xlab='time',ylab='value')
if (par8=='') {
mytitle <- paste('Working Time Series (lambda=',par2,', d=',par3,', D=',par4,')',sep='')
mysub <- paste('(lambda=',par2,', d=',par3,', D=',par4,', CI=', par7, ', CI type=',par6,')',sep='')
} else {
mytitle <- paste('Working Time Series (base=',par8,', d=',par3,', D=',par4,')',sep='')
mysub <- paste('(base=',par8,', d=',par3,', D=',par4,', CI=', par7, ', CI type=',par6,')',sep='')
}
plot(x,type='l', main=mytitle,xlab='time',ylab='value')
par(op)
dev.off()
bitmap(file='pic1.png')
racf <- acf(x, par1, main='Autocorrelation', xlab='time lag', ylab='ACF', ci.type=par6, ci=par7, sub=mysub)
dev.off()
bitmap(file='pic2.png')
rpacf <- pacf(x,par1,main='Partial Autocorrelation',xlab='lags',ylab='PACF',sub=mysub)
dev.off()
(myacf <- c(racf$acf))
(mypacf <- c(rpacf$acf))
lengthx <- length(x)
sqrtn <- sqrt(lengthx)
load(file='createtable')
a<-table.start()
a<-table.row.start(a)
a<-table.element(a,'Autocorrelation Function',4,TRUE)
a<-table.row.end(a)
a<-table.row.start(a)
a<-table.element(a,'Time lag k',header=TRUE)
a<-table.element(a,hyperlink('basics.htm','ACF(k)','click here for more information about the Autocorrelation Function'),header=TRUE)
a<-table.element(a,'T-STAT',header=TRUE)
a<-table.element(a,'P-value',header=TRUE)
a<-table.row.end(a)
for (i in 2:(par1+1)) {
a<-table.row.start(a)
a<-table.element(a,i-1,header=TRUE)
a<-table.element(a,round(myacf[i],6))
mytstat <- myacf[i]*sqrtn
a<-table.element(a,round(mytstat,4))
a<-table.element(a,round(1-pt(abs(mytstat),lengthx),6))
a<-table.row.end(a)
}
a<-table.end(a)
table.save(a,file='mytable.tab')
a<-table.start()
a<-table.row.start(a)
a<-table.element(a,'Partial Autocorrelation Function',4,TRUE)
a<-table.row.end(a)
a<-table.row.start(a)
a<-table.element(a,'Time lag k',header=TRUE)
a<-table.element(a,hyperlink('basics.htm','PACF(k)','click here for more information about the Partial Autocorrelation Function'),header=TRUE)
a<-table.element(a,'T-STAT',header=TRUE)
a<-table.element(a,'P-value',header=TRUE)
a<-table.row.end(a)
for (i in 1:par1) {
a<-table.row.start(a)
a<-table.element(a,i,header=TRUE)
a<-table.element(a,round(mypacf[i],6))
mytstat <- mypacf[i]*sqrtn
a<-table.element(a,round(mytstat,4))
a<-table.element(a,round(1-pt(abs(mytstat),lengthx),6))
a<-table.row.end(a)
}
a<-table.end(a)
table.save(a,file='mytable1.tab')