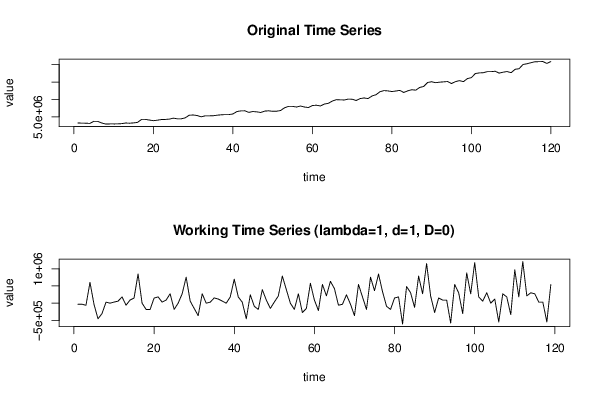
Free Statistics

of Irreproducible Research!

Author's title

Author*Unverified author*
R Software Modulerwasp_autocorrelation.wasp
Title produced by software(Partial) Autocorrelation Function
Date of computationWed, 07 Aug 2013 10:17:29 -0400
Cite this page as followsStatistical Computations at FreeStatistics.org, Office for Research Development and Education, URL https://freestatistics.org/blog/index.php?v=date/2013/Aug/07/t1375885196mgqw2iw7ay094gc.htm/, Retrieved Tue, 30 Apr 2024 05:31:25 +0000
Statistical Computations at FreeStatistics.org, Office for Research Development and Education, URL https://freestatistics.org/blog/index.php?pk=210978, Retrieved Tue, 30 Apr 2024 05:31:25 +0000
QR Codes:

Original text written by user:
IsPrivate?No (this computation is public)
User-defined keywordskevin kofi asare
Estimated Impact168
Family? (F = Feedback message, R = changed R code, M = changed R Module, P = changed Parameters, D = changed Data)
-     [(Partial) Autocorrelation Function] [Inschrijvingen ni...] [2011-11-21 16:03:08] [102faec22d2a25d9aaa52ca244269a51]
- R PD    [(Partial) Autocorrelation Function] [Tijdreeks 1 - Sta...] [2013-08-07 14:17:29] [4d26c4233714d8e4ecf99606d744931b] [Current]
Feedback Forum

Post a new message
Dataseries X:
3207324
3178086
3148485
3087246
3693267
3661164
3207324
2905563
2934699
2934699
2967168
3025542
3207324
3148485
3239325
3388641
4238049
4238049
4056732
3874950
4024266
4205949
4238049
4328892
4601499
4419732
4419732
4692342
5448042
5509281
5357202
4993734
5266260
5266260
5295495
5448042
5568120
5629359
5629359
5811042
6508356
6689670
6718809
6264966
6508356
6417513
6235746
6628434
6718809
6566727
6598830
6809748
7597920
7990056
7990056
7808739
8080980
7808739
7656276
8233527
8323902
8110134
8654901
8868684
9504309
9926133
9867774
9835290
10078677
10049076
9686076
10230759
10412541
10230759
10986462
11349927
12196086
12529950
12439476
12257691
12409872
12591555
11985168
12468612
12773337
12650394
13438098
13710240
14861511
15072414
14800254
14952351
15043194
15134034
14556783
15101568
15403311
15101568
15980562
16252821
17433111
17614893
17673267
17977893
17977893
18097971
17553189
17825814
18007131
17673267
18642738
18824436
20034063
20247849
20549592
20822217
20851353
20883456
20338689
20883456


Summary of computational transaction
Raw Inputview raw input (R code)
Raw Outputview raw output of R engine
Computing time2 seconds
R Server'George Udny Yule' @ yule.wessa.net

\begin{tabular}{lllllllll}
\hline
Summary of computational transaction \tabularnewline
Raw Input & view raw input (R code)  \tabularnewline
Raw Output & view raw output of R engine  \tabularnewline
Computing time & 2 seconds \tabularnewline
R Server & 'George Udny Yule' @ yule.wessa.net \tabularnewline
\hline
\end{tabular}
%Source: https://freestatistics.org/blog/index.php?pk=210978&T=0

[TABLE]
[ROW][C]Summary of computational transaction[/C][/ROW]
[ROW][C]Raw Input[/C][C]view raw input (R code) [/C][/ROW]
[ROW][C]Raw Output[/C][C]view raw output of R engine [/C][/ROW]
[ROW][C]Computing time[/C][C]2 seconds[/C][/ROW]
[ROW][C]R Server[/C][C]'George Udny Yule' @ yule.wessa.net[/C][/ROW]
[/TABLE]
Source: https://freestatistics.org/blog/index.php?pk=210978&T=0

Globally Unique Identifier (entire table): ba.freestatistics.org/blog/index.php?pk=210978&T=0

As an alternative you can also use a QR Code:  

The GUIDs for individual cells are displayed in the table below:

Summary of computational transaction
Raw Inputview raw input (R code)
Raw Outputview raw output of R engine
Computing time2 seconds
R Server'George Udny Yule' @ yule.wessa.net


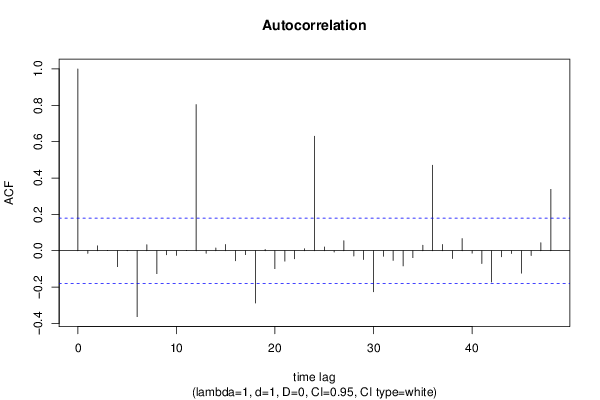
Autocorrelation Function
Time lag kACF(k)T-STATP-value
1-0.014628-0.15960.436746
20.0264420.28840.386754
30.0011260.01230.495112
4-0.087593-0.95550.170624
50.0018350.020.492032
6-0.362899-3.95886.4e-05
70.0332190.36240.358858
8-0.126057-1.37510.085839
9-0.022567-0.24620.402984
10-0.025881-0.28230.389089
110.0012080.01320.494753
120.803778.76810
13-0.013926-0.15190.439758
140.0145790.1590.436956
150.0342170.37330.354809
16-0.055766-0.60830.272063
17-0.021585-0.23550.407126
18-0.288233-3.14430.001051
190.0067260.07340.470817
20-0.098668-1.07630.141975
21-0.057543-0.62770.265695
22-0.044121-0.48130.315593
230.0108750.11860.452884
240.6293916.86580
250.0199270.21740.414143
26-0.00704-0.07680.469458
270.0545660.59520.276405
28-0.028791-0.31410.377007
29-0.048222-0.5260.299918
30-0.225764-2.46280.007609
31-0.030162-0.3290.371354
32-0.053341-0.58190.280873
33-0.083726-0.91330.181453
34-0.038177-0.41650.338911
350.0303910.33150.370414
360.4700265.12741e-06
370.0338830.36960.356162
38-0.043313-0.47250.31872
390.0664680.72510.234914
40-0.013456-0.14680.441775
41-0.070124-0.7650.222905
42-0.17248-1.88150.031171
43-0.032952-0.35950.359942
44-0.01502-0.16380.435065
45-0.123415-1.34630.090382
46-0.026288-0.28680.387394
470.0440580.48060.315836
480.3372953.67950.000176

\begin{tabular}{lllllllll}
\hline
Autocorrelation Function \tabularnewline
Time lag k & ACF(k) & T-STAT & P-value \tabularnewline
1 & -0.014628 & -0.1596 & 0.436746 \tabularnewline
2 & 0.026442 & 0.2884 & 0.386754 \tabularnewline
3 & 0.001126 & 0.0123 & 0.495112 \tabularnewline
4 & -0.087593 & -0.9555 & 0.170624 \tabularnewline
5 & 0.001835 & 0.02 & 0.492032 \tabularnewline
6 & -0.362899 & -3.9588 & 6.4e-05 \tabularnewline
7 & 0.033219 & 0.3624 & 0.358858 \tabularnewline
8 & -0.126057 & -1.3751 & 0.085839 \tabularnewline
9 & -0.022567 & -0.2462 & 0.402984 \tabularnewline
10 & -0.025881 & -0.2823 & 0.389089 \tabularnewline
11 & 0.001208 & 0.0132 & 0.494753 \tabularnewline
12 & 0.80377 & 8.7681 & 0 \tabularnewline
13 & -0.013926 & -0.1519 & 0.439758 \tabularnewline
14 & 0.014579 & 0.159 & 0.436956 \tabularnewline
15 & 0.034217 & 0.3733 & 0.354809 \tabularnewline
16 & -0.055766 & -0.6083 & 0.272063 \tabularnewline
17 & -0.021585 & -0.2355 & 0.407126 \tabularnewline
18 & -0.288233 & -3.1443 & 0.001051 \tabularnewline
19 & 0.006726 & 0.0734 & 0.470817 \tabularnewline
20 & -0.098668 & -1.0763 & 0.141975 \tabularnewline
21 & -0.057543 & -0.6277 & 0.265695 \tabularnewline
22 & -0.044121 & -0.4813 & 0.315593 \tabularnewline
23 & 0.010875 & 0.1186 & 0.452884 \tabularnewline
24 & 0.629391 & 6.8658 & 0 \tabularnewline
25 & 0.019927 & 0.2174 & 0.414143 \tabularnewline
26 & -0.00704 & -0.0768 & 0.469458 \tabularnewline
27 & 0.054566 & 0.5952 & 0.276405 \tabularnewline
28 & -0.028791 & -0.3141 & 0.377007 \tabularnewline
29 & -0.048222 & -0.526 & 0.299918 \tabularnewline
30 & -0.225764 & -2.4628 & 0.007609 \tabularnewline
31 & -0.030162 & -0.329 & 0.371354 \tabularnewline
32 & -0.053341 & -0.5819 & 0.280873 \tabularnewline
33 & -0.083726 & -0.9133 & 0.181453 \tabularnewline
34 & -0.038177 & -0.4165 & 0.338911 \tabularnewline
35 & 0.030391 & 0.3315 & 0.370414 \tabularnewline
36 & 0.470026 & 5.1274 & 1e-06 \tabularnewline
37 & 0.033883 & 0.3696 & 0.356162 \tabularnewline
38 & -0.043313 & -0.4725 & 0.31872 \tabularnewline
39 & 0.066468 & 0.7251 & 0.234914 \tabularnewline
40 & -0.013456 & -0.1468 & 0.441775 \tabularnewline
41 & -0.070124 & -0.765 & 0.222905 \tabularnewline
42 & -0.17248 & -1.8815 & 0.031171 \tabularnewline
43 & -0.032952 & -0.3595 & 0.359942 \tabularnewline
44 & -0.01502 & -0.1638 & 0.435065 \tabularnewline
45 & -0.123415 & -1.3463 & 0.090382 \tabularnewline
46 & -0.026288 & -0.2868 & 0.387394 \tabularnewline
47 & 0.044058 & 0.4806 & 0.315836 \tabularnewline
48 & 0.337295 & 3.6795 & 0.000176 \tabularnewline
\hline
\end{tabular}
%Source: https://freestatistics.org/blog/index.php?pk=210978&T=1

[TABLE]
[ROW][C]Autocorrelation Function[/C][/ROW]
[ROW][C]Time lag k[/C][C]ACF(k)[/C][C]T-STAT[/C][C]P-value[/C][/ROW]
[ROW][C]1[/C][C]-0.014628[/C][C]-0.1596[/C][C]0.436746[/C][/ROW]
[ROW][C]2[/C][C]0.026442[/C][C]0.2884[/C][C]0.386754[/C][/ROW]
[ROW][C]3[/C][C]0.001126[/C][C]0.0123[/C][C]0.495112[/C][/ROW]
[ROW][C]4[/C][C]-0.087593[/C][C]-0.9555[/C][C]0.170624[/C][/ROW]
[ROW][C]5[/C][C]0.001835[/C][C]0.02[/C][C]0.492032[/C][/ROW]
[ROW][C]6[/C][C]-0.362899[/C][C]-3.9588[/C][C]6.4e-05[/C][/ROW]
[ROW][C]7[/C][C]0.033219[/C][C]0.3624[/C][C]0.358858[/C][/ROW]
[ROW][C]8[/C][C]-0.126057[/C][C]-1.3751[/C][C]0.085839[/C][/ROW]
[ROW][C]9[/C][C]-0.022567[/C][C]-0.2462[/C][C]0.402984[/C][/ROW]
[ROW][C]10[/C][C]-0.025881[/C][C]-0.2823[/C][C]0.389089[/C][/ROW]
[ROW][C]11[/C][C]0.001208[/C][C]0.0132[/C][C]0.494753[/C][/ROW]
[ROW][C]12[/C][C]0.80377[/C][C]8.7681[/C][C]0[/C][/ROW]
[ROW][C]13[/C][C]-0.013926[/C][C]-0.1519[/C][C]0.439758[/C][/ROW]
[ROW][C]14[/C][C]0.014579[/C][C]0.159[/C][C]0.436956[/C][/ROW]
[ROW][C]15[/C][C]0.034217[/C][C]0.3733[/C][C]0.354809[/C][/ROW]
[ROW][C]16[/C][C]-0.055766[/C][C]-0.6083[/C][C]0.272063[/C][/ROW]
[ROW][C]17[/C][C]-0.021585[/C][C]-0.2355[/C][C]0.407126[/C][/ROW]
[ROW][C]18[/C][C]-0.288233[/C][C]-3.1443[/C][C]0.001051[/C][/ROW]
[ROW][C]19[/C][C]0.006726[/C][C]0.0734[/C][C]0.470817[/C][/ROW]
[ROW][C]20[/C][C]-0.098668[/C][C]-1.0763[/C][C]0.141975[/C][/ROW]
[ROW][C]21[/C][C]-0.057543[/C][C]-0.6277[/C][C]0.265695[/C][/ROW]
[ROW][C]22[/C][C]-0.044121[/C][C]-0.4813[/C][C]0.315593[/C][/ROW]
[ROW][C]23[/C][C]0.010875[/C][C]0.1186[/C][C]0.452884[/C][/ROW]
[ROW][C]24[/C][C]0.629391[/C][C]6.8658[/C][C]0[/C][/ROW]
[ROW][C]25[/C][C]0.019927[/C][C]0.2174[/C][C]0.414143[/C][/ROW]
[ROW][C]26[/C][C]-0.00704[/C][C]-0.0768[/C][C]0.469458[/C][/ROW]
[ROW][C]27[/C][C]0.054566[/C][C]0.5952[/C][C]0.276405[/C][/ROW]
[ROW][C]28[/C][C]-0.028791[/C][C]-0.3141[/C][C]0.377007[/C][/ROW]
[ROW][C]29[/C][C]-0.048222[/C][C]-0.526[/C][C]0.299918[/C][/ROW]
[ROW][C]30[/C][C]-0.225764[/C][C]-2.4628[/C][C]0.007609[/C][/ROW]
[ROW][C]31[/C][C]-0.030162[/C][C]-0.329[/C][C]0.371354[/C][/ROW]
[ROW][C]32[/C][C]-0.053341[/C][C]-0.5819[/C][C]0.280873[/C][/ROW]
[ROW][C]33[/C][C]-0.083726[/C][C]-0.9133[/C][C]0.181453[/C][/ROW]
[ROW][C]34[/C][C]-0.038177[/C][C]-0.4165[/C][C]0.338911[/C][/ROW]
[ROW][C]35[/C][C]0.030391[/C][C]0.3315[/C][C]0.370414[/C][/ROW]
[ROW][C]36[/C][C]0.470026[/C][C]5.1274[/C][C]1e-06[/C][/ROW]
[ROW][C]37[/C][C]0.033883[/C][C]0.3696[/C][C]0.356162[/C][/ROW]
[ROW][C]38[/C][C]-0.043313[/C][C]-0.4725[/C][C]0.31872[/C][/ROW]
[ROW][C]39[/C][C]0.066468[/C][C]0.7251[/C][C]0.234914[/C][/ROW]
[ROW][C]40[/C][C]-0.013456[/C][C]-0.1468[/C][C]0.441775[/C][/ROW]
[ROW][C]41[/C][C]-0.070124[/C][C]-0.765[/C][C]0.222905[/C][/ROW]
[ROW][C]42[/C][C]-0.17248[/C][C]-1.8815[/C][C]0.031171[/C][/ROW]
[ROW][C]43[/C][C]-0.032952[/C][C]-0.3595[/C][C]0.359942[/C][/ROW]
[ROW][C]44[/C][C]-0.01502[/C][C]-0.1638[/C][C]0.435065[/C][/ROW]
[ROW][C]45[/C][C]-0.123415[/C][C]-1.3463[/C][C]0.090382[/C][/ROW]
[ROW][C]46[/C][C]-0.026288[/C][C]-0.2868[/C][C]0.387394[/C][/ROW]
[ROW][C]47[/C][C]0.044058[/C][C]0.4806[/C][C]0.315836[/C][/ROW]
[ROW][C]48[/C][C]0.337295[/C][C]3.6795[/C][C]0.000176[/C][/ROW]
[/TABLE]
Source: https://freestatistics.org/blog/index.php?pk=210978&T=1

Globally Unique Identifier (entire table): ba.freestatistics.org/blog/index.php?pk=210978&T=1

As an alternative you can also use a QR Code:  

The GUIDs for individual cells are displayed in the table below:

Autocorrelation Function
Time lag kACF(k)T-STATP-value
1-0.014628-0.15960.436746
20.0264420.28840.386754
30.0011260.01230.495112
4-0.087593-0.95550.170624
50.0018350.020.492032
6-0.362899-3.95886.4e-05
70.0332190.36240.358858
8-0.126057-1.37510.085839
9-0.022567-0.24620.402984
10-0.025881-0.28230.389089
110.0012080.01320.494753
120.803778.76810
13-0.013926-0.15190.439758
140.0145790.1590.436956
150.0342170.37330.354809
16-0.055766-0.60830.272063
17-0.021585-0.23550.407126
18-0.288233-3.14430.001051
190.0067260.07340.470817
20-0.098668-1.07630.141975
21-0.057543-0.62770.265695
22-0.044121-0.48130.315593
230.0108750.11860.452884
240.6293916.86580
250.0199270.21740.414143
26-0.00704-0.07680.469458
270.0545660.59520.276405
28-0.028791-0.31410.377007
29-0.048222-0.5260.299918
30-0.225764-2.46280.007609
31-0.030162-0.3290.371354
32-0.053341-0.58190.280873
33-0.083726-0.91330.181453
34-0.038177-0.41650.338911
350.0303910.33150.370414
360.4700265.12741e-06
370.0338830.36960.356162
38-0.043313-0.47250.31872
390.0664680.72510.234914
40-0.013456-0.14680.441775
41-0.070124-0.7650.222905
42-0.17248-1.88150.031171
43-0.032952-0.35950.359942
44-0.01502-0.16380.435065
45-0.123415-1.34630.090382
46-0.026288-0.28680.387394
470.0440580.48060.315836
480.3372953.67950.000176


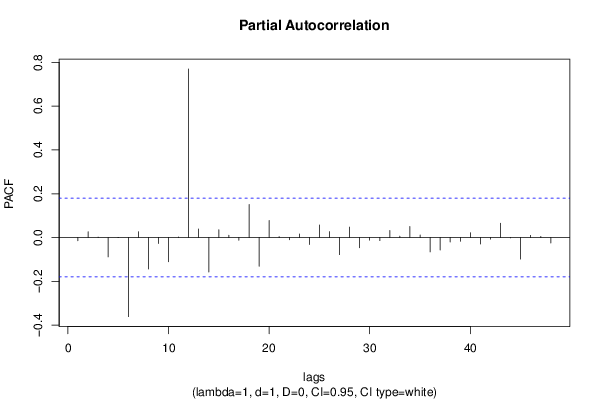
Partial Autocorrelation Function
Time lag kPACF(k)T-STATP-value
1-0.014628-0.15960.436746
20.0262330.28620.387622
30.0018880.02060.491803
4-0.088324-0.96350.168626
5-0.00075-0.00820.496745
6-0.361188-3.94016.9e-05
70.0266980.29120.385687
8-0.1439-1.56980.059563
9-0.027005-0.29460.384412
10-0.110666-1.20720.114871
110.0023990.02620.489583
120.7698338.39790
130.0390940.42650.33527
14-0.157368-1.71670.04432
150.0358490.39110.348225
160.0104580.11410.45468
17-0.012306-0.13420.446721
180.1507171.64410.051395
19-0.13113-1.43050.077602
200.0779150.850.198528
210.0041510.04530.481977
22-0.009724-0.10610.45785
230.0163750.17860.429266
24-0.031501-0.34360.365863
250.0572210.62420.266842
260.0271350.2960.383869
27-0.078098-0.85190.197978
280.0477130.52050.301845
29-0.046966-0.51230.30468
30-0.011935-0.13020.448314
31-0.014164-0.15450.438733
320.0325290.35480.361667
330.0063950.06980.472249
340.0501220.54680.29278
350.0115440.12590.449998
36-0.065549-0.71510.237988
37-0.057206-0.6240.266898
38-0.020567-0.22440.41143
39-0.016994-0.18540.426622
400.0218080.23790.406183
41-0.029211-0.31870.375272
42-0.00739-0.08060.46794
430.0652330.71160.239052
44-0.001472-0.01610.493608
45-0.098405-1.07350.142615
460.0101430.11070.45604
470.0052430.05720.477245
48-0.02503-0.2730.392644

\begin{tabular}{lllllllll}
\hline
Partial Autocorrelation Function \tabularnewline
Time lag k & PACF(k) & T-STAT & P-value \tabularnewline
1 & -0.014628 & -0.1596 & 0.436746 \tabularnewline
2 & 0.026233 & 0.2862 & 0.387622 \tabularnewline
3 & 0.001888 & 0.0206 & 0.491803 \tabularnewline
4 & -0.088324 & -0.9635 & 0.168626 \tabularnewline
5 & -0.00075 & -0.0082 & 0.496745 \tabularnewline
6 & -0.361188 & -3.9401 & 6.9e-05 \tabularnewline
7 & 0.026698 & 0.2912 & 0.385687 \tabularnewline
8 & -0.1439 & -1.5698 & 0.059563 \tabularnewline
9 & -0.027005 & -0.2946 & 0.384412 \tabularnewline
10 & -0.110666 & -1.2072 & 0.114871 \tabularnewline
11 & 0.002399 & 0.0262 & 0.489583 \tabularnewline
12 & 0.769833 & 8.3979 & 0 \tabularnewline
13 & 0.039094 & 0.4265 & 0.33527 \tabularnewline
14 & -0.157368 & -1.7167 & 0.04432 \tabularnewline
15 & 0.035849 & 0.3911 & 0.348225 \tabularnewline
16 & 0.010458 & 0.1141 & 0.45468 \tabularnewline
17 & -0.012306 & -0.1342 & 0.446721 \tabularnewline
18 & 0.150717 & 1.6441 & 0.051395 \tabularnewline
19 & -0.13113 & -1.4305 & 0.077602 \tabularnewline
20 & 0.077915 & 0.85 & 0.198528 \tabularnewline
21 & 0.004151 & 0.0453 & 0.481977 \tabularnewline
22 & -0.009724 & -0.1061 & 0.45785 \tabularnewline
23 & 0.016375 & 0.1786 & 0.429266 \tabularnewline
24 & -0.031501 & -0.3436 & 0.365863 \tabularnewline
25 & 0.057221 & 0.6242 & 0.266842 \tabularnewline
26 & 0.027135 & 0.296 & 0.383869 \tabularnewline
27 & -0.078098 & -0.8519 & 0.197978 \tabularnewline
28 & 0.047713 & 0.5205 & 0.301845 \tabularnewline
29 & -0.046966 & -0.5123 & 0.30468 \tabularnewline
30 & -0.011935 & -0.1302 & 0.448314 \tabularnewline
31 & -0.014164 & -0.1545 & 0.438733 \tabularnewline
32 & 0.032529 & 0.3548 & 0.361667 \tabularnewline
33 & 0.006395 & 0.0698 & 0.472249 \tabularnewline
34 & 0.050122 & 0.5468 & 0.29278 \tabularnewline
35 & 0.011544 & 0.1259 & 0.449998 \tabularnewline
36 & -0.065549 & -0.7151 & 0.237988 \tabularnewline
37 & -0.057206 & -0.624 & 0.266898 \tabularnewline
38 & -0.020567 & -0.2244 & 0.41143 \tabularnewline
39 & -0.016994 & -0.1854 & 0.426622 \tabularnewline
40 & 0.021808 & 0.2379 & 0.406183 \tabularnewline
41 & -0.029211 & -0.3187 & 0.375272 \tabularnewline
42 & -0.00739 & -0.0806 & 0.46794 \tabularnewline
43 & 0.065233 & 0.7116 & 0.239052 \tabularnewline
44 & -0.001472 & -0.0161 & 0.493608 \tabularnewline
45 & -0.098405 & -1.0735 & 0.142615 \tabularnewline
46 & 0.010143 & 0.1107 & 0.45604 \tabularnewline
47 & 0.005243 & 0.0572 & 0.477245 \tabularnewline
48 & -0.02503 & -0.273 & 0.392644 \tabularnewline
\hline
\end{tabular}
%Source: https://freestatistics.org/blog/index.php?pk=210978&T=2

[TABLE]
[ROW][C]Partial Autocorrelation Function[/C][/ROW]
[ROW][C]Time lag k[/C][C]PACF(k)[/C][C]T-STAT[/C][C]P-value[/C][/ROW]
[ROW][C]1[/C][C]-0.014628[/C][C]-0.1596[/C][C]0.436746[/C][/ROW]
[ROW][C]2[/C][C]0.026233[/C][C]0.2862[/C][C]0.387622[/C][/ROW]
[ROW][C]3[/C][C]0.001888[/C][C]0.0206[/C][C]0.491803[/C][/ROW]
[ROW][C]4[/C][C]-0.088324[/C][C]-0.9635[/C][C]0.168626[/C][/ROW]
[ROW][C]5[/C][C]-0.00075[/C][C]-0.0082[/C][C]0.496745[/C][/ROW]
[ROW][C]6[/C][C]-0.361188[/C][C]-3.9401[/C][C]6.9e-05[/C][/ROW]
[ROW][C]7[/C][C]0.026698[/C][C]0.2912[/C][C]0.385687[/C][/ROW]
[ROW][C]8[/C][C]-0.1439[/C][C]-1.5698[/C][C]0.059563[/C][/ROW]
[ROW][C]9[/C][C]-0.027005[/C][C]-0.2946[/C][C]0.384412[/C][/ROW]
[ROW][C]10[/C][C]-0.110666[/C][C]-1.2072[/C][C]0.114871[/C][/ROW]
[ROW][C]11[/C][C]0.002399[/C][C]0.0262[/C][C]0.489583[/C][/ROW]
[ROW][C]12[/C][C]0.769833[/C][C]8.3979[/C][C]0[/C][/ROW]
[ROW][C]13[/C][C]0.039094[/C][C]0.4265[/C][C]0.33527[/C][/ROW]
[ROW][C]14[/C][C]-0.157368[/C][C]-1.7167[/C][C]0.04432[/C][/ROW]
[ROW][C]15[/C][C]0.035849[/C][C]0.3911[/C][C]0.348225[/C][/ROW]
[ROW][C]16[/C][C]0.010458[/C][C]0.1141[/C][C]0.45468[/C][/ROW]
[ROW][C]17[/C][C]-0.012306[/C][C]-0.1342[/C][C]0.446721[/C][/ROW]
[ROW][C]18[/C][C]0.150717[/C][C]1.6441[/C][C]0.051395[/C][/ROW]
[ROW][C]19[/C][C]-0.13113[/C][C]-1.4305[/C][C]0.077602[/C][/ROW]
[ROW][C]20[/C][C]0.077915[/C][C]0.85[/C][C]0.198528[/C][/ROW]
[ROW][C]21[/C][C]0.004151[/C][C]0.0453[/C][C]0.481977[/C][/ROW]
[ROW][C]22[/C][C]-0.009724[/C][C]-0.1061[/C][C]0.45785[/C][/ROW]
[ROW][C]23[/C][C]0.016375[/C][C]0.1786[/C][C]0.429266[/C][/ROW]
[ROW][C]24[/C][C]-0.031501[/C][C]-0.3436[/C][C]0.365863[/C][/ROW]
[ROW][C]25[/C][C]0.057221[/C][C]0.6242[/C][C]0.266842[/C][/ROW]
[ROW][C]26[/C][C]0.027135[/C][C]0.296[/C][C]0.383869[/C][/ROW]
[ROW][C]27[/C][C]-0.078098[/C][C]-0.8519[/C][C]0.197978[/C][/ROW]
[ROW][C]28[/C][C]0.047713[/C][C]0.5205[/C][C]0.301845[/C][/ROW]
[ROW][C]29[/C][C]-0.046966[/C][C]-0.5123[/C][C]0.30468[/C][/ROW]
[ROW][C]30[/C][C]-0.011935[/C][C]-0.1302[/C][C]0.448314[/C][/ROW]
[ROW][C]31[/C][C]-0.014164[/C][C]-0.1545[/C][C]0.438733[/C][/ROW]
[ROW][C]32[/C][C]0.032529[/C][C]0.3548[/C][C]0.361667[/C][/ROW]
[ROW][C]33[/C][C]0.006395[/C][C]0.0698[/C][C]0.472249[/C][/ROW]
[ROW][C]34[/C][C]0.050122[/C][C]0.5468[/C][C]0.29278[/C][/ROW]
[ROW][C]35[/C][C]0.011544[/C][C]0.1259[/C][C]0.449998[/C][/ROW]
[ROW][C]36[/C][C]-0.065549[/C][C]-0.7151[/C][C]0.237988[/C][/ROW]
[ROW][C]37[/C][C]-0.057206[/C][C]-0.624[/C][C]0.266898[/C][/ROW]
[ROW][C]38[/C][C]-0.020567[/C][C]-0.2244[/C][C]0.41143[/C][/ROW]
[ROW][C]39[/C][C]-0.016994[/C][C]-0.1854[/C][C]0.426622[/C][/ROW]
[ROW][C]40[/C][C]0.021808[/C][C]0.2379[/C][C]0.406183[/C][/ROW]
[ROW][C]41[/C][C]-0.029211[/C][C]-0.3187[/C][C]0.375272[/C][/ROW]
[ROW][C]42[/C][C]-0.00739[/C][C]-0.0806[/C][C]0.46794[/C][/ROW]
[ROW][C]43[/C][C]0.065233[/C][C]0.7116[/C][C]0.239052[/C][/ROW]
[ROW][C]44[/C][C]-0.001472[/C][C]-0.0161[/C][C]0.493608[/C][/ROW]
[ROW][C]45[/C][C]-0.098405[/C][C]-1.0735[/C][C]0.142615[/C][/ROW]
[ROW][C]46[/C][C]0.010143[/C][C]0.1107[/C][C]0.45604[/C][/ROW]
[ROW][C]47[/C][C]0.005243[/C][C]0.0572[/C][C]0.477245[/C][/ROW]
[ROW][C]48[/C][C]-0.02503[/C][C]-0.273[/C][C]0.392644[/C][/ROW]
[/TABLE]
Source: https://freestatistics.org/blog/index.php?pk=210978&T=2

Globally Unique Identifier (entire table): ba.freestatistics.org/blog/index.php?pk=210978&T=2

As an alternative you can also use a QR Code:  

The GUIDs for individual cells are displayed in the table below:

Partial Autocorrelation Function
Time lag kPACF(k)T-STATP-value
1-0.014628-0.15960.436746
20.0262330.28620.387622
30.0018880.02060.491803
4-0.088324-0.96350.168626
5-0.00075-0.00820.496745
6-0.361188-3.94016.9e-05
70.0266980.29120.385687
8-0.1439-1.56980.059563
9-0.027005-0.29460.384412
10-0.110666-1.20720.114871
110.0023990.02620.489583
120.7698338.39790
130.0390940.42650.33527
14-0.157368-1.71670.04432
150.0358490.39110.348225
160.0104580.11410.45468
17-0.012306-0.13420.446721
180.1507171.64410.051395
19-0.13113-1.43050.077602
200.0779150.850.198528
210.0041510.04530.481977
22-0.009724-0.10610.45785
230.0163750.17860.429266
24-0.031501-0.34360.365863
250.0572210.62420.266842
260.0271350.2960.383869
27-0.078098-0.85190.197978
280.0477130.52050.301845
29-0.046966-0.51230.30468
30-0.011935-0.13020.448314
31-0.014164-0.15450.438733
320.0325290.35480.361667
330.0063950.06980.472249
340.0501220.54680.29278
350.0115440.12590.449998
36-0.065549-0.71510.237988
37-0.057206-0.6240.266898
38-0.020567-0.22440.41143
39-0.016994-0.18540.426622
400.0218080.23790.406183
41-0.029211-0.31870.375272
42-0.00739-0.08060.46794
430.0652330.71160.239052
44-0.001472-0.01610.493608
45-0.098405-1.07350.142615
460.0101430.11070.45604
470.0052430.05720.477245
48-0.02503-0.2730.392644


Parameters (Session):
par1 = 48 ; par2 = 1 ; par3 = 1 ; par4 = 0 ; par5 = 12 ; par6 = White Noise ; par7 = 0.95 ;
Parameters (R input):
par1 = 48 ; par2 = 1 ; par3 = 1 ; par4 = 0 ; par5 = 12 ; par6 = White Noise ; par7 = 0.95 ; par8 = ;
R code (references can be found in the software module):
if (par1 == 'Default') {
par1 = 10*log10(length(x))
} else {
par1 <- as.numeric(par1)
}
par2 <- as.numeric(par2)
par3 <- as.numeric(par3)
par4 <- as.numeric(par4)
par5 <- as.numeric(par5)
if (par6 == 'White Noise') par6 <- 'white' else par6 <- 'ma'
par7 <- as.numeric(par7)
if (par8 != '') par8 <- as.numeric(par8)
ox <- x
if (par8 == '') {
if (par2 == 0) {
x <- log(x)
} else {
x <- (x ^ par2 - 1) / par2
}
} else {
x <- log(x,base=par8)
}
if (par3 > 0) x <- diff(x,lag=1,difference=par3)
if (par4 > 0) x <- diff(x,lag=par5,difference=par4)
bitmap(file='picts.png')
op <- par(mfrow=c(2,1))
plot(ox,type='l',main='Original Time Series',xlab='time',ylab='value')
if (par8=='') {
mytitle <- paste('Working Time Series (lambda=',par2,', d=',par3,', D=',par4,')',sep='')
mysub <- paste('(lambda=',par2,', d=',par3,', D=',par4,', CI=', par7, ', CI type=',par6,')',sep='')
} else {
mytitle <- paste('Working Time Series (base=',par8,', d=',par3,', D=',par4,')',sep='')
mysub <- paste('(base=',par8,', d=',par3,', D=',par4,', CI=', par7, ', CI type=',par6,')',sep='')
}
plot(x,type='l', main=mytitle,xlab='time',ylab='value')
par(op)
dev.off()
bitmap(file='pic1.png')
racf <- acf(x, par1, main='Autocorrelation', xlab='time lag', ylab='ACF', ci.type=par6, ci=par7, sub=mysub)
dev.off()
bitmap(file='pic2.png')
rpacf <- pacf(x,par1,main='Partial Autocorrelation',xlab='lags',ylab='PACF',sub=mysub)
dev.off()
(myacf <- c(racf$acf))
(mypacf <- c(rpacf$acf))
lengthx <- length(x)
sqrtn <- sqrt(lengthx)
load(file='createtable')
a<-table.start()
a<-table.row.start(a)
a<-table.element(a,'Autocorrelation Function',4,TRUE)
a<-table.row.end(a)
a<-table.row.start(a)
a<-table.element(a,'Time lag k',header=TRUE)
a<-table.element(a,hyperlink('basics.htm','ACF(k)','click here for more information about the Autocorrelation Function'),header=TRUE)
a<-table.element(a,'T-STAT',header=TRUE)
a<-table.element(a,'P-value',header=TRUE)
a<-table.row.end(a)
for (i in 2:(par1+1)) {
a<-table.row.start(a)
a<-table.element(a,i-1,header=TRUE)
a<-table.element(a,round(myacf[i],6))
mytstat <- myacf[i]*sqrtn
a<-table.element(a,round(mytstat,4))
a<-table.element(a,round(1-pt(abs(mytstat),lengthx),6))
a<-table.row.end(a)
}
a<-table.end(a)
table.save(a,file='mytable.tab')
a<-table.start()
a<-table.row.start(a)
a<-table.element(a,'Partial Autocorrelation Function',4,TRUE)
a<-table.row.end(a)
a<-table.row.start(a)
a<-table.element(a,'Time lag k',header=TRUE)
a<-table.element(a,hyperlink('basics.htm','PACF(k)','click here for more information about the Partial Autocorrelation Function'),header=TRUE)
a<-table.element(a,'T-STAT',header=TRUE)
a<-table.element(a,'P-value',header=TRUE)
a<-table.row.end(a)
for (i in 1:par1) {
a<-table.row.start(a)
a<-table.element(a,i,header=TRUE)
a<-table.element(a,round(mypacf[i],6))
mytstat <- mypacf[i]*sqrtn
a<-table.element(a,round(mytstat,4))
a<-table.element(a,round(1-pt(abs(mytstat),lengthx),6))
a<-table.row.end(a)
}
a<-table.end(a)
table.save(a,file='mytable1.tab')