Free Statistics

of Irreproducible Research!

Author's title

Author*Unverified author*
R Software Modulerwasp_autocorrelation.wasp
Title produced by software(Partial) Autocorrelation Function
Date of computationThu, 08 Aug 2013 07:35:59 -0400
Cite this page as followsStatistical Computations at FreeStatistics.org, Office for Research Development and Education, URL https://freestatistics.org/blog/index.php?v=date/2013/Aug/08/t1375961772i3n5bco38xu7s6r.htm/, Retrieved Mon, 29 Apr 2024 11:56:56 +0000
Statistical Computations at FreeStatistics.org, Office for Research Development and Education, URL https://freestatistics.org/blog/index.php?pk=210997, Retrieved Mon, 29 Apr 2024 11:56:56 +0000
QR Codes:

Original text written by user:
IsPrivate?No (this computation is public)
User-defined keywordsNick Hollevoet
Estimated Impact187
Family? (F = Feedback message, R = changed R code, M = changed R Module, P = changed Parameters, D = changed Data)
-       [(Partial) Autocorrelation Function] [TIJDREEKS (B) - S...] [2013-08-08 11:35:59] [3f9aa5867cfe47c4a12580af2904c765] [Current]
Feedback Forum

Post a new message
Dataseries X:
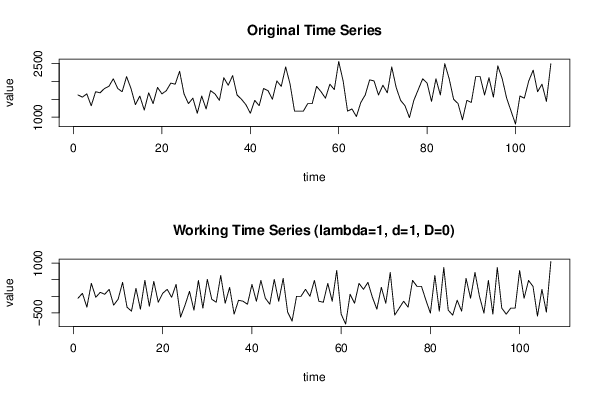
1620
1560
1650
1320
1710
1680
1800
1860
2070
1800
1710
2130
1800
1350
1590
1200
1680
1380
1830
1650
1740
1950
1920
2280
1650
1380
1530
1110
1590
1230
1740
1650
1470
2100
1890
2160
1620
1500
1350
1110
1470
1320
1800
1740
1500
2010
1860
2400
1920
1170
1170
1170
1380
1380
1860
1710
1530
1920
1770
2550
2010
1170
1230
1020
1410
1620
2040
2010
1620
1890
1680
2400
1830
1470
1320
990
1470
1770
2070
1950
1440
2070
1620
2490
2070
1500
1380
930
1470
1410
2130
2130
1620
2100
1560
2430
2070
1530
1170
810
1590
1530
2010
2310
1710
1920
1440
2490


Summary of computational transaction
Raw Inputview raw input (R code)
Raw Outputview raw output of R engine
Computing time4 seconds
R Server'Gertrude Mary Cox' @ cox.wessa.net

\begin{tabular}{lllllllll}
\hline
Summary of computational transaction \tabularnewline
Raw Input & view raw input (R code)  \tabularnewline
Raw Output & view raw output of R engine  \tabularnewline
Computing time & 4 seconds \tabularnewline
R Server & 'Gertrude Mary Cox' @ cox.wessa.net \tabularnewline
\hline
\end{tabular}
%Source: https://freestatistics.org/blog/index.php?pk=210997&T=0

[TABLE]
[ROW][C]Summary of computational transaction[/C][/ROW]
[ROW][C]Raw Input[/C][C]view raw input (R code) [/C][/ROW]
[ROW][C]Raw Output[/C][C]view raw output of R engine [/C][/ROW]
[ROW][C]Computing time[/C][C]4 seconds[/C][/ROW]
[ROW][C]R Server[/C][C]'Gertrude Mary Cox' @ cox.wessa.net[/C][/ROW]
[/TABLE]
Source: https://freestatistics.org/blog/index.php?pk=210997&T=0

Globally Unique Identifier (entire table): ba.freestatistics.org/blog/index.php?pk=210997&T=0

As an alternative you can also use a QR Code:  

The GUIDs for individual cells are displayed in the table below:

Summary of computational transaction
Raw Inputview raw input (R code)
Raw Outputview raw output of R engine
Computing time4 seconds
R Server'Gertrude Mary Cox' @ cox.wessa.net


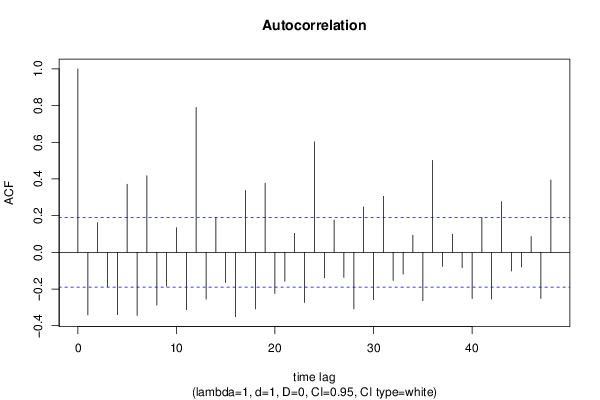
Autocorrelation Function
Time lag kACF(k)T-STATP-value
1-0.34099-3.52720.00031
20.1611711.66720.049203
3-0.187224-1.93670.027712
4-0.339596-3.51280.000325
50.3709553.83720.000105
6-0.34395-3.55780.000279
70.4181114.3251.7e-05
8-0.287596-2.97490.001811
9-0.184079-1.90410.02979
100.1344191.39040.083641
11-0.313093-3.23878e-04
120.7895528.16720
13-0.255181-2.63960.00477
140.1906571.97220.025585
15-0.164844-1.70520.045533
16-0.350569-3.62630.000221
170.3377353.49360.000347
18-0.308274-3.18880.000937
190.3765073.89468.6e-05
20-0.224228-2.31940.011135
21-0.157817-1.63250.05276
220.1035141.07080.143344
23-0.273867-2.83290.002757
240.6024246.23150
25-0.138764-1.43540.077048
260.1768421.82930.035072
27-0.136543-1.41240.080366
28-0.308312-3.18920.000936
290.2472632.55770.005968
30-0.257776-2.66650.004428
310.3053563.15860.00103
32-0.153114-1.58380.058093
33-0.118564-1.22640.111363
340.0930660.96270.168939
35-0.263403-2.72470.00376
360.5013685.18621e-06
37-0.076549-0.79180.215107
380.0989851.02390.154094
39-0.083705-0.86590.194254
40-0.251284-2.59930.00533
410.1909591.97530.025405
42-0.253929-2.62670.004944
430.276632.86150.002536
44-0.101626-1.05120.14776
45-0.079109-0.81830.2075
460.0858940.88850.188134
47-0.251043-2.59680.005366
480.3942864.07854.4e-05

\begin{tabular}{lllllllll}
\hline
Autocorrelation Function \tabularnewline
Time lag k & ACF(k) & T-STAT & P-value \tabularnewline
1 & -0.34099 & -3.5272 & 0.00031 \tabularnewline
2 & 0.161171 & 1.6672 & 0.049203 \tabularnewline
3 & -0.187224 & -1.9367 & 0.027712 \tabularnewline
4 & -0.339596 & -3.5128 & 0.000325 \tabularnewline
5 & 0.370955 & 3.8372 & 0.000105 \tabularnewline
6 & -0.34395 & -3.5578 & 0.000279 \tabularnewline
7 & 0.418111 & 4.325 & 1.7e-05 \tabularnewline
8 & -0.287596 & -2.9749 & 0.001811 \tabularnewline
9 & -0.184079 & -1.9041 & 0.02979 \tabularnewline
10 & 0.134419 & 1.3904 & 0.083641 \tabularnewline
11 & -0.313093 & -3.2387 & 8e-04 \tabularnewline
12 & 0.789552 & 8.1672 & 0 \tabularnewline
13 & -0.255181 & -2.6396 & 0.00477 \tabularnewline
14 & 0.190657 & 1.9722 & 0.025585 \tabularnewline
15 & -0.164844 & -1.7052 & 0.045533 \tabularnewline
16 & -0.350569 & -3.6263 & 0.000221 \tabularnewline
17 & 0.337735 & 3.4936 & 0.000347 \tabularnewline
18 & -0.308274 & -3.1888 & 0.000937 \tabularnewline
19 & 0.376507 & 3.8946 & 8.6e-05 \tabularnewline
20 & -0.224228 & -2.3194 & 0.011135 \tabularnewline
21 & -0.157817 & -1.6325 & 0.05276 \tabularnewline
22 & 0.103514 & 1.0708 & 0.143344 \tabularnewline
23 & -0.273867 & -2.8329 & 0.002757 \tabularnewline
24 & 0.602424 & 6.2315 & 0 \tabularnewline
25 & -0.138764 & -1.4354 & 0.077048 \tabularnewline
26 & 0.176842 & 1.8293 & 0.035072 \tabularnewline
27 & -0.136543 & -1.4124 & 0.080366 \tabularnewline
28 & -0.308312 & -3.1892 & 0.000936 \tabularnewline
29 & 0.247263 & 2.5577 & 0.005968 \tabularnewline
30 & -0.257776 & -2.6665 & 0.004428 \tabularnewline
31 & 0.305356 & 3.1586 & 0.00103 \tabularnewline
32 & -0.153114 & -1.5838 & 0.058093 \tabularnewline
33 & -0.118564 & -1.2264 & 0.111363 \tabularnewline
34 & 0.093066 & 0.9627 & 0.168939 \tabularnewline
35 & -0.263403 & -2.7247 & 0.00376 \tabularnewline
36 & 0.501368 & 5.1862 & 1e-06 \tabularnewline
37 & -0.076549 & -0.7918 & 0.215107 \tabularnewline
38 & 0.098985 & 1.0239 & 0.154094 \tabularnewline
39 & -0.083705 & -0.8659 & 0.194254 \tabularnewline
40 & -0.251284 & -2.5993 & 0.00533 \tabularnewline
41 & 0.190959 & 1.9753 & 0.025405 \tabularnewline
42 & -0.253929 & -2.6267 & 0.004944 \tabularnewline
43 & 0.27663 & 2.8615 & 0.002536 \tabularnewline
44 & -0.101626 & -1.0512 & 0.14776 \tabularnewline
45 & -0.079109 & -0.8183 & 0.2075 \tabularnewline
46 & 0.085894 & 0.8885 & 0.188134 \tabularnewline
47 & -0.251043 & -2.5968 & 0.005366 \tabularnewline
48 & 0.394286 & 4.0785 & 4.4e-05 \tabularnewline
\hline
\end{tabular}
%Source: https://freestatistics.org/blog/index.php?pk=210997&T=1

[TABLE]
[ROW][C]Autocorrelation Function[/C][/ROW]
[ROW][C]Time lag k[/C][C]ACF(k)[/C][C]T-STAT[/C][C]P-value[/C][/ROW]
[ROW][C]1[/C][C]-0.34099[/C][C]-3.5272[/C][C]0.00031[/C][/ROW]
[ROW][C]2[/C][C]0.161171[/C][C]1.6672[/C][C]0.049203[/C][/ROW]
[ROW][C]3[/C][C]-0.187224[/C][C]-1.9367[/C][C]0.027712[/C][/ROW]
[ROW][C]4[/C][C]-0.339596[/C][C]-3.5128[/C][C]0.000325[/C][/ROW]
[ROW][C]5[/C][C]0.370955[/C][C]3.8372[/C][C]0.000105[/C][/ROW]
[ROW][C]6[/C][C]-0.34395[/C][C]-3.5578[/C][C]0.000279[/C][/ROW]
[ROW][C]7[/C][C]0.418111[/C][C]4.325[/C][C]1.7e-05[/C][/ROW]
[ROW][C]8[/C][C]-0.287596[/C][C]-2.9749[/C][C]0.001811[/C][/ROW]
[ROW][C]9[/C][C]-0.184079[/C][C]-1.9041[/C][C]0.02979[/C][/ROW]
[ROW][C]10[/C][C]0.134419[/C][C]1.3904[/C][C]0.083641[/C][/ROW]
[ROW][C]11[/C][C]-0.313093[/C][C]-3.2387[/C][C]8e-04[/C][/ROW]
[ROW][C]12[/C][C]0.789552[/C][C]8.1672[/C][C]0[/C][/ROW]
[ROW][C]13[/C][C]-0.255181[/C][C]-2.6396[/C][C]0.00477[/C][/ROW]
[ROW][C]14[/C][C]0.190657[/C][C]1.9722[/C][C]0.025585[/C][/ROW]
[ROW][C]15[/C][C]-0.164844[/C][C]-1.7052[/C][C]0.045533[/C][/ROW]
[ROW][C]16[/C][C]-0.350569[/C][C]-3.6263[/C][C]0.000221[/C][/ROW]
[ROW][C]17[/C][C]0.337735[/C][C]3.4936[/C][C]0.000347[/C][/ROW]
[ROW][C]18[/C][C]-0.308274[/C][C]-3.1888[/C][C]0.000937[/C][/ROW]
[ROW][C]19[/C][C]0.376507[/C][C]3.8946[/C][C]8.6e-05[/C][/ROW]
[ROW][C]20[/C][C]-0.224228[/C][C]-2.3194[/C][C]0.011135[/C][/ROW]
[ROW][C]21[/C][C]-0.157817[/C][C]-1.6325[/C][C]0.05276[/C][/ROW]
[ROW][C]22[/C][C]0.103514[/C][C]1.0708[/C][C]0.143344[/C][/ROW]
[ROW][C]23[/C][C]-0.273867[/C][C]-2.8329[/C][C]0.002757[/C][/ROW]
[ROW][C]24[/C][C]0.602424[/C][C]6.2315[/C][C]0[/C][/ROW]
[ROW][C]25[/C][C]-0.138764[/C][C]-1.4354[/C][C]0.077048[/C][/ROW]
[ROW][C]26[/C][C]0.176842[/C][C]1.8293[/C][C]0.035072[/C][/ROW]
[ROW][C]27[/C][C]-0.136543[/C][C]-1.4124[/C][C]0.080366[/C][/ROW]
[ROW][C]28[/C][C]-0.308312[/C][C]-3.1892[/C][C]0.000936[/C][/ROW]
[ROW][C]29[/C][C]0.247263[/C][C]2.5577[/C][C]0.005968[/C][/ROW]
[ROW][C]30[/C][C]-0.257776[/C][C]-2.6665[/C][C]0.004428[/C][/ROW]
[ROW][C]31[/C][C]0.305356[/C][C]3.1586[/C][C]0.00103[/C][/ROW]
[ROW][C]32[/C][C]-0.153114[/C][C]-1.5838[/C][C]0.058093[/C][/ROW]
[ROW][C]33[/C][C]-0.118564[/C][C]-1.2264[/C][C]0.111363[/C][/ROW]
[ROW][C]34[/C][C]0.093066[/C][C]0.9627[/C][C]0.168939[/C][/ROW]
[ROW][C]35[/C][C]-0.263403[/C][C]-2.7247[/C][C]0.00376[/C][/ROW]
[ROW][C]36[/C][C]0.501368[/C][C]5.1862[/C][C]1e-06[/C][/ROW]
[ROW][C]37[/C][C]-0.076549[/C][C]-0.7918[/C][C]0.215107[/C][/ROW]
[ROW][C]38[/C][C]0.098985[/C][C]1.0239[/C][C]0.154094[/C][/ROW]
[ROW][C]39[/C][C]-0.083705[/C][C]-0.8659[/C][C]0.194254[/C][/ROW]
[ROW][C]40[/C][C]-0.251284[/C][C]-2.5993[/C][C]0.00533[/C][/ROW]
[ROW][C]41[/C][C]0.190959[/C][C]1.9753[/C][C]0.025405[/C][/ROW]
[ROW][C]42[/C][C]-0.253929[/C][C]-2.6267[/C][C]0.004944[/C][/ROW]
[ROW][C]43[/C][C]0.27663[/C][C]2.8615[/C][C]0.002536[/C][/ROW]
[ROW][C]44[/C][C]-0.101626[/C][C]-1.0512[/C][C]0.14776[/C][/ROW]
[ROW][C]45[/C][C]-0.079109[/C][C]-0.8183[/C][C]0.2075[/C][/ROW]
[ROW][C]46[/C][C]0.085894[/C][C]0.8885[/C][C]0.188134[/C][/ROW]
[ROW][C]47[/C][C]-0.251043[/C][C]-2.5968[/C][C]0.005366[/C][/ROW]
[ROW][C]48[/C][C]0.394286[/C][C]4.0785[/C][C]4.4e-05[/C][/ROW]
[/TABLE]
Source: https://freestatistics.org/blog/index.php?pk=210997&T=1

Globally Unique Identifier (entire table): ba.freestatistics.org/blog/index.php?pk=210997&T=1

As an alternative you can also use a QR Code:  

The GUIDs for individual cells are displayed in the table below:

Autocorrelation Function
Time lag kACF(k)T-STATP-value
1-0.34099-3.52720.00031
20.1611711.66720.049203
3-0.187224-1.93670.027712
4-0.339596-3.51280.000325
50.3709553.83720.000105
6-0.34395-3.55780.000279
70.4181114.3251.7e-05
8-0.287596-2.97490.001811
9-0.184079-1.90410.02979
100.1344191.39040.083641
11-0.313093-3.23878e-04
120.7895528.16720
13-0.255181-2.63960.00477
140.1906571.97220.025585
15-0.164844-1.70520.045533
16-0.350569-3.62630.000221
170.3377353.49360.000347
18-0.308274-3.18880.000937
190.3765073.89468.6e-05
20-0.224228-2.31940.011135
21-0.157817-1.63250.05276
220.1035141.07080.143344
23-0.273867-2.83290.002757
240.6024246.23150
25-0.138764-1.43540.077048
260.1768421.82930.035072
27-0.136543-1.41240.080366
28-0.308312-3.18920.000936
290.2472632.55770.005968
30-0.257776-2.66650.004428
310.3053563.15860.00103
32-0.153114-1.58380.058093
33-0.118564-1.22640.111363
340.0930660.96270.168939
35-0.263403-2.72470.00376
360.5013685.18621e-06
37-0.076549-0.79180.215107
380.0989851.02390.154094
39-0.083705-0.86590.194254
40-0.251284-2.59930.00533
410.1909591.97530.025405
42-0.253929-2.62670.004944
430.276632.86150.002536
44-0.101626-1.05120.14776
45-0.079109-0.81830.2075
460.0858940.88850.188134
47-0.251043-2.59680.005366
480.3942864.07854.4e-05


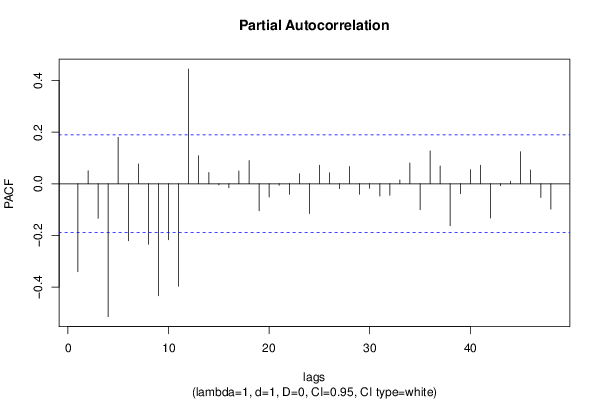
Partial Autocorrelation Function
Time lag kPACF(k)T-STATP-value
1-0.34099-3.52720.00031
20.0508040.52550.300154
3-0.13357-1.38170.084977
4-0.514821-5.32530
50.1798151.860.032814
6-0.220958-2.28560.012124
70.0767560.7940.214484
8-0.234549-2.42620.008465
9-0.434093-4.49039e-06
10-0.217-2.24470.013423
11-0.396937-4.10593.9e-05
120.4450364.60356e-06
130.1086521.12390.131784
140.0436250.45130.326357
15-0.004306-0.04450.48228
16-0.015357-0.15890.43704
170.0497710.51480.303866
180.0897240.92810.17772
19-0.104654-1.08250.140722
20-0.051051-0.52810.299269
21-0.005491-0.05680.477404
22-0.041122-0.42540.335712
230.039510.40870.34179
24-0.115361-1.19330.117694
250.0722250.74710.22832
260.0430090.44490.328649
27-0.018901-0.19550.422681
280.0667360.69030.245744
29-0.040516-0.41910.33799
30-0.017416-0.18020.428685
31-0.047433-0.49060.31234
32-0.044357-0.45880.323643
330.0145530.15050.44031
340.0806490.83420.203003
35-0.100601-1.04060.150197
360.1274541.31840.095094
370.0688680.71240.23889
38-0.162689-1.68290.047658
39-0.038458-0.39780.345782
400.0542420.56110.287955
410.0718620.74340.229449
42-0.132689-1.37260.086381
43-0.007348-0.0760.469775
440.00960.09930.46054
450.1240141.28280.101164
460.0532380.55070.291493
47-0.053355-0.55190.291083
48-0.098084-1.01460.156296

\begin{tabular}{lllllllll}
\hline
Partial Autocorrelation Function \tabularnewline
Time lag k & PACF(k) & T-STAT & P-value \tabularnewline
1 & -0.34099 & -3.5272 & 0.00031 \tabularnewline
2 & 0.050804 & 0.5255 & 0.300154 \tabularnewline
3 & -0.13357 & -1.3817 & 0.084977 \tabularnewline
4 & -0.514821 & -5.3253 & 0 \tabularnewline
5 & 0.179815 & 1.86 & 0.032814 \tabularnewline
6 & -0.220958 & -2.2856 & 0.012124 \tabularnewline
7 & 0.076756 & 0.794 & 0.214484 \tabularnewline
8 & -0.234549 & -2.4262 & 0.008465 \tabularnewline
9 & -0.434093 & -4.4903 & 9e-06 \tabularnewline
10 & -0.217 & -2.2447 & 0.013423 \tabularnewline
11 & -0.396937 & -4.1059 & 3.9e-05 \tabularnewline
12 & 0.445036 & 4.6035 & 6e-06 \tabularnewline
13 & 0.108652 & 1.1239 & 0.131784 \tabularnewline
14 & 0.043625 & 0.4513 & 0.326357 \tabularnewline
15 & -0.004306 & -0.0445 & 0.48228 \tabularnewline
16 & -0.015357 & -0.1589 & 0.43704 \tabularnewline
17 & 0.049771 & 0.5148 & 0.303866 \tabularnewline
18 & 0.089724 & 0.9281 & 0.17772 \tabularnewline
19 & -0.104654 & -1.0825 & 0.140722 \tabularnewline
20 & -0.051051 & -0.5281 & 0.299269 \tabularnewline
21 & -0.005491 & -0.0568 & 0.477404 \tabularnewline
22 & -0.041122 & -0.4254 & 0.335712 \tabularnewline
23 & 0.03951 & 0.4087 & 0.34179 \tabularnewline
24 & -0.115361 & -1.1933 & 0.117694 \tabularnewline
25 & 0.072225 & 0.7471 & 0.22832 \tabularnewline
26 & 0.043009 & 0.4449 & 0.328649 \tabularnewline
27 & -0.018901 & -0.1955 & 0.422681 \tabularnewline
28 & 0.066736 & 0.6903 & 0.245744 \tabularnewline
29 & -0.040516 & -0.4191 & 0.33799 \tabularnewline
30 & -0.017416 & -0.1802 & 0.428685 \tabularnewline
31 & -0.047433 & -0.4906 & 0.31234 \tabularnewline
32 & -0.044357 & -0.4588 & 0.323643 \tabularnewline
33 & 0.014553 & 0.1505 & 0.44031 \tabularnewline
34 & 0.080649 & 0.8342 & 0.203003 \tabularnewline
35 & -0.100601 & -1.0406 & 0.150197 \tabularnewline
36 & 0.127454 & 1.3184 & 0.095094 \tabularnewline
37 & 0.068868 & 0.7124 & 0.23889 \tabularnewline
38 & -0.162689 & -1.6829 & 0.047658 \tabularnewline
39 & -0.038458 & -0.3978 & 0.345782 \tabularnewline
40 & 0.054242 & 0.5611 & 0.287955 \tabularnewline
41 & 0.071862 & 0.7434 & 0.229449 \tabularnewline
42 & -0.132689 & -1.3726 & 0.086381 \tabularnewline
43 & -0.007348 & -0.076 & 0.469775 \tabularnewline
44 & 0.0096 & 0.0993 & 0.46054 \tabularnewline
45 & 0.124014 & 1.2828 & 0.101164 \tabularnewline
46 & 0.053238 & 0.5507 & 0.291493 \tabularnewline
47 & -0.053355 & -0.5519 & 0.291083 \tabularnewline
48 & -0.098084 & -1.0146 & 0.156296 \tabularnewline
\hline
\end{tabular}
%Source: https://freestatistics.org/blog/index.php?pk=210997&T=2

[TABLE]
[ROW][C]Partial Autocorrelation Function[/C][/ROW]
[ROW][C]Time lag k[/C][C]PACF(k)[/C][C]T-STAT[/C][C]P-value[/C][/ROW]
[ROW][C]1[/C][C]-0.34099[/C][C]-3.5272[/C][C]0.00031[/C][/ROW]
[ROW][C]2[/C][C]0.050804[/C][C]0.5255[/C][C]0.300154[/C][/ROW]
[ROW][C]3[/C][C]-0.13357[/C][C]-1.3817[/C][C]0.084977[/C][/ROW]
[ROW][C]4[/C][C]-0.514821[/C][C]-5.3253[/C][C]0[/C][/ROW]
[ROW][C]5[/C][C]0.179815[/C][C]1.86[/C][C]0.032814[/C][/ROW]
[ROW][C]6[/C][C]-0.220958[/C][C]-2.2856[/C][C]0.012124[/C][/ROW]
[ROW][C]7[/C][C]0.076756[/C][C]0.794[/C][C]0.214484[/C][/ROW]
[ROW][C]8[/C][C]-0.234549[/C][C]-2.4262[/C][C]0.008465[/C][/ROW]
[ROW][C]9[/C][C]-0.434093[/C][C]-4.4903[/C][C]9e-06[/C][/ROW]
[ROW][C]10[/C][C]-0.217[/C][C]-2.2447[/C][C]0.013423[/C][/ROW]
[ROW][C]11[/C][C]-0.396937[/C][C]-4.1059[/C][C]3.9e-05[/C][/ROW]
[ROW][C]12[/C][C]0.445036[/C][C]4.6035[/C][C]6e-06[/C][/ROW]
[ROW][C]13[/C][C]0.108652[/C][C]1.1239[/C][C]0.131784[/C][/ROW]
[ROW][C]14[/C][C]0.043625[/C][C]0.4513[/C][C]0.326357[/C][/ROW]
[ROW][C]15[/C][C]-0.004306[/C][C]-0.0445[/C][C]0.48228[/C][/ROW]
[ROW][C]16[/C][C]-0.015357[/C][C]-0.1589[/C][C]0.43704[/C][/ROW]
[ROW][C]17[/C][C]0.049771[/C][C]0.5148[/C][C]0.303866[/C][/ROW]
[ROW][C]18[/C][C]0.089724[/C][C]0.9281[/C][C]0.17772[/C][/ROW]
[ROW][C]19[/C][C]-0.104654[/C][C]-1.0825[/C][C]0.140722[/C][/ROW]
[ROW][C]20[/C][C]-0.051051[/C][C]-0.5281[/C][C]0.299269[/C][/ROW]
[ROW][C]21[/C][C]-0.005491[/C][C]-0.0568[/C][C]0.477404[/C][/ROW]
[ROW][C]22[/C][C]-0.041122[/C][C]-0.4254[/C][C]0.335712[/C][/ROW]
[ROW][C]23[/C][C]0.03951[/C][C]0.4087[/C][C]0.34179[/C][/ROW]
[ROW][C]24[/C][C]-0.115361[/C][C]-1.1933[/C][C]0.117694[/C][/ROW]
[ROW][C]25[/C][C]0.072225[/C][C]0.7471[/C][C]0.22832[/C][/ROW]
[ROW][C]26[/C][C]0.043009[/C][C]0.4449[/C][C]0.328649[/C][/ROW]
[ROW][C]27[/C][C]-0.018901[/C][C]-0.1955[/C][C]0.422681[/C][/ROW]
[ROW][C]28[/C][C]0.066736[/C][C]0.6903[/C][C]0.245744[/C][/ROW]
[ROW][C]29[/C][C]-0.040516[/C][C]-0.4191[/C][C]0.33799[/C][/ROW]
[ROW][C]30[/C][C]-0.017416[/C][C]-0.1802[/C][C]0.428685[/C][/ROW]
[ROW][C]31[/C][C]-0.047433[/C][C]-0.4906[/C][C]0.31234[/C][/ROW]
[ROW][C]32[/C][C]-0.044357[/C][C]-0.4588[/C][C]0.323643[/C][/ROW]
[ROW][C]33[/C][C]0.014553[/C][C]0.1505[/C][C]0.44031[/C][/ROW]
[ROW][C]34[/C][C]0.080649[/C][C]0.8342[/C][C]0.203003[/C][/ROW]
[ROW][C]35[/C][C]-0.100601[/C][C]-1.0406[/C][C]0.150197[/C][/ROW]
[ROW][C]36[/C][C]0.127454[/C][C]1.3184[/C][C]0.095094[/C][/ROW]
[ROW][C]37[/C][C]0.068868[/C][C]0.7124[/C][C]0.23889[/C][/ROW]
[ROW][C]38[/C][C]-0.162689[/C][C]-1.6829[/C][C]0.047658[/C][/ROW]
[ROW][C]39[/C][C]-0.038458[/C][C]-0.3978[/C][C]0.345782[/C][/ROW]
[ROW][C]40[/C][C]0.054242[/C][C]0.5611[/C][C]0.287955[/C][/ROW]
[ROW][C]41[/C][C]0.071862[/C][C]0.7434[/C][C]0.229449[/C][/ROW]
[ROW][C]42[/C][C]-0.132689[/C][C]-1.3726[/C][C]0.086381[/C][/ROW]
[ROW][C]43[/C][C]-0.007348[/C][C]-0.076[/C][C]0.469775[/C][/ROW]
[ROW][C]44[/C][C]0.0096[/C][C]0.0993[/C][C]0.46054[/C][/ROW]
[ROW][C]45[/C][C]0.124014[/C][C]1.2828[/C][C]0.101164[/C][/ROW]
[ROW][C]46[/C][C]0.053238[/C][C]0.5507[/C][C]0.291493[/C][/ROW]
[ROW][C]47[/C][C]-0.053355[/C][C]-0.5519[/C][C]0.291083[/C][/ROW]
[ROW][C]48[/C][C]-0.098084[/C][C]-1.0146[/C][C]0.156296[/C][/ROW]
[/TABLE]
Source: https://freestatistics.org/blog/index.php?pk=210997&T=2

Globally Unique Identifier (entire table): ba.freestatistics.org/blog/index.php?pk=210997&T=2

As an alternative you can also use a QR Code:  

The GUIDs for individual cells are displayed in the table below:

Partial Autocorrelation Function
Time lag kPACF(k)T-STATP-value
1-0.34099-3.52720.00031
20.0508040.52550.300154
3-0.13357-1.38170.084977
4-0.514821-5.32530
50.1798151.860.032814
6-0.220958-2.28560.012124
70.0767560.7940.214484
8-0.234549-2.42620.008465
9-0.434093-4.49039e-06
10-0.217-2.24470.013423
11-0.396937-4.10593.9e-05
120.4450364.60356e-06
130.1086521.12390.131784
140.0436250.45130.326357
15-0.004306-0.04450.48228
16-0.015357-0.15890.43704
170.0497710.51480.303866
180.0897240.92810.17772
19-0.104654-1.08250.140722
20-0.051051-0.52810.299269
21-0.005491-0.05680.477404
22-0.041122-0.42540.335712
230.039510.40870.34179
24-0.115361-1.19330.117694
250.0722250.74710.22832
260.0430090.44490.328649
27-0.018901-0.19550.422681
280.0667360.69030.245744
29-0.040516-0.41910.33799
30-0.017416-0.18020.428685
31-0.047433-0.49060.31234
32-0.044357-0.45880.323643
330.0145530.15050.44031
340.0806490.83420.203003
35-0.100601-1.04060.150197
360.1274541.31840.095094
370.0688680.71240.23889
38-0.162689-1.68290.047658
39-0.038458-0.39780.345782
400.0542420.56110.287955
410.0718620.74340.229449
42-0.132689-1.37260.086381
43-0.007348-0.0760.469775
440.00960.09930.46054
450.1240141.28280.101164
460.0532380.55070.291493
47-0.053355-0.55190.291083
48-0.098084-1.01460.156296


Parameters (Session):
par1 = 48 ; par2 = 1 ; par3 = 1 ; par4 = 0 ; par5 = 12 ; par6 = White Noise ; par7 = 0.95 ;
Parameters (R input):
par1 = 48 ; par2 = 1 ; par3 = 1 ; par4 = 0 ; par5 = 12 ; par6 = White Noise ; par7 = 0.95 ; par8 = ;
R code (references can be found in the software module):
if (par1 == 'Default') {
par1 = 10*log10(length(x))
} else {
par1 <- as.numeric(par1)
}
par2 <- as.numeric(par2)
par3 <- as.numeric(par3)
par4 <- as.numeric(par4)
par5 <- as.numeric(par5)
if (par6 == 'White Noise') par6 <- 'white' else par6 <- 'ma'
par7 <- as.numeric(par7)
if (par8 != '') par8 <- as.numeric(par8)
ox <- x
if (par8 == '') {
if (par2 == 0) {
x <- log(x)
} else {
x <- (x ^ par2 - 1) / par2
}
} else {
x <- log(x,base=par8)
}
if (par3 > 0) x <- diff(x,lag=1,difference=par3)
if (par4 > 0) x <- diff(x,lag=par5,difference=par4)
bitmap(file='picts.png')
op <- par(mfrow=c(2,1))
plot(ox,type='l',main='Original Time Series',xlab='time',ylab='value')
if (par8=='') {
mytitle <- paste('Working Time Series (lambda=',par2,', d=',par3,', D=',par4,')',sep='')
mysub <- paste('(lambda=',par2,', d=',par3,', D=',par4,', CI=', par7, ', CI type=',par6,')',sep='')
} else {
mytitle <- paste('Working Time Series (base=',par8,', d=',par3,', D=',par4,')',sep='')
mysub <- paste('(base=',par8,', d=',par3,', D=',par4,', CI=', par7, ', CI type=',par6,')',sep='')
}
plot(x,type='l', main=mytitle,xlab='time',ylab='value')
par(op)
dev.off()
bitmap(file='pic1.png')
racf <- acf(x, par1, main='Autocorrelation', xlab='time lag', ylab='ACF', ci.type=par6, ci=par7, sub=mysub)
dev.off()
bitmap(file='pic2.png')
rpacf <- pacf(x,par1,main='Partial Autocorrelation',xlab='lags',ylab='PACF',sub=mysub)
dev.off()
(myacf <- c(racf$acf))
(mypacf <- c(rpacf$acf))
lengthx <- length(x)
sqrtn <- sqrt(lengthx)
load(file='createtable')
a<-table.start()
a<-table.row.start(a)
a<-table.element(a,'Autocorrelation Function',4,TRUE)
a<-table.row.end(a)
a<-table.row.start(a)
a<-table.element(a,'Time lag k',header=TRUE)
a<-table.element(a,hyperlink('basics.htm','ACF(k)','click here for more information about the Autocorrelation Function'),header=TRUE)
a<-table.element(a,'T-STAT',header=TRUE)
a<-table.element(a,'P-value',header=TRUE)
a<-table.row.end(a)
for (i in 2:(par1+1)) {
a<-table.row.start(a)
a<-table.element(a,i-1,header=TRUE)
a<-table.element(a,round(myacf[i],6))
mytstat <- myacf[i]*sqrtn
a<-table.element(a,round(mytstat,4))
a<-table.element(a,round(1-pt(abs(mytstat),lengthx),6))
a<-table.row.end(a)
}
a<-table.end(a)
table.save(a,file='mytable.tab')
a<-table.start()
a<-table.row.start(a)
a<-table.element(a,'Partial Autocorrelation Function',4,TRUE)
a<-table.row.end(a)
a<-table.row.start(a)
a<-table.element(a,'Time lag k',header=TRUE)
a<-table.element(a,hyperlink('basics.htm','PACF(k)','click here for more information about the Partial Autocorrelation Function'),header=TRUE)
a<-table.element(a,'T-STAT',header=TRUE)
a<-table.element(a,'P-value',header=TRUE)
a<-table.row.end(a)
for (i in 1:par1) {
a<-table.row.start(a)
a<-table.element(a,i,header=TRUE)
a<-table.element(a,round(mypacf[i],6))
mytstat <- mypacf[i]*sqrtn
a<-table.element(a,round(mytstat,4))
a<-table.element(a,round(1-pt(abs(mytstat),lengthx),6))
a<-table.row.end(a)
}
a<-table.end(a)
table.save(a,file='mytable1.tab')