Free Statistics

of Irreproducible Research!

Author's title

Author*Unverified author*
R Software Modulerwasp_smp.wasp
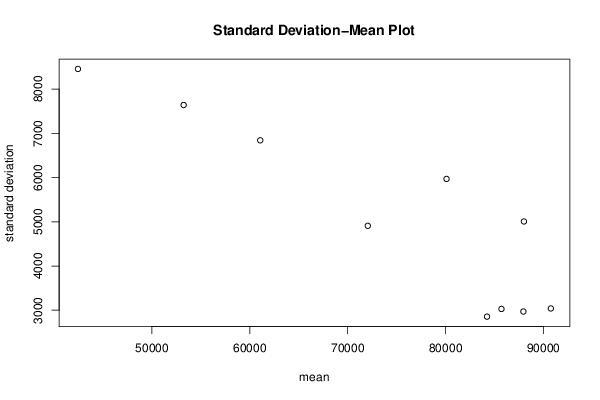
Title produced by softwareStandard Deviation-Mean Plot
Date of computationThu, 08 Aug 2013 10:09:38 -0400
Cite this page as followsStatistical Computations at FreeStatistics.org, Office for Research Development and Education, URL https://freestatistics.org/blog/index.php?v=date/2013/Aug/08/t13759710058o7c709xy8cbj25.htm/, Retrieved Mon, 29 Apr 2024 09:41:31 +0000
Statistical Computations at FreeStatistics.org, Office for Research Development and Education, URL https://freestatistics.org/blog/index.php?pk=211005, Retrieved Mon, 29 Apr 2024 09:41:31 +0000
QR Codes:

Original text written by user:
IsPrivate?No (this computation is public)
User-defined keywordsNick Hollevoet
Estimated Impact173
Family? (F = Feedback message, R = changed R code, M = changed R Module, P = changed Parameters, D = changed Data)
-       [Standard Deviation-Mean Plot] [TIJDREEKS (A) - S...] [2013-08-08 14:09:38] [3f9aa5867cfe47c4a12580af2904c765] [Current]
Feedback Forum

Post a new message
Dataseries X:
84728
84412
84092
83430
89981
89635
84728
81466
81781
81781
82133
82764
83746
83746
83115
81466
89981
91279
89319
84728
86692
83746
85075
85710
86372
84728
85075
82764
89981
92261
90301
86692
90617
86372
90301
89981
90964
87355
91279
90964
96852
95523
90301
87670
91279
86372
89981
90617
91946
89004
90617
91599
95208
92261
88337
84092
88021
77221
82448
85390
88337
84092
84092
84092
86372
83115
78839
75261
77857
67724
73933
77541
78204
74595
74910
73933
77221
74910
70355
67062
72630
60537
68390
71968
71968
67724
63799
63484
67062
63799
57595
53319
57911
47115
56928
62150
63799
60191
55631
58893
60191
59208
49391
44835
48093
38280
48413
52022
54964
50057
45466
48093
49391
46795
36982
32706
36631
25835
37613
44835


Summary of computational transaction
Raw Inputview raw input (R code)
Raw Outputview raw output of R engine
Computing time2 seconds
R Server'Sir Maurice George Kendall' @ kendall.wessa.net

\begin{tabular}{lllllllll}
\hline
Summary of computational transaction \tabularnewline
Raw Input & view raw input (R code)  \tabularnewline
Raw Output & view raw output of R engine  \tabularnewline
Computing time & 2 seconds \tabularnewline
R Server & 'Sir Maurice George Kendall' @ kendall.wessa.net \tabularnewline
\hline
\end{tabular}
%Source: https://freestatistics.org/blog/index.php?pk=211005&T=0

[TABLE]
[ROW][C]Summary of computational transaction[/C][/ROW]
[ROW][C]Raw Input[/C][C]view raw input (R code) [/C][/ROW]
[ROW][C]Raw Output[/C][C]view raw output of R engine [/C][/ROW]
[ROW][C]Computing time[/C][C]2 seconds[/C][/ROW]
[ROW][C]R Server[/C][C]'Sir Maurice George Kendall' @ kendall.wessa.net[/C][/ROW]
[/TABLE]
Source: https://freestatistics.org/blog/index.php?pk=211005&T=0

Globally Unique Identifier (entire table): ba.freestatistics.org/blog/index.php?pk=211005&T=0

As an alternative you can also use a QR Code:  

The GUIDs for individual cells are displayed in the table below:

Summary of computational transaction
Raw Inputview raw input (R code)
Raw Outputview raw output of R engine
Computing time2 seconds
R Server'Sir Maurice George Kendall' @ kendall.wessa.net


Standard Deviation-Mean Plot
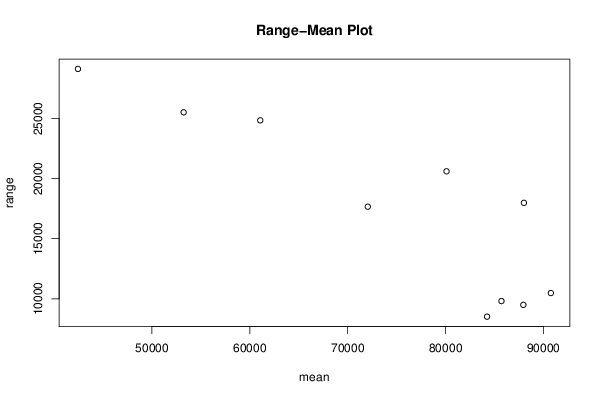
SectionMeanStandard DeviationRange
184244.252854.90372787858515
285716.91666666673029.083733598589813
387953.752971.164483222649497
490763.08333333333039.9628125217510480
5880125006.3613896358317987
680104.58333333335968.6084484246520613
772059.58333333334908.5531187608617667
861071.16666666676841.4906779860324853
953245.58333333337639.3164313228225519
1042447.33333333338454.7518143600329129

\begin{tabular}{lllllllll}
\hline
Standard Deviation-Mean Plot \tabularnewline
Section & Mean & Standard Deviation & Range \tabularnewline
1 & 84244.25 & 2854.9037278785 & 8515 \tabularnewline
2 & 85716.9166666667 & 3029.08373359858 & 9813 \tabularnewline
3 & 87953.75 & 2971.16448322264 & 9497 \tabularnewline
4 & 90763.0833333333 & 3039.96281252175 & 10480 \tabularnewline
5 & 88012 & 5006.36138963583 & 17987 \tabularnewline
6 & 80104.5833333333 & 5968.60844842465 & 20613 \tabularnewline
7 & 72059.5833333333 & 4908.55311876086 & 17667 \tabularnewline
8 & 61071.1666666667 & 6841.49067798603 & 24853 \tabularnewline
9 & 53245.5833333333 & 7639.31643132282 & 25519 \tabularnewline
10 & 42447.3333333333 & 8454.75181436003 & 29129 \tabularnewline
\hline
\end{tabular}
%Source: https://freestatistics.org/blog/index.php?pk=211005&T=1

[TABLE]
[ROW][C]Standard Deviation-Mean Plot[/C][/ROW]
[ROW][C]Section[/C][C]Mean[/C][C]Standard Deviation[/C][C]Range[/C][/ROW]
[ROW][C]1[/C][C]84244.25[/C][C]2854.9037278785[/C][C]8515[/C][/ROW]
[ROW][C]2[/C][C]85716.9166666667[/C][C]3029.08373359858[/C][C]9813[/C][/ROW]
[ROW][C]3[/C][C]87953.75[/C][C]2971.16448322264[/C][C]9497[/C][/ROW]
[ROW][C]4[/C][C]90763.0833333333[/C][C]3039.96281252175[/C][C]10480[/C][/ROW]
[ROW][C]5[/C][C]88012[/C][C]5006.36138963583[/C][C]17987[/C][/ROW]
[ROW][C]6[/C][C]80104.5833333333[/C][C]5968.60844842465[/C][C]20613[/C][/ROW]
[ROW][C]7[/C][C]72059.5833333333[/C][C]4908.55311876086[/C][C]17667[/C][/ROW]
[ROW][C]8[/C][C]61071.1666666667[/C][C]6841.49067798603[/C][C]24853[/C][/ROW]
[ROW][C]9[/C][C]53245.5833333333[/C][C]7639.31643132282[/C][C]25519[/C][/ROW]
[ROW][C]10[/C][C]42447.3333333333[/C][C]8454.75181436003[/C][C]29129[/C][/ROW]
[/TABLE]
Source: https://freestatistics.org/blog/index.php?pk=211005&T=1

Globally Unique Identifier (entire table): ba.freestatistics.org/blog/index.php?pk=211005&T=1

As an alternative you can also use a QR Code:  

The GUIDs for individual cells are displayed in the table below:

Standard Deviation-Mean Plot
SectionMeanStandard DeviationRange
184244.252854.90372787858515
285716.91666666673029.083733598589813
387953.752971.164483222649497
490763.08333333333039.9628125217510480
5880125006.3613896358317987
680104.58333333335968.6084484246520613
772059.58333333334908.5531187608617667
861071.16666666676841.4906779860324853
953245.58333333337639.3164313228225519
1042447.33333333338454.7518143600329129


Regression: S.E.(k) = alpha + beta * Mean(k)
alpha13508.419007576
beta-0.113154410367569
S.D.0.0185900460262944
T-STAT-6.08682787592454
p-value0.000293706308370133

\begin{tabular}{lllllllll}
\hline
Regression: S.E.(k) = alpha + beta * Mean(k) \tabularnewline
alpha & 13508.419007576 \tabularnewline
beta & -0.113154410367569 \tabularnewline
S.D. & 0.0185900460262944 \tabularnewline
T-STAT & -6.08682787592454 \tabularnewline
p-value & 0.000293706308370133 \tabularnewline
\hline
\end{tabular}
%Source: https://freestatistics.org/blog/index.php?pk=211005&T=2

[TABLE]
[ROW][C]Regression: S.E.(k) = alpha + beta * Mean(k)[/C][/ROW]
[ROW][C]alpha[/C][C]13508.419007576[/C][/ROW]
[ROW][C]beta[/C][C]-0.113154410367569[/C][/ROW]
[ROW][C]S.D.[/C][C]0.0185900460262944[/C][/ROW]
[ROW][C]T-STAT[/C][C]-6.08682787592454[/C][/ROW]
[ROW][C]p-value[/C][C]0.000293706308370133[/C][/ROW]
[/TABLE]
Source: https://freestatistics.org/blog/index.php?pk=211005&T=2

Globally Unique Identifier (entire table): ba.freestatistics.org/blog/index.php?pk=211005&T=2

As an alternative you can also use a QR Code:  

The GUIDs for individual cells are displayed in the table below:

Regression: S.E.(k) = alpha + beta * Mean(k)
alpha13508.419007576
beta-0.113154410367569
S.D.0.0185900460262944
T-STAT-6.08682787592454
p-value0.000293706308370133


Regression: ln S.E.(k) = alpha + beta * ln Mean(k)
alpha23.9629838978818
beta-1.38593360436334
S.D.0.316620992411537
T-STAT-4.37726378724103
p-value0.00235741536780084
Lambda2.38593360436334

\begin{tabular}{lllllllll}
\hline
Regression: ln S.E.(k) = alpha + beta * ln Mean(k) \tabularnewline
alpha & 23.9629838978818 \tabularnewline
beta & -1.38593360436334 \tabularnewline
S.D. & 0.316620992411537 \tabularnewline
T-STAT & -4.37726378724103 \tabularnewline
p-value & 0.00235741536780084 \tabularnewline
Lambda & 2.38593360436334 \tabularnewline
\hline
\end{tabular}
%Source: https://freestatistics.org/blog/index.php?pk=211005&T=3

[TABLE]
[ROW][C]Regression: ln S.E.(k) = alpha + beta * ln Mean(k)[/C][/ROW]
[ROW][C]alpha[/C][C]23.9629838978818[/C][/ROW]
[ROW][C]beta[/C][C]-1.38593360436334[/C][/ROW]
[ROW][C]S.D.[/C][C]0.316620992411537[/C][/ROW]
[ROW][C]T-STAT[/C][C]-4.37726378724103[/C][/ROW]
[ROW][C]p-value[/C][C]0.00235741536780084[/C][/ROW]
[ROW][C]Lambda[/C][C]2.38593360436334[/C][/ROW]
[/TABLE]
Source: https://freestatistics.org/blog/index.php?pk=211005&T=3

Globally Unique Identifier (entire table): ba.freestatistics.org/blog/index.php?pk=211005&T=3

As an alternative you can also use a QR Code:  

The GUIDs for individual cells are displayed in the table below:

Regression: ln S.E.(k) = alpha + beta * ln Mean(k)
alpha23.9629838978818
beta-1.38593360436334
S.D.0.316620992411537
T-STAT-4.37726378724103
p-value0.00235741536780084
Lambda2.38593360436334


Parameters (Session):
par1 = 12 ;
Parameters (R input):
par1 = 12 ;
R code (references can be found in the software module):
par1 <- as.numeric(par1)
(n <- length(x))
(np <- floor(n / par1))
arr <- array(NA,dim=c(par1,np))
j <- 0
k <- 1
for (i in 1:(np*par1))
{
j = j + 1
arr[j,k] <- x[i]
if (j == par1) {
j = 0
k=k+1
}
}
arr
arr.mean <- array(NA,dim=np)
arr.sd <- array(NA,dim=np)
arr.range <- array(NA,dim=np)
for (j in 1:np)
{
arr.mean[j] <- mean(arr[,j],na.rm=TRUE)
arr.sd[j] <- sd(arr[,j],na.rm=TRUE)
arr.range[j] <- max(arr[,j],na.rm=TRUE) - min(arr[,j],na.rm=TRUE)
}
arr.mean
arr.sd
arr.range
(lm1 <- lm(arr.sd~arr.mean))
(lnlm1 <- lm(log(arr.sd)~log(arr.mean)))
(lm2 <- lm(arr.range~arr.mean))
bitmap(file='test1.png')
plot(arr.mean,arr.sd,main='Standard Deviation-Mean Plot',xlab='mean',ylab='standard deviation')
dev.off()
bitmap(file='test2.png')
plot(arr.mean,arr.range,main='Range-Mean Plot',xlab='mean',ylab='range')
dev.off()
load(file='createtable')
a<-table.start()
a<-table.row.start(a)
a<-table.element(a,'Standard Deviation-Mean Plot',4,TRUE)
a<-table.row.end(a)
a<-table.row.start(a)
a<-table.element(a,'Section',header=TRUE)
a<-table.element(a,'Mean',header=TRUE)
a<-table.element(a,'Standard Deviation',header=TRUE)
a<-table.element(a,'Range',header=TRUE)
a<-table.row.end(a)
for (j in 1:np) {
a<-table.row.start(a)
a<-table.element(a,j,header=TRUE)
a<-table.element(a,arr.mean[j])
a<-table.element(a,arr.sd[j] )
a<-table.element(a,arr.range[j] )
a<-table.row.end(a)
}
a<-table.end(a)
table.save(a,file='mytable.tab')
a<-table.start()
a<-table.row.start(a)
a<-table.element(a,'Regression: S.E.(k) = alpha + beta * Mean(k)',2,TRUE)
a<-table.row.end(a)
a<-table.row.start(a)
a<-table.element(a,'alpha',header=TRUE)
a<-table.element(a,lm1$coefficients[[1]])
a<-table.row.end(a)
a<-table.row.start(a)
a<-table.element(a,'beta',header=TRUE)
a<-table.element(a,lm1$coefficients[[2]])
a<-table.row.end(a)
a<-table.row.start(a)
a<-table.element(a,'S.D.',header=TRUE)
a<-table.element(a,summary(lm1)$coefficients[2,2])
a<-table.row.end(a)
a<-table.row.start(a)
a<-table.element(a,'T-STAT',header=TRUE)
a<-table.element(a,summary(lm1)$coefficients[2,3])
a<-table.row.end(a)
a<-table.row.start(a)
a<-table.element(a,'p-value',header=TRUE)
a<-table.element(a,summary(lm1)$coefficients[2,4])
a<-table.row.end(a)
a<-table.end(a)
table.save(a,file='mytable1.tab')
a<-table.start()
a<-table.row.start(a)
a<-table.element(a,'Regression: ln S.E.(k) = alpha + beta * ln Mean(k)',2,TRUE)
a<-table.row.end(a)
a<-table.row.start(a)
a<-table.element(a,'alpha',header=TRUE)
a<-table.element(a,lnlm1$coefficients[[1]])
a<-table.row.end(a)
a<-table.row.start(a)
a<-table.element(a,'beta',header=TRUE)
a<-table.element(a,lnlm1$coefficients[[2]])
a<-table.row.end(a)
a<-table.row.start(a)
a<-table.element(a,'S.D.',header=TRUE)
a<-table.element(a,summary(lnlm1)$coefficients[2,2])
a<-table.row.end(a)
a<-table.row.start(a)
a<-table.element(a,'T-STAT',header=TRUE)
a<-table.element(a,summary(lnlm1)$coefficients[2,3])
a<-table.row.end(a)
a<-table.row.start(a)
a<-table.element(a,'p-value',header=TRUE)
a<-table.element(a,summary(lnlm1)$coefficients[2,4])
a<-table.row.end(a)
a<-table.row.start(a)
a<-table.element(a,'Lambda',header=TRUE)
a<-table.element(a,1-lnlm1$coefficients[[2]])
a<-table.row.end(a)
a<-table.end(a)
table.save(a,file='mytable2.tab')