Free Statistics

of Irreproducible Research!

Author's title

Author*Unverified author*
R Software Modulerwasp_smp.wasp
Title produced by softwareStandard Deviation-Mean Plot
Date of computationThu, 08 Aug 2013 11:09:30 -0400
Cite this page as followsStatistical Computations at FreeStatistics.org, Office for Research Development and Education, URL https://freestatistics.org/blog/index.php?v=date/2013/Aug/08/t13759746135441dtka27k20z1.htm/, Retrieved Mon, 29 Apr 2024 13:44:41 +0000
Statistical Computations at FreeStatistics.org, Office for Research Development and Education, URL https://freestatistics.org/blog/index.php?pk=211006, Retrieved Mon, 29 Apr 2024 13:44:41 +0000
QR Codes:

Original text written by user:
IsPrivate?No (this computation is public)
User-defined keywordsNick Hollevoet
Estimated Impact190
Family? (F = Feedback message, R = changed R code, M = changed R Module, P = changed Parameters, D = changed Data)
-       [Standard Deviation-Mean Plot] [TIJDREEKS (B) - S...] [2013-08-08 15:09:30] [3f9aa5867cfe47c4a12580af2904c765] [Current]
Feedback Forum

Post a new message
Dataseries X:
1620
1560
1650
1320
1710
1680
1800
1860
2070
1800
1710
2130
1800
1350
1590
1200
1680
1380
1830
1650
1740
1950
1920
2280
1650
1380
1530
1110
1590
1230
1740
1650
1470
2100
1890
2160
1620
1500
1350
1110
1470
1320
1800
1740
1500
2010
1860
2400
1920
1170
1170
1170
1380
1380
1860
1710
1530
1920
1770
2550
2010
1170
1230
1020
1410
1620
2040
2010
1620
1890
1680
2400
1830
1470
1320
990
1470
1770
2070
1950
1440
2070
1620
2490
2070
1500
1380
930
1470
1410
2130
2130
1620
2100
1560
2430
2070
1530
1170
810
1590
1530
2010
2310
1710
1920
1440
2490


Summary of computational transaction
Raw Inputview raw input (R code)
Raw Outputview raw output of R engine
Computing time2 seconds
R Server'Gwilym Jenkins' @ jenkins.wessa.net

\begin{tabular}{lllllllll}
\hline
Summary of computational transaction \tabularnewline
Raw Input & view raw input (R code)  \tabularnewline
Raw Output & view raw output of R engine  \tabularnewline
Computing time & 2 seconds \tabularnewline
R Server & 'Gwilym Jenkins' @ jenkins.wessa.net \tabularnewline
\hline
\end{tabular}
%Source: https://freestatistics.org/blog/index.php?pk=211006&T=0

[TABLE]
[ROW][C]Summary of computational transaction[/C][/ROW]
[ROW][C]Raw Input[/C][C]view raw input (R code) [/C][/ROW]
[ROW][C]Raw Output[/C][C]view raw output of R engine [/C][/ROW]
[ROW][C]Computing time[/C][C]2 seconds[/C][/ROW]
[ROW][C]R Server[/C][C]'Gwilym Jenkins' @ jenkins.wessa.net[/C][/ROW]
[/TABLE]
Source: https://freestatistics.org/blog/index.php?pk=211006&T=0

Globally Unique Identifier (entire table): ba.freestatistics.org/blog/index.php?pk=211006&T=0

As an alternative you can also use a QR Code:  

The GUIDs for individual cells are displayed in the table below:

Summary of computational transaction
Raw Inputview raw input (R code)
Raw Outputview raw output of R engine
Computing time2 seconds
R Server'Gwilym Jenkins' @ jenkins.wessa.net


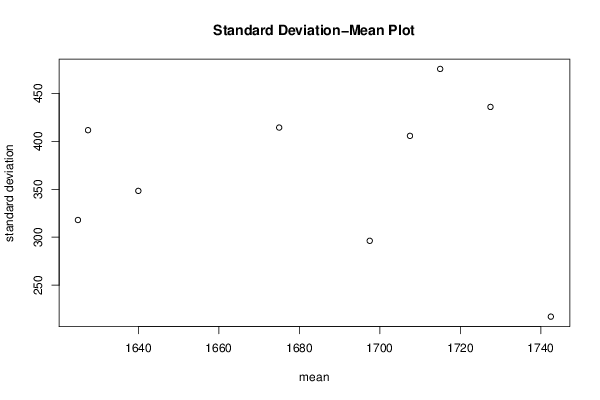
Standard Deviation-Mean Plot
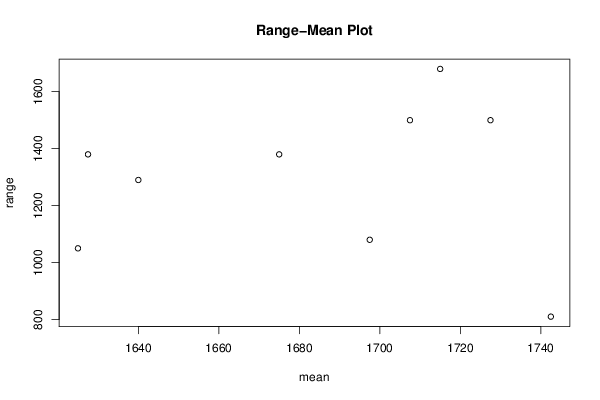
SectionMeanStandard DeviationRange
11742.5217.260840298644810
21697.5296.2838012937781080
31625317.9622619116931050
41640348.2945461948711290
51627.5411.5629853486471380
61675414.279220728331380
71707.5405.622417347151500
81727.5435.7673482699021500
91715475.3467633786371680

\begin{tabular}{lllllllll}
\hline
Standard Deviation-Mean Plot \tabularnewline
Section & Mean & Standard Deviation & Range \tabularnewline
1 & 1742.5 & 217.260840298644 & 810 \tabularnewline
2 & 1697.5 & 296.283801293778 & 1080 \tabularnewline
3 & 1625 & 317.962261911693 & 1050 \tabularnewline
4 & 1640 & 348.294546194871 & 1290 \tabularnewline
5 & 1627.5 & 411.562985348647 & 1380 \tabularnewline
6 & 1675 & 414.27922072833 & 1380 \tabularnewline
7 & 1707.5 & 405.62241734715 & 1500 \tabularnewline
8 & 1727.5 & 435.767348269902 & 1500 \tabularnewline
9 & 1715 & 475.346763378637 & 1680 \tabularnewline
\hline
\end{tabular}
%Source: https://freestatistics.org/blog/index.php?pk=211006&T=1

[TABLE]
[ROW][C]Standard Deviation-Mean Plot[/C][/ROW]
[ROW][C]Section[/C][C]Mean[/C][C]Standard Deviation[/C][C]Range[/C][/ROW]
[ROW][C]1[/C][C]1742.5[/C][C]217.260840298644[/C][C]810[/C][/ROW]
[ROW][C]2[/C][C]1697.5[/C][C]296.283801293778[/C][C]1080[/C][/ROW]
[ROW][C]3[/C][C]1625[/C][C]317.962261911693[/C][C]1050[/C][/ROW]
[ROW][C]4[/C][C]1640[/C][C]348.294546194871[/C][C]1290[/C][/ROW]
[ROW][C]5[/C][C]1627.5[/C][C]411.562985348647[/C][C]1380[/C][/ROW]
[ROW][C]6[/C][C]1675[/C][C]414.27922072833[/C][C]1380[/C][/ROW]
[ROW][C]7[/C][C]1707.5[/C][C]405.62241734715[/C][C]1500[/C][/ROW]
[ROW][C]8[/C][C]1727.5[/C][C]435.767348269902[/C][C]1500[/C][/ROW]
[ROW][C]9[/C][C]1715[/C][C]475.346763378637[/C][C]1680[/C][/ROW]
[/TABLE]
Source: https://freestatistics.org/blog/index.php?pk=211006&T=1

Globally Unique Identifier (entire table): ba.freestatistics.org/blog/index.php?pk=211006&T=1

As an alternative you can also use a QR Code:  

The GUIDs for individual cells are displayed in the table below:

Standard Deviation-Mean Plot
SectionMeanStandard DeviationRange
11742.5217.260840298644810
21697.5296.2838012937781080
31625317.9622619116931050
41640348.2945461948711290
51627.5411.5629853486471380
61675414.279220728331380
71707.5405.622417347151500
81727.5435.7673482699021500
91715475.3467633786371680


Regression: S.E.(k) = alpha + beta * Mean(k)
alpha550.114227845169
beta-0.107448317059863
S.D.0.68875700161761
T-STAT-0.156003230177712
p-value0.880434120508983

\begin{tabular}{lllllllll}
\hline
Regression: S.E.(k) = alpha + beta * Mean(k) \tabularnewline
alpha & 550.114227845169 \tabularnewline
beta & -0.107448317059863 \tabularnewline
S.D. & 0.68875700161761 \tabularnewline
T-STAT & -0.156003230177712 \tabularnewline
p-value & 0.880434120508983 \tabularnewline
\hline
\end{tabular}
%Source: https://freestatistics.org/blog/index.php?pk=211006&T=2

[TABLE]
[ROW][C]Regression: S.E.(k) = alpha + beta * Mean(k)[/C][/ROW]
[ROW][C]alpha[/C][C]550.114227845169[/C][/ROW]
[ROW][C]beta[/C][C]-0.107448317059863[/C][/ROW]
[ROW][C]S.D.[/C][C]0.68875700161761[/C][/ROW]
[ROW][C]T-STAT[/C][C]-0.156003230177712[/C][/ROW]
[ROW][C]p-value[/C][C]0.880434120508983[/C][/ROW]
[/TABLE]
Source: https://freestatistics.org/blog/index.php?pk=211006&T=2

Globally Unique Identifier (entire table): ba.freestatistics.org/blog/index.php?pk=211006&T=2

As an alternative you can also use a QR Code:  

The GUIDs for individual cells are displayed in the table below:

Regression: S.E.(k) = alpha + beta * Mean(k)
alpha550.114227845169
beta-0.107448317059863
S.D.0.68875700161761
T-STAT-0.156003230177712
p-value0.880434120508983


Regression: ln S.E.(k) = alpha + beta * ln Mean(k)
alpha15.5168295679875
beta-1.29633550728114
S.D.3.45582772786273
T-STAT-0.375115778147559
p-value0.718681736243623
Lambda2.29633550728114

\begin{tabular}{lllllllll}
\hline
Regression: ln S.E.(k) = alpha + beta * ln Mean(k) \tabularnewline
alpha & 15.5168295679875 \tabularnewline
beta & -1.29633550728114 \tabularnewline
S.D. & 3.45582772786273 \tabularnewline
T-STAT & -0.375115778147559 \tabularnewline
p-value & 0.718681736243623 \tabularnewline
Lambda & 2.29633550728114 \tabularnewline
\hline
\end{tabular}
%Source: https://freestatistics.org/blog/index.php?pk=211006&T=3

[TABLE]
[ROW][C]Regression: ln S.E.(k) = alpha + beta * ln Mean(k)[/C][/ROW]
[ROW][C]alpha[/C][C]15.5168295679875[/C][/ROW]
[ROW][C]beta[/C][C]-1.29633550728114[/C][/ROW]
[ROW][C]S.D.[/C][C]3.45582772786273[/C][/ROW]
[ROW][C]T-STAT[/C][C]-0.375115778147559[/C][/ROW]
[ROW][C]p-value[/C][C]0.718681736243623[/C][/ROW]
[ROW][C]Lambda[/C][C]2.29633550728114[/C][/ROW]
[/TABLE]
Source: https://freestatistics.org/blog/index.php?pk=211006&T=3

Globally Unique Identifier (entire table): ba.freestatistics.org/blog/index.php?pk=211006&T=3

As an alternative you can also use a QR Code:  

The GUIDs for individual cells are displayed in the table below:

Regression: ln S.E.(k) = alpha + beta * ln Mean(k)
alpha15.5168295679875
beta-1.29633550728114
S.D.3.45582772786273
T-STAT-0.375115778147559
p-value0.718681736243623
Lambda2.29633550728114


Parameters (Session):
par1 = 12 ;
Parameters (R input):
par1 = 12 ;
R code (references can be found in the software module):
par1 <- as.numeric(par1)
(n <- length(x))
(np <- floor(n / par1))
arr <- array(NA,dim=c(par1,np))
j <- 0
k <- 1
for (i in 1:(np*par1))
{
j = j + 1
arr[j,k] <- x[i]
if (j == par1) {
j = 0
k=k+1
}
}
arr
arr.mean <- array(NA,dim=np)
arr.sd <- array(NA,dim=np)
arr.range <- array(NA,dim=np)
for (j in 1:np)
{
arr.mean[j] <- mean(arr[,j],na.rm=TRUE)
arr.sd[j] <- sd(arr[,j],na.rm=TRUE)
arr.range[j] <- max(arr[,j],na.rm=TRUE) - min(arr[,j],na.rm=TRUE)
}
arr.mean
arr.sd
arr.range
(lm1 <- lm(arr.sd~arr.mean))
(lnlm1 <- lm(log(arr.sd)~log(arr.mean)))
(lm2 <- lm(arr.range~arr.mean))
bitmap(file='test1.png')
plot(arr.mean,arr.sd,main='Standard Deviation-Mean Plot',xlab='mean',ylab='standard deviation')
dev.off()
bitmap(file='test2.png')
plot(arr.mean,arr.range,main='Range-Mean Plot',xlab='mean',ylab='range')
dev.off()
load(file='createtable')
a<-table.start()
a<-table.row.start(a)
a<-table.element(a,'Standard Deviation-Mean Plot',4,TRUE)
a<-table.row.end(a)
a<-table.row.start(a)
a<-table.element(a,'Section',header=TRUE)
a<-table.element(a,'Mean',header=TRUE)
a<-table.element(a,'Standard Deviation',header=TRUE)
a<-table.element(a,'Range',header=TRUE)
a<-table.row.end(a)
for (j in 1:np) {
a<-table.row.start(a)
a<-table.element(a,j,header=TRUE)
a<-table.element(a,arr.mean[j])
a<-table.element(a,arr.sd[j] )
a<-table.element(a,arr.range[j] )
a<-table.row.end(a)
}
a<-table.end(a)
table.save(a,file='mytable.tab')
a<-table.start()
a<-table.row.start(a)
a<-table.element(a,'Regression: S.E.(k) = alpha + beta * Mean(k)',2,TRUE)
a<-table.row.end(a)
a<-table.row.start(a)
a<-table.element(a,'alpha',header=TRUE)
a<-table.element(a,lm1$coefficients[[1]])
a<-table.row.end(a)
a<-table.row.start(a)
a<-table.element(a,'beta',header=TRUE)
a<-table.element(a,lm1$coefficients[[2]])
a<-table.row.end(a)
a<-table.row.start(a)
a<-table.element(a,'S.D.',header=TRUE)
a<-table.element(a,summary(lm1)$coefficients[2,2])
a<-table.row.end(a)
a<-table.row.start(a)
a<-table.element(a,'T-STAT',header=TRUE)
a<-table.element(a,summary(lm1)$coefficients[2,3])
a<-table.row.end(a)
a<-table.row.start(a)
a<-table.element(a,'p-value',header=TRUE)
a<-table.element(a,summary(lm1)$coefficients[2,4])
a<-table.row.end(a)
a<-table.end(a)
table.save(a,file='mytable1.tab')
a<-table.start()
a<-table.row.start(a)
a<-table.element(a,'Regression: ln S.E.(k) = alpha + beta * ln Mean(k)',2,TRUE)
a<-table.row.end(a)
a<-table.row.start(a)
a<-table.element(a,'alpha',header=TRUE)
a<-table.element(a,lnlm1$coefficients[[1]])
a<-table.row.end(a)
a<-table.row.start(a)
a<-table.element(a,'beta',header=TRUE)
a<-table.element(a,lnlm1$coefficients[[2]])
a<-table.row.end(a)
a<-table.row.start(a)
a<-table.element(a,'S.D.',header=TRUE)
a<-table.element(a,summary(lnlm1)$coefficients[2,2])
a<-table.row.end(a)
a<-table.row.start(a)
a<-table.element(a,'T-STAT',header=TRUE)
a<-table.element(a,summary(lnlm1)$coefficients[2,3])
a<-table.row.end(a)
a<-table.row.start(a)
a<-table.element(a,'p-value',header=TRUE)
a<-table.element(a,summary(lnlm1)$coefficients[2,4])
a<-table.row.end(a)
a<-table.row.start(a)
a<-table.element(a,'Lambda',header=TRUE)
a<-table.element(a,1-lnlm1$coefficients[[2]])
a<-table.row.end(a)
a<-table.end(a)
table.save(a,file='mytable2.tab')