Free Statistics
of Irreproducible Research!
Description of Statistical Computation | |||||||||||||||||||||
|---|---|---|---|---|---|---|---|---|---|---|---|---|---|---|---|---|---|---|---|---|---|
| Author's title | |||||||||||||||||||||
| Author | *Unverified author* | ||||||||||||||||||||
| R Software Module | rwasp_meanplot.wasp | ||||||||||||||||||||
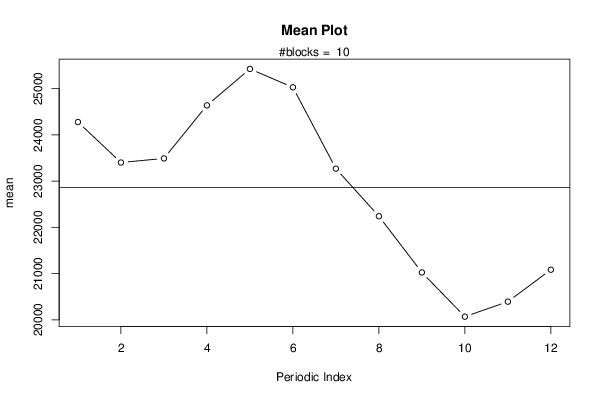
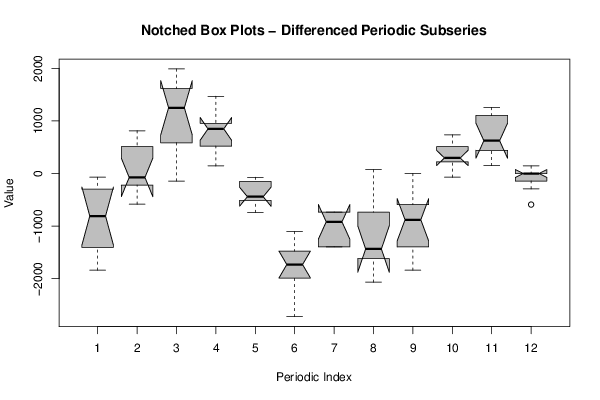
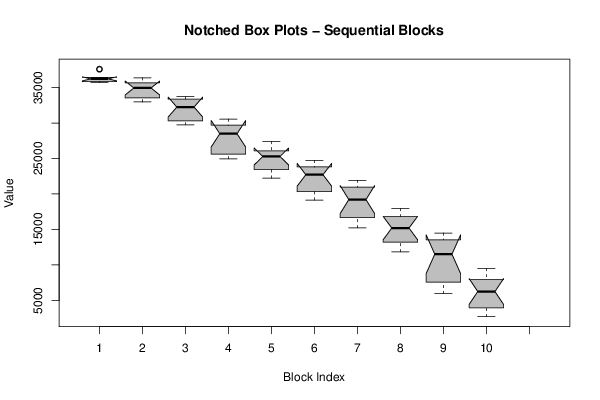
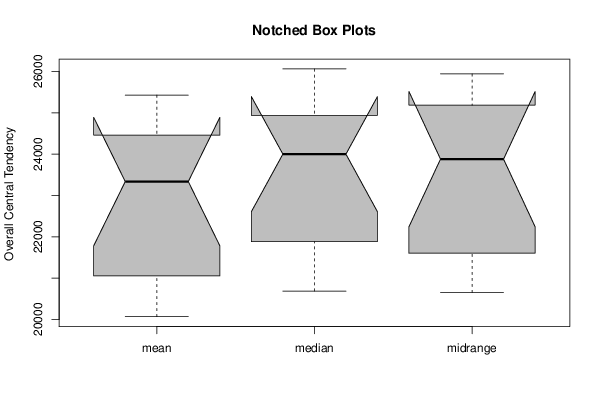
| Title produced by software | Mean Plot | ||||||||||||||||||||
| Date of computation | Mon, 12 Aug 2013 09:17:25 -0400 | ||||||||||||||||||||
| Cite this page as follows | Statistical Computations at FreeStatistics.org, Office for Research Development and Education, URL https://freestatistics.org/blog/index.php?v=date/2013/Aug/12/t1376313489t7hvzhxhvitu8si.htm/, Retrieved Sat, 27 Apr 2024 16:56:22 +0000 | ||||||||||||||||||||
| Statistical Computations at FreeStatistics.org, Office for Research Development and Education, URL https://freestatistics.org/blog/index.php?pk=211029, Retrieved Sat, 27 Apr 2024 16:56:22 +0000 | |||||||||||||||||||||
| QR Codes: | |||||||||||||||||||||
|
| |||||||||||||||||||||
| Original text written by user: | |||||||||||||||||||||
| IsPrivate? | No (this computation is public) | ||||||||||||||||||||
| User-defined keywords | Anthony Van Dyck | ||||||||||||||||||||
| Estimated Impact | 124 | ||||||||||||||||||||
Tree of Dependent Computations | |||||||||||||||||||||
| Family? (F = Feedback message, R = changed R code, M = changed R Module, P = changed Parameters, D = changed Data) | |||||||||||||||||||||
| - [Univariate Data Series] [Tijdreeks 1 - stap 2] [2013-08-12 11:07:04] [c4bfab449d963e708b9482b0c0d301bf] - P [Univariate Data Series] [Tijdreeks A - Stap 2] [2013-08-12 11:17:51] [fffbdc2eb6bf36a612a50d50ad291a0a] - RMP [Histogram] [Tijdreeks A - Stap 3] [2013-08-12 11:22:38] [fffbdc2eb6bf36a612a50d50ad291a0a] - R P [Histogram] [Tijdreeks A -stap 5] [2013-08-12 11:38:26] [c4bfab449d963e708b9482b0c0d301bf] - P [Histogram] [Tijdreeks A -stap 5] [2013-08-12 11:42:06] [c4bfab449d963e708b9482b0c0d301bf] - RMP [Harrell-Davis Quantiles] [Tijdreeks A - sta...] [2013-08-12 12:35:57] [fffbdc2eb6bf36a612a50d50ad291a0a] - R P [Harrell-Davis Quantiles] [Tijdreeks A - sta...] [2013-08-12 12:48:29] [c4bfab449d963e708b9482b0c0d301bf] - RMP [Mean Plot] [Tijdreeks A - sta...] [2013-08-12 13:17:25] [946b987ea445738c2c70467dba74cc4f] [Current] | |||||||||||||||||||||
| Feedback Forum | |||||||||||||||||||||
Post a new message | |||||||||||||||||||||
Dataset | |||||||||||||||||||||
| Dataseries X: | |||||||||||||||||||||
36439 36368 36290 36147 37615 37543 36439 35705 35777 35777 35848 35998 35998 35335 35043 35335 36368 36218 34822 33640 33419 32977 33276 33640 33497 33198 32614 33198 33718 33568 31873 31139 30405 29814 29743 30184 29593 29372 29151 30405 30548 29814 27826 26943 25547 24955 25247 25689 25689 25326 25247 26430 27385 26943 25468 24735 23189 22234 22968 23702 23702 22747 22676 23922 24735 24442 22968 22013 19947 19142 19434 20688 20759 18921 19584 21201 21935 21493 19506 18109 16492 15238 15751 16855 16563 14946 15459 17076 17960 17447 15459 14576 13251 11854 12075 13179 13322 11997 12218 14063 14504 13764 11042 9646 7801 5963 6554 7359 7217 5813 6625 8613 9496 9055 7288 5892 4417 2721 3021 3534 | |||||||||||||||||||||
Tables (Output of Computation) | |||||||||||||||||||||
| |||||||||||||||||||||
Figures (Output of Computation) | |||||||||||||||||||||
Input Parameters & R Code | |||||||||||||||||||||
| Parameters (Session): | |||||||||||||||||||||
| par1 = 12 ; | |||||||||||||||||||||
| Parameters (R input): | |||||||||||||||||||||
| par1 = 12 ; | |||||||||||||||||||||
| R code (references can be found in the software module): | |||||||||||||||||||||
par1 <- as.numeric(par1) | |||||||||||||||||||||